


 text in
  English (pdf)
 Article in xml format
 Article references
 Send this article by e-mail
 Cited by SciELO
  Cited by Google
  Similars in
SciELO
Similars in
SciELO  Similars in Google
 Permalink
Remark
| 1) Why was this study conducted? |
| The Latin American population has been exposed to significant racial mixing. In mixed populations such as this, understanding the genotype/phenotype interactions behind complex diseases such as obesity and obesity-related diseases remains a challenging task because genetic stratification represents a source of confounding bias. However, the diversity in this type of population is also an opportunity to discover associated genetic factors that could be useful in understanding complex diseases such as obesity. The present study provides evidence by testing the hypothesis that common Single Nucleotide Polymorphisms (SNPs) in FTO and IRX3 genes are associated with obesity and metabolic syndrome-related disorders; and that there is a significant interaction between both genes, when tested in a Latin American population in which a tri-hybrid genetic mixture has been previously described. |
| 2) What were the most relevant results of the study? |
| Genetic variants in FTO gene were found to be unrelated to obesity or body weight, metabolic disorders (ie, hypertension, hyperglycemia, dyslipidemias, type 2 diabetes mellitus), and metabolic syndrome. On the other hand, IRX3 gene was found to be associated with excess body weight even after adjustment for genetic stratification. |
| 3) What do these results contribute? |
| The findings of the current study showed no evidence of nonrandom segregation between the FTO and IRX3 SNPs in this sample of Latin American adults, possibly associated with the genetic substructure and the recent admixture process, which could be interfering with the measurement of intergenic applications. However, the design of other studies aimed at describing the role of the IRX3 gene and its product in energy metabolism appear to hold promise in understanding the real epidemic of excess body weight in populations with high genetic diversity. |
Introduction
Obesity is a public health priority in almost every region worldwide 1. Its prevalence has continuously increased during the last three decades, shaping an epidemic pattern that has negatively impacted high-, middle- and low-income communities 2. As obesity prevalence increases, so do the frequency of metabolic disorders (e.g., dyslipidemias and high blood pressure, etc.), which share some pathophysiologic pathways 3.
Genetic factors have been widely identified to be involved in obesity and the pathogenesis of obesity-related diseases, such as Diabetes Mellitus type 2, dyslipidemia, hypertension, and cardiovascular disease 4. Among these, the Fat Mass and Obesity-related (FTO) has been one of the genes most consistently related to common obesity, according to findings from many Genome-Wide Association Studies (GWAS) 5,6. FTO gene plays an important role in regulating appetite and energy homeostasis 7. In addition, some allelic variants have been strongly associated with fat deposition 7. Despite that, the role of variations in the FTO chromosomal region and the protein FTO (a nuclear demethylase) on the cellular mechanisms responsible for the development of obesity has not been completely described 8,9.
Recent studies have shown that some allelic variants in FTO first intron might be influencing the transcription regulation of genes located near loci10. In this regard, Smemo et al.11) (13, and other authors have uncovered long-range functional connections between FTO first intron variants and the expression of the Iroquois Homeobox 3 (IRX3) gene 12,13. Furthermore, there is increasing evidence that epistasis may play a role in disease risk, thus, the analysis of the relationship between these two genes could be particularly promissory since the activity of the IRX3 protein has been associated with appetite control and obesity phenotype in animals 11.
The Latin American population has been exposed to more significant racial admixture. In admixed populations like this, understanding the genotype/phenotype interactions behind complex diseases such as obesity and obesity-related diseases remains a challenging task because genetic stratification represents a source of bias brought about by confounding phenomena. However, the diversity in this type of population is also an opportunity to uncover associated genetic factors that might be helpful to understanding complex diseases such as obesity.
Based on those previous findings, some studies have been developed to analyze plausible linkage disequilibrium between FTO and IRX3 SNPs 14,15. Altogether, these results have revealed that this genomic interaction could be identified at the population level, which contributes to understanding the mechanisms of genetic predisposition to obesity and how genetic factors influence the current epidemic. Hence, the present study was designed to add evidence by testing the hypothesis that i) common SNPs in FTO and IRX3 are associated with obesity and related disorders; ii) there is significant interaction between both genes. These hypotheses were tested on a Latin American population in which a tri-hybrid genetic admixing has been previously described 16.
Materials and Methods
Subjects
A cross-sectional study was carried out in Cartagena de Indias, a 1-million inhabitants city located on the Colombian Caribbean Coast 17. A sample of 792 subjects was employed to achieve 80% power of discrimination of genetic association with 2.5/3.5 (heterozygotes/homozygotes) odds ratio, assuming an outcome with 25% prevalence, 25% minor allele frequency, complete linkage disequilibrium (D’= 1), and 5% alpha-coefficient, according to calculations described by other authors, and as was applied in a previous work 18. Genetic Power Calculator software (http://zzz.bwh.harvard.edu/gpc/cc2.html) was used for this calculation 19.
Inclusion criteria included non-sibling subjects from both genders aging more than 18 years old who live in urban areas of Cartagena de Indias, a city located on the Colombian Caribbean Coast (an admixed population with a predominant European ancestry (~60%) due to Spaniard’s colonization between XVI and XIX centuries) 20. Siblings were initially identified by surnames comparison and then confirmed by telephone; therefore, first- and second-degree siblings were excluded for the analysis.
Those suffering from diseases that affect their body weight as primary endocrine disorders, genetic pathology, cancer, or surgical obesity treatment, as well as pregnant or breastfeeding, were also excluded. All subjects gave their informed consent to participate in the study, following the University of Cartagena ethics committee considerations. Subjects with missing data were excluded.
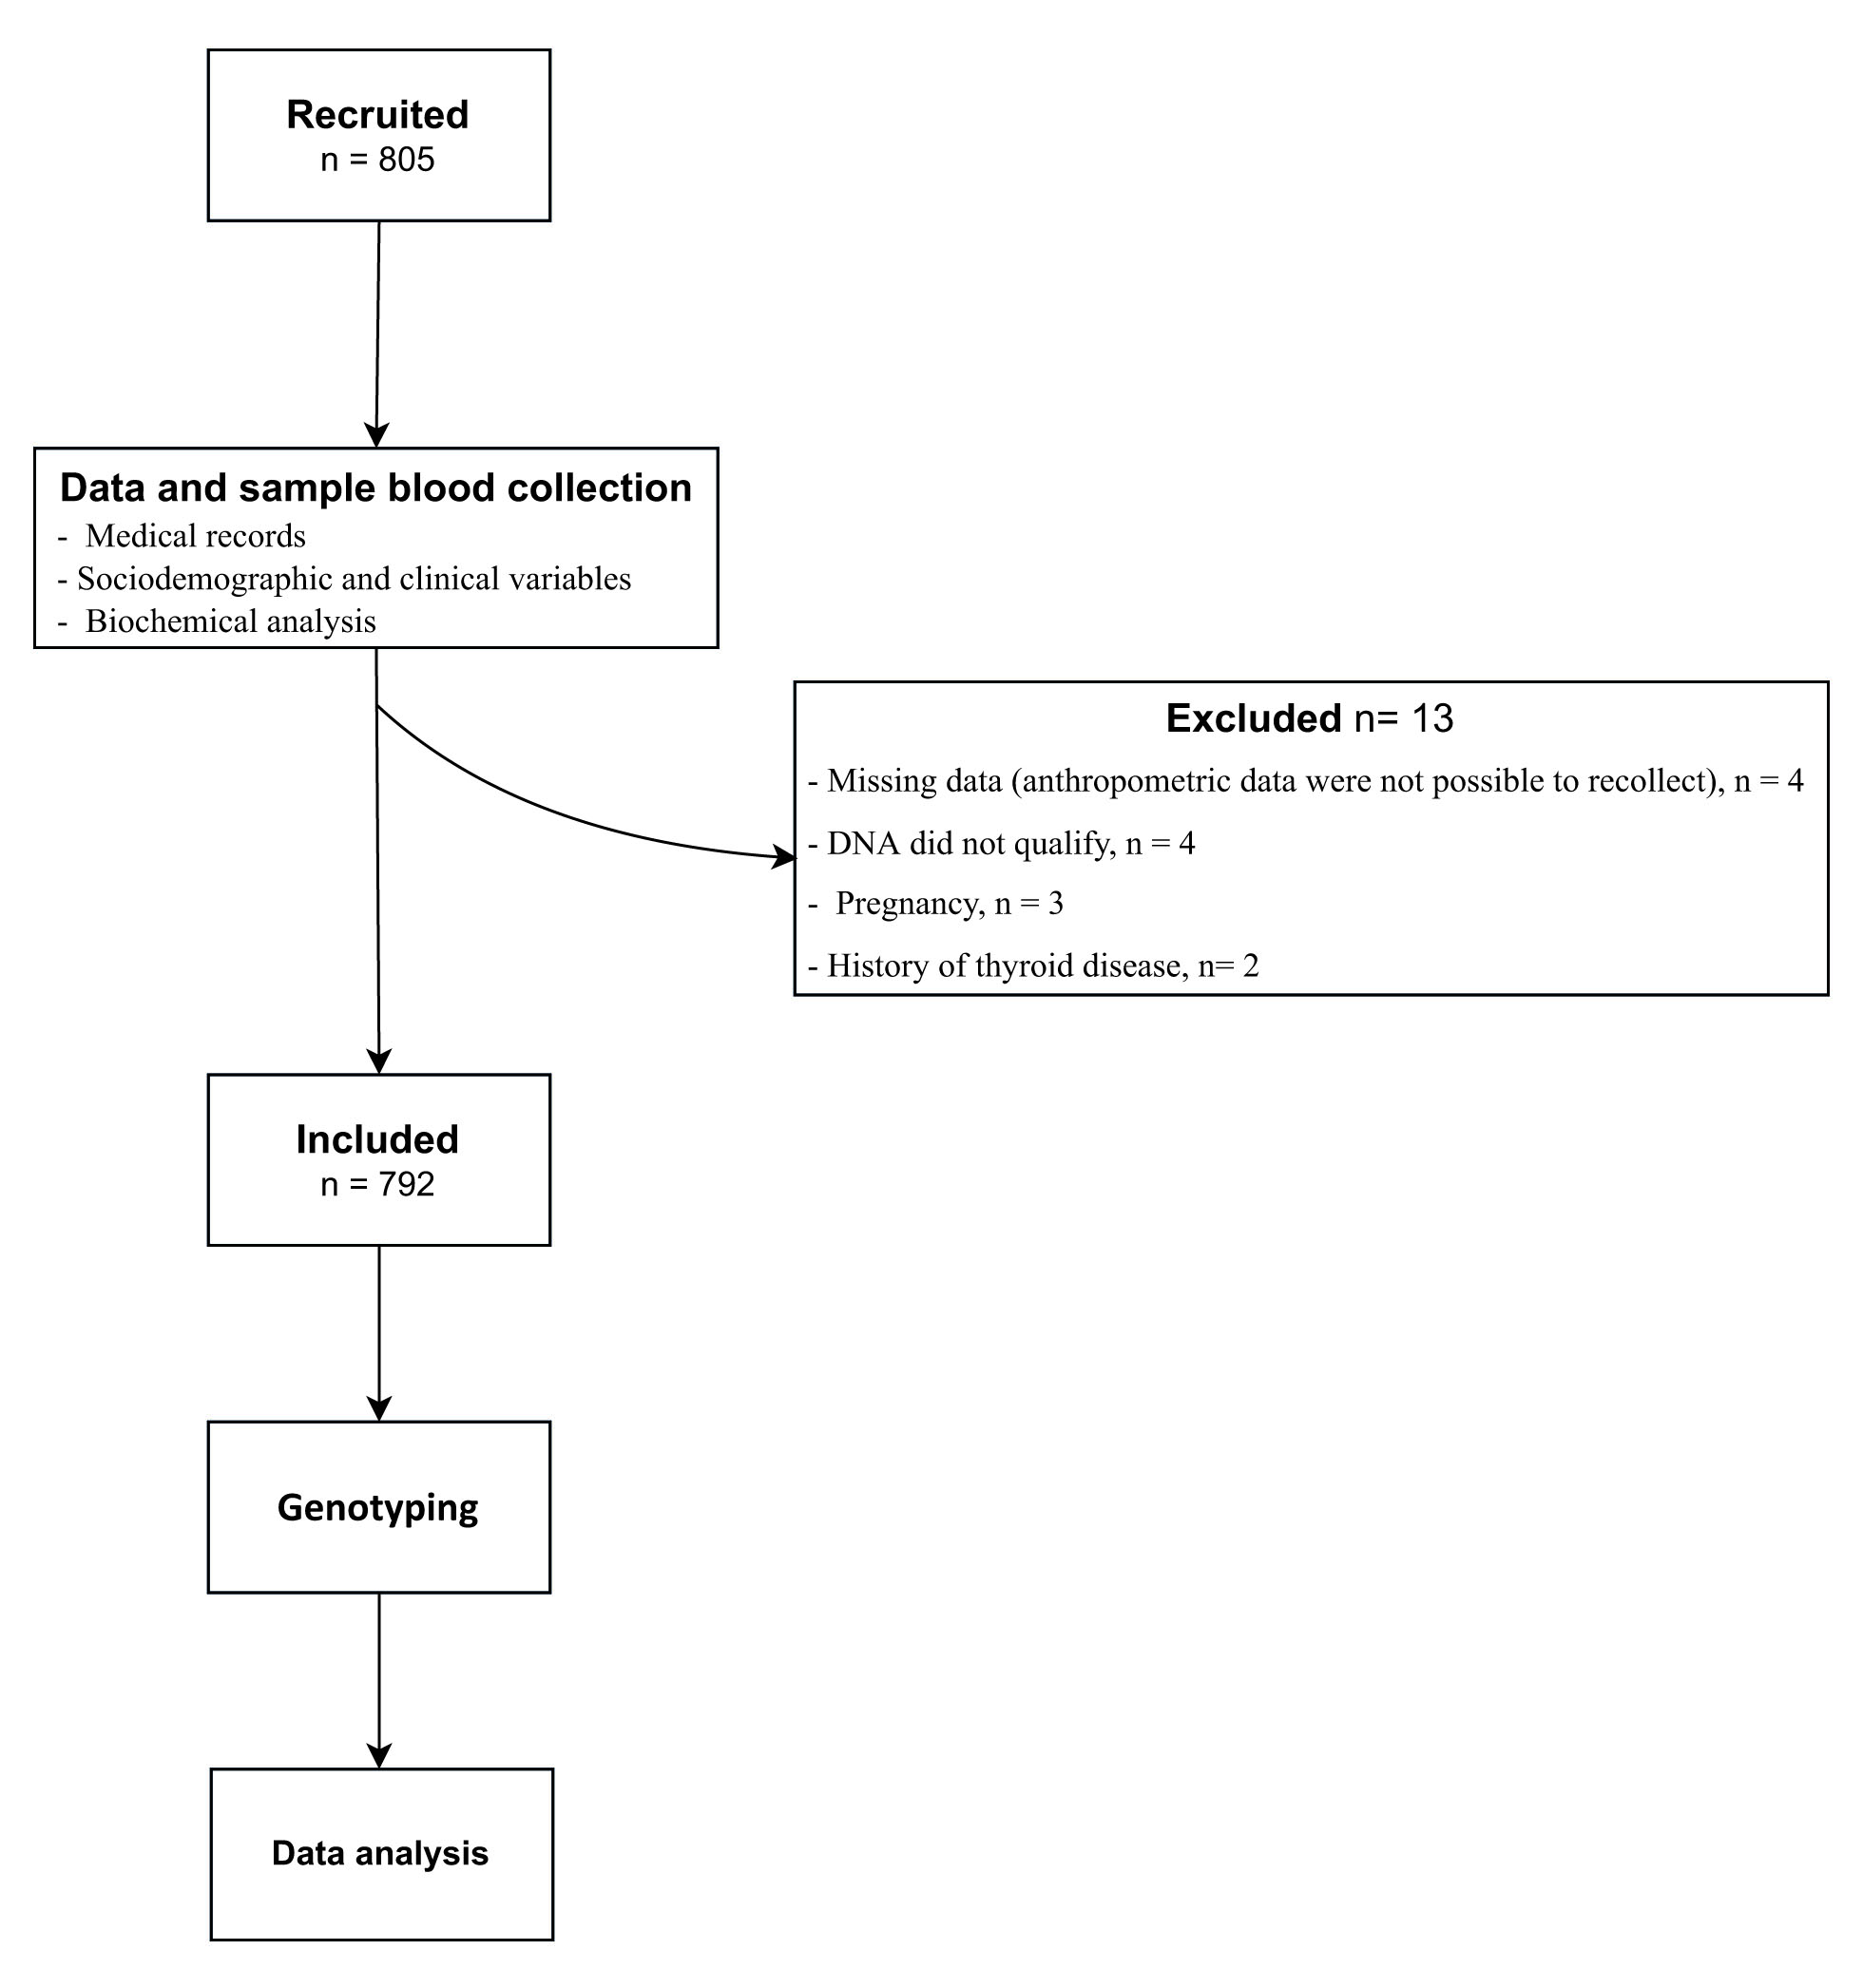
Participants were enrolled by trained medical staff in charge of performing an interview and physical examination focused on sociodemographic and clinical variables and the medical record of metabolic-related disorders (Figure 1).
Anthropometric variables
During the physical examination, anthropometric data were obtained. Height, weight, and waist circumference were recorded; all these measurements were obtained according to international diabetes guidelines for metabolic syndrome described by World Health Organization (WHO) 21. Height was measured in meters (m) using a stadiometer with the subject barefoot and straight. Weight was recorded in kilograms (Kg) through a calibrated bascule with the participant wearing light clothes without shoes. Body mass index (BMI) was calculated by dividing weight in Kg between the square of the height in meters (m2). An inelastic metric tape was used to measure the waist and hip circumference with a patient in a standing position, ensuring that the tape did not compress the skin. Blood pressure was measured using a sphygmomanometer following the 8th Joint National Committee (JNC8) 22.
Biochemical analysis
A whole-blood sample was collected from each one of the participants, who should have a fast of at least 8 hours. Serum concentrations of glucose, triglycerides (TG), and HDL cholesterol (HDLc) were measured through colorimetric assays at the UNIMOL laboratory at the University of Cartagena, following standard protocols.
Obesity and metabolic traits
Obesity was defined using the cut-off points for BMI suggested by the WHO 21,23. Bodyweight excess (BWE) was defined as either overweight or obesity.
Hypertension or High Blood Pressure (HBP) was determined according to JNC8 22:
Adults <60 years old: systolic ≥ 140 mmHg, diastolic ≥90 mmHg
Adults ≥60 years old: systolic ≥150 mmHg, diastolic ≥90 mmHg
Metabolic syndrome and related conditions were defined through the Joint Interim Statement (JIS) criteria, considering the criteria described elsewhere 22,24.
Abdominal obesity: waist circumference in men ≥90 cm and women ≥80 cm.
Dyslipidemia: Hypertriglyceridemia: TG ≥150 mg/dL or drug treatment for high serum TG. Low HDLc: men, HDLc <40 mg/dL; women, HDLc <50 mg/dL.
Hyperglycemia: glucose impaired fasting ≥100 mg/dl or drug treatment for elevated glucose
Diabetes was determined through the American Diabetes Association (2018) criteria 23,25, considering the presence of the disease with fasting blood glucose values> 126 mg/dL or by HbA1c values ≥ 6.5%.
Genotyping
Common variants in FTO and IRX3 were identified using 1,000 genome project reports. For this purpose, the bioinformatic resource SNiPA was used 26,27. SNPs with a minor allele frequency (MAF) ≥0.25 and correlation coefficient (R2)= 1.0 were selected using data from populations with European ancestry. With this procedure, 3 variants were selected for FTO: rs9939609 (c.46-23525T>A), rs8050136 (c.46-27777C>A), rs17817449 (c.46-30685T>G) and only one for IRX3: rs3751723 (c.-235C>A), based on previous reports where the linkage disequilibrium between both genes was analyzed 14,15,26,28. These variants are proxies for several variants and have shown antecedents of genetic association with metabolic traits and obesity-related diseases 26.
SNPs were genotyped with quantitative polymerase chain reaction (qPCR) using Taqman probes (Thermo Fisher Scientific, Inc., Waltham, MA, USA). In addition, allelic discrimination and data were analyzed by StepOne Real-Time PCR Software (Thermo Fisher Scientific, Inc., Waltham, MA, USA).
Statistics
Sociodemographic, anthropometric, biochemicals, and the other metabolic variables were described using the central tendency and frequency values as necessary, and the Lilliefors test was realized to verify the normality. Finally, mean values were compared using t-test and frequencies with Ji 2 or Fisher’s exact test.
Allelic and genotype frequencies were described through direct count. Hardy-Weinberg Equilibrium was assessed through the inbreeding coefficient (Fis) values using Genetix 4.05 software. Linkage disequilibrium between the selected SNPs was estimated with the package genetics for R program 3.5.0 29; D’ (D prime) and R2 (R-square) were reported.
Associations between continuous traits and genotype distributions were analyzed using the analysis of variance (ANOVA) or the Kruskal Wallis test, where appropriate. Relations between categorical variables (metabolic traits), were determined with Ji 2.
Additive genotype models were evaluated using generalized regression models. Haplotype models were also performed to estimate the association between FTO and IRX3 SNPs with obesity and related outcomes. These models were adjusted by age, sex, and BMI, except for the bodyweight excess (overweight and obesity) analyses, where this last variable (BMI) was not employed due to collinearity. R program version 3.5.0., with the genetics and PredictABEL packages, was employed 29.
Associations were adjusted by genetic stratification assuming a three-hybrid substructure (k= 3) using a Bayesian approach (Markov Chain Monte Carlo, or MCMC) with 100,000 replications using the STRAT software version 1.1 for DOS/Windows.
The three-hybrid admixture pattern applied is based on previous reports from Cartagena de Indias, where informative ancestry markers (AIMs) and the Y chromosome were used to describe local genetic substructure and ancestry distribution 15,16,20,28. In this study, 17 Y chromosome short tandem repeats (Y-STR; AmpFLSTR® Yfiler® PCR Amplification Kit, Thermo Fisher, Inc., USA) were used to confirm the admixture in sampled males 20
Results
General data
A total of 805 subjects were enrolled out, 13 were excluded (Figure 1). Finally, registers of 792 subjects (55.7% men and 44.3%women) were used in further analyses. The median age was 36 IQR: (28;52) years. Age ranges of included individuals were distributed according to population pyramid 17,20.
Anthropometric and serum biochemical variables
Median values for height, weight and BMI were 1.66 m IQR: (1.60;1.73), 71.3 Kg IQR: (60.7;81.5) and 25.6 Kg/m2 IQR: (22.7;28.6), respectively. For the abdominal circumference median was 92 cm IQR: (84;99). Regarding blood pressure, the median values for systolic and diastolic pressure were 110 mmHg IQR: (110-120) and 74 mmHg IQR: (70;80) respectively.
Respecting biochemical variables, the median value for glycemia was 89.4 IQR: (78.6;104.4), serum concentration of triglycerides was 151.1 mg/dL IQR: (113.9;187.8), of HDL cholesterol was 46.0 mg/dL IQR: (39.2-51.8) and of total cholesterol was 183.3 mg/dL IQR: (160.4;205.4).
Metabolic traits
About 56.8% (n= 450/792) of general population had excess of weight; Among this, 39.7% (n= 315/792) had overweight and the 17.1% (n= 135/792) had obesity.
HBP was found in 13.7% (n= 109/792) of total sample. The frequency of hyperglycemia was 32.0% (n= 254/792), and 17.1% (n= 136) was diagnosed with type 2 Diabetes Mellitus (Glycemia ≥126 mg/dL, or drug treatment). More than a half of individuals had high serum concentrations of triglycerides (50.8%, n= 403/792), 43.5% (n= 345/792) low concentrations of HDL cholesterol and 38.7% (n= 307/792) had high serum concentrations of total cholesterol. Metabolic syndrome was diagnosed in 31.9% (n= 253/792) of population.
Genotyping
Genotyping assays were performed on the 792 subjects. Genotype distribution and Fis values for Hardy-Weinberg equilibrium are shown in Table 1.
Table 1 Allelic frequencies and genotype distributions for FTO and IRX3 genes
| Gene | n | (%) | Fis | p |
|---|---|---|---|---|
| FTO | ||||
| rs9939609 (c.46-23525T>A) | ||||
| A | 497 | (31.4) | 0.09 | 0.134 |
| T | 1087 | (68.6) | ||
| AA | 89 | (11.2) | ||
| AT | 319 | (40.3) | ||
| TT | 384 | (48.5) | ||
| rs8050136 (c.46-27777C>A) | ||||
| A | 481 | (30.4) | 0.08 | 0.205 |
| C | 1103 | (69.6) | ||
| AA | 83 | (10.5) | ||
| AC | 315 | (39.8) | ||
| CC | 394 | (49.7) | ||
| rs17817449 (c.46-30685T>G) | ||||
| G | 466 | (29.4) | 0.08 | 0.262 |
| T | 1118 | (70.6) | ||
| GG | 78 | (9.9) | ||
| GT | 310 | (39.1) | ||
| TT | 404 | (51.0) | ||
| IRX3 | ||||
| rs3751723 (c.-235C>A) | ||||
| T | 394 | (24.9) | 0.04 | 0.09 |
| G | 1190 | (75.1) | ||
| TT | 55 | (7.0) | ||
| GG | 453 | (57.2) | ||
| GT | 284 | (35.8) | ||
Fis: inbreeding coefficient.
Linkage Disequilibrium: association between alleles
FTO gen SNPs (rs9939609, rs17817449 and rs8050136) were not in LD with IRX3 gen SNP (rs3751723) (D’≤0.03; R2: ≤0.03).
Genetic associations
Anthropometric variables were described through median and frequency values and were compared according to genotype distributions. In the FTO gene, for HDL cholesterol, TT homozygotes (rs9939609) shown lower values in comparison with AT+AA genotype (p= 0.037), CC homozygotes (rs8050136) unlike AC+AA genotypes (p=0.049), and TT allele unlike GG+TT genotype (p= 0.036) (Table 2). The statistical association between metabolic alterations and genotypes was not found (Table 3).
Table 2 Median values of anthropometric and biochemistry parameters according to the genotype for FTO and IRX3 SNPs.
| FTO | |||||||||||||
|---|---|---|---|---|---|---|---|---|---|---|---|---|---|
| rs9939609 | |||||||||||||
| AA | AT | TT | p | AT+TT | p | AT+AA | p | ||||||
| BMI (Kg/m2) | 25.3 | 22.2-28 | 25.4 | 22.7-28.5 | 25.9 | 22.9-28.9 | 0.2 | 25.7 | 22.8-28.7 | 0.376 | 25.3 | 22.3-28.2 | 0.786 |
| Waist Cir. (cm) | 88.0 | 80.5-99 | 91.0 | 84.0-99.0 | 93.0 | 85-100 | 0.070 | 92.0 | 85.0-99.0 | 0.079 | 92.0 | 83.0-99.0 | 0.053 |
| Blood Pressure | |||||||||||||
| Systolic (mmHg) | 110.0 | 100.0-120.0 | 110.0 | 100.0-120.0 | 110.0 | 100.0-120.0 | 0.704 | 110.0 | 100.0-120.0 | 0.403 | 110 | 100.0-120.0 | 0.749 |
| Diastolic (mmHg) | 72.0 | 68.0-80.0 | 72.0 | 68.0-80.0 | 76.0 | 20.0-80.0 | 0.390 | 74.0 | 70.0-80.0 | 0.736 | 74.0 | 68.0-80.0 | 0.258 |
| Serum concentrations | |||||||||||||
| Glucose (mg/dL) | 89.10 | 75.7-99.7 | 89.0 | 78.6-103.6 | 89.5 | 79.6-105.3 | 0.793 | 89.5 | 79.0-104.8 | 0.510 | 89.0 | 78.2-103.0 | 0.697 |
| Triglycerides | 148.7 | 109.0-175.9 | 152.7 | 114.5-192.0 | 151.9 | 114.0-189.2 | 0.324 | 152.2 | 114.2-191.5 | 0.133 | 151.9 | 113.6-186.6 | 0.581 |
| HDLc | 46.3 | 37.5-51.6 | 46.8 | 40.6-53.7 | 45.1 | 38.9-51.0 | 0.051 | 45.9 | 39.5-51.9 | 0.639 | 46.5 | 39.8-53.5 | 0.037* |
| Totalc | 175.9 | 159.0-197.9 | 184.0 | 162.5-205.5 | 183.9 | 160.1-207.4 | 0.453 | 184.0 | 160.9-206.4 | 0.212 | 182.8 | 161.1-204.0 | 0.786 |
| rs8050136 | |||||||||||||
| AA | AC | CC | p | AC+CC | p | AC+AA | p | ||||||
| BMI (Kg/m2) | 25.3 | 22.2-28 | 25.4 | 22.7-28.2 | 25.9 | 22.9-28.9 | 0.301 | 25.6 | 22.2-28.7 | 0.512 | 25.4 | 22.4-28.2 | 0.123 |
| Waist Cir. (cm) | 90.0 | 81.5-99.0 | 91.00 | 83.0-99.0 | 92.0 | 85.0-100.0 | 0.310 | 92.0 | 84.0-99.0 | 0.321 | 91.0 | 83.0-99.0 | 0.151 |
| Blood Pressure | |||||||||||||
| Systolic (mmHg) | 110.0 | 100.0-120.0 | 110.0 | 100.5-120.0 | 110.0 | 100.0-120.0 | 0.846 | 110.0 | 100.0-120.0 | 0.989 | 110.0 | 100.0-120.0 | 0.591 |
| Diastolic (mmHg) | 78.0 | 70.0-81.0 | 72.0 | 68.0-80.0 | 76.0 | 70.0-80.0 | 0.324 | 74.0 | 70.0-80.0 | 0.319 | 74.0 | 68.0-80.0 | 0.475 |
| Serum concentrations | |||||||||||||
| Glucose (mg/dL) | 91.0 | 76.1-103.4 | 88.7 | 78.3-103.2 | 89.6 | 79.8-105.2 | 0.875 | 89.1 | 79.0-104.4 | 0.971 | 88.9 | 78.0-103.2 | 0.620 |
| Triglycerides | 148.5 | 107.0-175.4 | 151.8 | 114.5-190.3 | 153.4 | 114.1-189.3 | 0.283 | 152.2 | 114.3-189.4 | 0.117 | 151.2 | 113.1-186.4 | 0.427 |
| HDLc | 46.5 | 37.7-52.6 | 46.5 | 40.3-53.7 | 45.1 | 38.9-50.7 | 0.122 | 45.7 | 39.5-51.7 | 0.911 | 46.5 | 39.7-53.5 | 0.049* |
| Totalc | 175.4 | 159.0-198.3 | 184.0 | 161.0-205.4 | 185.0 | 160.9-206.2 | 0.508 | 184.1 | 160.9-206.2 | 0.247 | 182.1 | 160.0-203.8 | 0.605 |
| rs17817449 | |||||||||||||
| GG | GT | TT | p | GT+TT | p | GT+GG | p | ||||||
| BMI (Kg/m2) | 25.3 | 22.2-28.0 | 25.3 | 22.4-28.2 | 25.9 | 22.9-28.9 | 0.232 | 25.6 | 22.8-28.7 | 0.470 | 25.3 | 22.3-28.2 | 0.088 |
| Waist Cir. (cm) | 89.5 | 81.2-98.7 | 91.0 | 83.0-99.0 | 92.0 | 85.0-100.0 | 0.196 | 92.0 | 84.0-99.0 | 0.304 | 91.0 | 83.0-99.0 | 0.081 |
| Blood Pressure | |||||||||||||
| Systolic (mmHg) | 100.0 | 100.0-120.0 | 110.0 | 100.0-120.0 | 110.0 | 100.0-120.0 | 0.841 | 110.0 | 100.0-120.0 | 0.613 | 110.0 | 100.0-120.0 | 0.913 |
| Diastolic (mmHg) | 76.0 | 68.5-80.0 | 74.0 | 68.0-80.0 | 76.0 | 70.0-80.0 | 0.499 | 74.0 | 70.0-90.0 | 0.823 | 74.0 | 68.0-80.0 | 0.311 |
| Serum concentrations | |||||||||||||
| Glucose (mg/dL) | 90.6 | 75.2-103.7 | 88.7 | 78.6-102.9 | 89.5 | 79.6-105.3 | 0.924 | 89.2 | 79.0-104.3 | 0.817 | 89.0 | 78.2-103.0 | 0.704 |
| Triglycerides | 145.2 | 100.5-177.4 | 150.7 | 114.4-187.5 | 154.0 | 114.3-192.6 | 0.135 | 152.2 | 114.4-189.2 | 0.071 | 149.0 | 112.3-185.4 | 0.152 |
| HDLc | 46.7 | 37.5-53.9 | 46.5 | 40.6-53.4 | 45.1 | 38.8-50.8 | 0.100 | 45.7 | 39.5-51.5 | 0.792 | 46.5 | 39.9-53.5 | 0.036* |
| Totalc | 175.2 | 156.0-197.6 | 184.2 | 162.3-206.8 | 184.5 | 160.8-206.0 | 0.336 | 184.3 | 161.3-206.2 | 0.141 | 182.4 | 160.0-204.4 | 0.709 |
| IRX3 | |||||||||||||
| rs3751723 | |||||||||||||
| TT | GT | GG | p | GT+GG | p | GT+TT | p | ||||||
| BMI (Kg/m2) | 25.0 | 21.8-27.8 | 25.4 | 22.7-28.5 | 25.9 | 22.8-28.9 | 0.182 | 25.6 | 22.8-28.8 | 0.132 | 25.3 | 22.7-28.4 | 0.137 |
| Waist Cir. (cm) | 92.0 | 83.0-100.0 | 92.0 | 84.0-98.7 | 92.0 | 85.0-99.0 | 0.753 | 92.0 | 83.0-99.0 | 0.487 | 92.0 | 83.8-99.0 | 0.621 |
| Blood Pressure | |||||||||||||
| Systolic (mmHg) | 110.0 | 100.0-120.0 | 110.0 | 102.0-120.0 | 110.0 | 100.0-120.0 | 0.447 | 110.0 | 100.0-120.0 | 0.675 | 110.0 | 102.0-120.0 | 0.204 |
| Diastolic (mmHg) | 76.0 | 70.0-80.0 | 76.0 | 70.0-80.0 | 74.0 | 70.0-80.0 | 0.390 | 74.0 | 70.0-80.0 | 0.266 | 76.0 | 70.0-80.0 | 0.265 |
| Serum concentrations | |||||||||||||
| Glucose (mg/dL) | 90.0 | 81.0-109.2 | 90.0 | 77.0-105.1 | 88.8 | 78.9-103.4 | 0.735 | 89.4 | 78.0-104.2 | 0.435 | 90.0 | 78.0-105.5 | 0.751 |
| Triglycerides | 151.9 | 119.0-196.9 | 148.4 | 108.9-187.7 | 153.9 | 116.2-186.8 | 0.590 | 152.0 | 113.6-187.3 | 0.729 | 148.6 | 110.0-188.3 | 0.418 |
| HDLc | 45.9 | 39.4-51.0 | 46.1 | 38.9-52.8 | 45.7 | 39.7-51.4 | 0.966 | 46.0 | 39.2-52.2 | 0.874 | 46.1 | 38.9-52.3 | 0.882 |
| Totalc | 177.0 | 153.9-199.1 | 185.9 | 161.7-210.7 | 182.1 | 160.1-203.8 | 0.190 | 183.7 | 160.9-205.7 | 0.296 | 185.5 | 160.4-208.4 | 0.275 |
Data are median (1st quartile - 3rd quartile).
Table 3 Allelic frequencies and genotype distributions for FTO and IRX3 genes
| Gene | FTO | ||||||||||||||||||||||||||
|---|---|---|---|---|---|---|---|---|---|---|---|---|---|---|---|---|---|---|---|---|---|---|---|---|---|---|---|
| rs9939609 | rs8050136 | rs17817449 | |||||||||||||||||||||||||
| AA | AT | TT | p | AA | AC | CC | p | GG | GT | TT | p | ||||||||||||||||
| AA vs AT+TT | TT vs AT+AA | AA vs AC+CC | CC vs AC+AA | GG vs GT+TT | TT vs GT+GG | ||||||||||||||||||||||
| Anthropometric and biochemical parameters | |||||||||||||||||||||||||||
| BMI | |||||||||||||||||||||||||||
| Normal weight | 40 | (44.9) | 148 | (46.4) | 154 | (40.1) | 36 | (43.4) | 145 | (46.0) | 161 | (40.9) | 35 | (44.9) | 144 | (46.5) | 163 | (40.4) | |||||||||
| Overweight | 32 | (36.0) | 123 | (38.6) | 160 | (41.7) | 30 | (36.1) | 124 | (39.4) | 161 | (40.9) | 28 | (35.9) | 119 | (38.4) | 168 | (41.6) | |||||||||
| Obese | 17 | (19.1) | 48 | (15.0) | 70 | (18.2) | 0.441 | 0.708 | 0.232 | 17 | (20.5) | 46 | (14.6) | 72 | (18.2) | 0.514 | 0.621 | 0.385 | 15 | (19.2) | 47 | (15.1) | 73 | (18.0) | 0.484 | 0.731 | 0.256 |
| Excess of weight | 49 | (55.1) | 171 | (43.6) | 230 | (59.9) | 47 | (56.6) | 170 | (54.0) | 233 | (59.1) | 43 | (45.1) | 166 | (43.5) | 241 | (59.6) | |||||||||
| WC | |||||||||||||||||||||||||||
| Abdominal Obesity | 59 | (66.3) | 215 | (67.4) | 282 | (73.4) | 57 | (68.7) | 211 | (67.0) | 288 | (73.1) | 54 | (69.2) | 206 | (66.4) | 296 | (73.3) | |||||||||
| Not altered | 30 | (33.7) | 104 | (32.6) | 102 | (26.6) | 0.151 | 0.463 | 0.063 | 26 | (31.3) | 104 | (33.0) | 106 | (26.9) | 0.199 | 0.845 | 0.090 | 24 | (30.8) | 104 | (33.6) | 108 | (26.7) | 0.1399 | 0.946 | 0.064 |
| BP | |||||||||||||||||||||||||||
| HBP | 14 | (15.7) | 46 | (14.4) | 49 | (12.7) | 14 | (16.9) | 47 | (14.9) | 48 | (12.2) | 12 | (15.4) | 44 | (14.2) | 53 | (13.1) | |||||||||
| Not altered | 75 | (84.3) | 273 | (85.6) | 335 | (87.3) | 0.693 | 0.682 | 0.489 | 69 | (83.1) | 268 | (85.1) | 346 | (87.8) | 0.395 | 0.584 | 0.237 | 66 | (84.6) | 266 | (85.8) | 351 | (86.9) | 0.8342 | 0.791 | 0.664 |
| Serum glucose | |||||||||||||||||||||||||||
| Hyperglycemia | 24 | (27.0) | 111 | (34.8) | 119 | (30.0) | 26 | (31.3) | 107 | (34.0) | 121 | (30.7) | 24 | (30.8) | 105 | (33.9) | 125 | (30.9) | |||||||||
| Not altered | 65 | (73.0) | 208 | (65.2) | 265 | (70.0) | 0.307 | 0.329 | 0.578 | 57 | (68.7) | 208 | (66.0) | 273 | (69.3) | 0.645 | 0.976 | 0.459 | 54 | (69.2) | 205 | (66.1) | 279 | (69.1) | 0.6843 | 0.895 | 0.535 |
| Serum TG | |||||||||||||||||||||||||||
| HyperTG | 44 | (49.4) | 164 | (51.4) | 195 | (50.8) | 40 | (48.2) | 159 | (50.5) | 204 | (51.8) | 37 | (47.4) | 154 | (49.7) | 212 | (52.5) | |||||||||
| Not altered | 45 | (50.6) | 155 | (48.6) | 189 | (49.2) | 0.945 | 0.859 | 1 | 43 | (51.8) | 156 | (49.5) | 190 | (48.2) | 0.824 | 0.687 | 0.667 | 41 | (52.6) | 157 | (50.3) | 192 | (47.5) | 0.6185 | 0,601 | 0.399 |
| Serum HDLc | |||||||||||||||||||||||||||
| Low HDLc | 43 | (48.3) | 130 | (40.8) | 172 | (44.8) | 40 | (48.2) | 127 | (40.3) | 178 | (45.2) | 38 | (48.7) | 185 | (40.3) | 182 | (45.0) | |||||||||
| Not altered | 46 | (51.7) | 189 | (59.2) | 212 | (55.2) | 0.353 | 0.397 | 0.544 | 43 | (51.8) | 188 | (59.7) | 216 | (54.8) | 0.288 | 0.433 | 0.400 | 40 | (51.3) | 125 | (56.7) | 222 | (55.0) | 0.2822 | 0.396 | 0.429 |
| TC | |||||||||||||||||||||||||||
| Hight TC | 59 | (33.7) | 188 | (41.1) | 238 | (38.0) | 29 | (34.9) | 129 | (40.9) | 149 | (37.8) | 25 | (32.1) | 130 | (41.9) | 152 | (37.6) | |||||||||
| Not altered | 30 | (66.3) | 131 | (58.9) | 146 | (62.0) | 0.414 | 0.355 | 0.731 | 54 | (65.1) | 186 | (59.1) | 245 | (62.2) | 0.523 | 0.524 | 0.638 | 53 | (67.9) | 180 | (58.1) | 252 | (62.4) | 0.2214 | 0.246 | 0.549 |
| MetS | |||||||||||||||||||||||||||
| Yes | 27 | (30.3) | 100 | (31.3) | 126 | (32.8) | 27 | (32.5) | 96 | (30.5) | 130 | (33.0) | 25 | (32.0) | 93 | (30.0) | 135 | (33.4) | |||||||||
| No | 62 | (69.7) | 219 | (68.7) | 258 | (67.2) | 0.864 | 0.822 | 0.665 | 56 | (67.5) | 219 | (69.5) | 264 | (67.0) | 0.769 | 1 | 0.579 | 53 | (68.0) | 217 | (70.0) | 269 | (66.6) | 0.624 | 1 | 0.406 |
| Diabetes | |||||||||||||||||||||||||||
| Yes | 13 | (14.6) | 59 | (18.5) | 64 | (16.7) | 14 | (16.9) | 56 | (17.8) | 66 | (16.8) | 13 | (16.7) | 55 | (17.7) | 68 | (16.8) | |||||||||
| No | 76 | (85.4) | 260 | (81.5) | 320 | (83.3) | 0.646 | 0.594 | 0.786 | 69 | (83.1) | 259 | (82.2) | 328 | (83.2) | 0.934 | 1 | 0.827 | 65 | (83.3) | 255 | (82.3) | 336 | (83.2) | 0.942 | 1 | 0.869 |
Data are numbers (%). *p <0.05, Abbreviations: Abd. obesity - abdominal obesity, BMI - body mass index, HDLc - high-density lipoprotein cholesterol, HyperTG - hypertriglyceridemia, MetS - metabolic syndrome, TG - triglycerides, WC - waist circumference.
In the regression models where all SNPs were included as variables, TT genotype (rs9939609) was found to be associated with waist circumference (p= 0.04; adj-p= 0.01). IRX3 SNP was found to be associated with BWE (OR= 1.06, adj-p= 0.03) (Table 4). Also, one FTO-IRX3 haplotype was found to be associated with BWE (G-A-A-T, rs17817449-rs8050136-rs9939609-rs3751723; OR= 0.67, p= 0.04).
Table 4 Association of FTO and IRX3 genes variants with metabolic disorders
| FTO | IRX3 | |||||||||||||||||||
|---|---|---|---|---|---|---|---|---|---|---|---|---|---|---|---|---|---|---|---|---|
| Metabolic traits | rs9939609 | rs8050136 | rs17817449 | rs3751723 | ||||||||||||||||
| Beta coef. | OR | 95% CI | p* | Adjusted p | Beta coef. | OR | 95% CI | p* | Adjusted p | Beta coef. | OR | 95% CI | p* | Adjusted p | Beta coef. | OR | 95% CI | p* | Adjusted p | |
| Weight excess | -0.036 | 0.96 | 0.91-1.01 | 0.156 | 0.225 | -0.026 | 0.97 | 0.92-1.02 | 0.319 | 0.363 | -0.036 | 0.96 | 0.91-1.01 | 0.167 | 0.194 | 0.057 | 1.06 | 1.00-1.12 | 0.039* | 0.024 |
| Abd. Obesity | -0.043 | 0.95 | 0.91-1.00 | 0.068 | 0.346 | -0.035 | 0.96 | 0.92-1.01 | 0.141 | 0.152 | -0.037 | 0.96 | 0.91-1.01 | 0.123 | 0.131 | -0.007 | 0.99 | 0.94-1.04 | 0.764 | 0.057 |
| HBP | 0.015 | 1.01 | 0.98-1.05 | 0.394 | 0.124 | 0.024 | 1.02 | 0.98-1.06 | 0.175 | 0.076 | 0.011 | 1.01 | 0.97-1.04 | 0.547 | 0.323 | -0.002 | 0.99 | 0.95-1.03 | 0.898 | 0.948 |
| Hyperglycemia | -0.001 | 0.99 | 0.95-1.04 | 0.965 | 0.618 | 0.013 | 1.01 | 0.96-1.06 | 0.590 | 0.396 | 0.010 | 1.01 | 0.96-1.06 | 0.683 | 0.476 | -0.011 | 0.98 | 0.93-1.04 | 0.657 | 0.722 |
| Hyper TG | -0.002 | 0.99 | 0.94-1.05 | 0.925 | 0.879 | -0.016 | 0.98 | 0.93-1.03 | 0.542 | 0.501 | -0.026 | 0.97 | 0.92-1.02 | 0.328 | 0.304 | 0.043 | 1.04 | 0.98-1.10 | 0.124 | 0.254 |
| Low HDLc | -0.001 | 0.99 | 0.94-1.05 | 0.958 | 0.709 | -0.007 | 0.99 | 0.94-1.04 | 0.787 | 0.650 | -0.005 | 0.99 | 0.94-1.04 | 0.829 | 0.664 | -0.007 | 0.99 | 0.93-1.04 | 0.785 | 0.348 |
| High Col | -0.004 | 0.99 | 0.94-1.04 | 0.859 | 0.798 | 0.001 | 1.00 | 0.95-1.05 | 0.952 | 0.824 | -0.001 | 0.99 | 0.94-1.05 | 0.944 | 0.950 | -0.007 | 0.99 | 0.94-1.04 | 0.790 | 0.940 |
| MetS | -0.013 | 0.98 | 0.94-1.03 | 0.592 | 0.758 | -0.010 | 0.98 | 0.94-1.03 | 0.678 | 0.760 | -0.016 | 0.98 | 0.93-1.03 | 0.500 | 0.552 | -0.003 | 0.99 | 0.94-1.04 | 0.889 | 0.499 |
| Diabetes | -0.0009 | 0.99 | 0.96-1.03 | 0.961 | 0.663 | 0.003 | 1.00 | 0.96-1.04 | 0.843 | 0.646 | 0.002 | 1.00 | 0.96-1.04 | 0.889 | 0.705 | -0.004 | 0.99 | 0.95-1.03 | 0.839 | 0.976 |
*p < 0.017 were considered as statistically significant (Bonferroni correction). † Admixture adjustment with Monte-Carlo-Markov Chain (k = 3). An additive model was assessed through a logistic regression where risk alleles were interpreted as the unit. Genetic variations in rs9939609 (AA = 2, AT = 1, and TT = 0), rs8050136 (AA = 2, AC = 1, and CC = 0), rs17817449 (GG= 2, GT= 1, and TT = 2) and rs3751723 (TT= 0, GT = 1, and GG = 2), were included as independent variables. Age, sex, and body mass index were included as confounding variables (except for the analysis of body weight excess in which only age and sex were used). An admixture adjustment was performed through a Monte-Carlo-Markov Chain where a three-hybrid genetic stratification was assumed. Abbreviations: Abd. obesity - abdominal obesity, HDLc - high-density lipoprotein cholesterol, HyperTG - hypertriglyceridemia, MetS - metabolic syndrome.
The additive model showed a significant association between excess weight and the SNP rs3751723 in IRX3 gen (OR= 1.06, p= 0.024), taking “G” as the risk allele. The statistical significance of these relations continued after admixture adjustment for a three-hybrid population (p= 0.03) (Table 4). However, an additional analysis was performed, and statistical significance was not found (Table 5).
Table 5 Analysis of interactions between FTO rs9939609, rs8050136, rs17817449, and IRX3 rs3751723 to obesity and metabolic alterations
| Metabolic traits | Best interacting model | Training Balance Accuracy | Testing Balance Accuracy | CVC | OR | 95% CI | p* |
|---|---|---|---|---|---|---|---|
| Weight excess | IRX3 rs3751723 | 0.5376 | 0.4937 | 7/10 | 1.05 | 0.28-3.85 | 0.8281 |
| IRX3 rs3751723, FTO rs17817449 | 0.5541 | 0.5198 | 9/10 | 1.22 | 0.32-4.70 | 0.0547 | |
| FTO rs9939609, FTO rs17817449, IRX3 rs3751723 | 0.5642 | 0.5173 | 7/10 | 1.20 | 0.32-4.48 | 0.1719 | |
| Abd. Obesity | FTO rs9939609 | 0.5388 | 0.5187 | 6/10 | 1.31 | 0.32-5.39 | 0.3770 |
| FTO rs17817449, IRX3 rs3751723 | 0.5434 | 0.5057 | 4/10 | 1.13 | 0.27-4.65 | 0.3770 | |
| FTO rs9939609, FTO rs8050136, IRX3 rs3751723 | 0.5497 | 0.4902 | 5/10 | 0.98 | 0.23-4.12 | 0.6230 | |
| HBP | FTO rs8050136, | 0.5320 | 0.4940 | 9/10 | 1.32 | 0.16-10.3 | 0.8281 |
| FTO rs8050136, IRX3 rs3751723 | 0.5437 | 0.4315 | 6/10 | 1.93 | 0.88-4.23 | 0.9893 | |
| FTO rs9939609, FTO rs8050136, IRX3 rs3751723 | 0.5524 | 0.4462 | 7/10 | 1.57 | 0.11-21.3 | 0.9893 | |
| Hyperglycemia | FTO rs9939609 | 0.5282 | 0.4902 | 8/10 | 0.98 | 0.24-3.95 | 0.8281 |
| FTO rs9939609, IRX3 rs3751723 | 0.5363 | 0.4818 | 5/10 | 0.89 | 0.21-3.66 | 0.8281 | |
| FTO rs9939609, FTO rs8050136, IRX3 rs3751723 | 0.5430 | 0.4780 | 8/10 | 0.83 | 0.19-3.63 | 0.9893 | |
| Hyper TG | IRX3 rs3751723 | 0.5323 | 0.5164 | 10/10 | 1.27 | 0.34-4.70 | 0.0547 |
| FTO rs9939609, IRX3 rs3751723 | 0.5362 | 0.4992 | 5/10 | 1.11 | 0.29-4.12 | 0.1719 | |
| FTO rs9939609, FTO rs17817449, IRX3 rs3751723 | 0.5426 | 0.5014 | 4/10 | 1.12 | 0.30-4.14 | 0.1719 | |
| Low HDLc | FTO rs8050136 | 0.5266 | 0.4987 | 5/10 | 1.09 | 0.27-4.39 | 0.6230 |
| FTO rs8050136, IRX3 rs3751723 | 0.5322 | 0.4741 | 5/10 | 0.86 | 0.22-3.29 | 0.8281 | |
| FTO rs9939609, FTO rs8050136, IRX3 rs3751723 | 0.5372 | 0.4691 | 6/10 | 0.89 | 0.22-3.48 | 0.9453 | |
| High Col | IRX3 rs3751723 | 0.5320 | 0.4972 | 7/10 | 1.06 | 0.27-4.09 | 0.6230 |
| FTO rs17817449, IRX3 rs3751723 | 0.5385 | 0.4921 | 8/10 | 1.04 | 0.26-4.21 | 0.8281 | |
| FTO rs9939609, FTO rs17817449, IRX3 rs3751723 | 0.5456 | 0.4778 | 9/10 | 0.85 | 0.19-3.73 | 0.9893 | |
| Diabetes | IRX3 rs3751723 | 0.5291 | 0.4653 | 8/10 | 0.68 | 0.08-5.73 | 0.9990 |
| FTO rs9939609, IRX3 rs3751723 | 0.5468 | 0.4419 | 9/10 | 0.68 | 0.11-4.27 | 0.9990 | |
| FTO rs9939609, FTO rs8050136, IRX3 rs3751723 | 0.5524 | 0.4514 | 10/10 | 0.65 | 0.10-4.20 | 1.00 | |
| MetS | FTO rs17817449 | 0.5195 | 0.4858 | 8/10 | 1.00 | 0.22-4.40 | 0.8281 |
| FTO rs17817449, IRX3 rs3751723 | 0.5306 | 0.4683 | 9/10 | 0.85 | 0.21-3.45 | 0.8281 | |
| FTO rs9939609, FTO rs17817449, IRX3 rs3751723 | 0.5355 | 0.4548 | 6/10 | 0.72 | 0.17-3.02 | 0.9990 |
Abd. obesity - abdominal obesity, HDLc - high-density lipoprotein cholesterol, HyperTG - hypertriglyceridemia, MetS - metabolic syndrome.
Discussion
In the current study, FTO and IRX3 variations were assessed to find a genetic association with obesity and related disorders. Also, linkage disequilibrium between both genes was analyzed. According to our results, genetic variants in FTO were found to be unrelated to obesity or body weight, metabolic disorders (i.e., HBP, Hyperglycemia, dyslipidemias, type 2 Diabetes Mellitus,) and metabolic syndrome. On the other hand, IRX3 was found to be associated with body weight excess even after the adjustment by genetic stratification. Furthermore, despite previous reports, both genes were found to be in linkage equilibrium in this Latin American admixed population 28.
FTO has been repeatedly associated with obesity in European and Asian populations. In Latin America, Saldaña-Alvárez et al.30, published a genetic association study with the Mexican population where five SNPs in FTO (rs1121980, rs17817449, rs3751812, rs9930506, and rs17817449) were found to be related with obesity class II/III, while the SNP rs9930506 was associated with all obesity grades (I-III) 29,30. Similarly, the SNP rs17817449 in the FTO region was associated with glycemic traits in adults from one Colombian Andean city 31. On the other hand, other studies have agreed with the current work. For instance, Mexican adults and children found no significant association between FTO and BMI (β = 0.187, p= 0.143), and a similar finding was reported for WC (β = 0.409, p= 0.208) 32. Such discrepancies between Latin American studies show the complexity of genetic association analyses in admixed populations. Some of the non-significant results might be thought to be caused by the strictness in applying statistical procedures 33.
It is important to note that most Latin American communities are experiencing an intense nutrition transition. Under this phenomenon, a large proportion of inter-personal variability of BMI would be influenced by social and economic factors, such as urbanization and income, among others. It is plausible that the influence of socio-economic variables could have attenuated the impact of FTO genetic variations on the susceptibility to obesity. Similar interactions have been seen in other studies where the effect size and statistical significance are modified by environmental factors (e.g., dietary behaviors) 34,35.
The prevalence of body weight excess was associated with IRX3. A 10% increase in overweight or obesity frequency was found when rs3751723 genotype changed from GG to TT. This result coincides with recent studies from multiple populations in which the IRX3 genomic region has been related to anthropometric traits and obesity 14,28,36. Considering that this gene has been identified as a plausible effector for the influence of FTO on bodyweight 10-13, the current genetic associations might be evidence supporting the biological role of IRX3 on weight control as it has been suggested in animal models 12,13. According to this, further studies focused on the cellular and physiologic mechanisms behind the role of this gene on the development of obesity are warrant.
In addition to the suspected central regulation of appetite, some authors have described an association of IRX3 expression in adipocyte tissue with energy dissipation (through mitochondrial thermogenesis), and fat storage 12. This finding suggests that risk alleles in IRX3 might be involved in obesity pathogenesis through several mechanisms and that rs3751723 could be linked to gene expression and adipocyte metabolism. If subjects with this genetic variation show a different expression profile and adipose tissue physiology might be an interesting focus in further researches.
Srivastrava et al. 28, reported linkage disequilibrium between both genes in a population from North India. Although a similar phenomenon is thought to be occurring in other groups, the findings from the current study showed no evidence of non-random segregation between the FTO and IRX3 SNPs in this sample of Latin American adults. In this regard, the genetic sub-structure and recent admixture process remain concerning issues that could be interfering with the measurement of inter-gene regulations.
In conclusion, a genetic association between IRX3 and body weight was found in Latin American adults. Furthermore, this relation persisted as statistically significant after an adjustment for sex, age, and genetic ancestry was performed. According to these results, it is plausible that IRX3 gene expression might be involved in obesity prevalence in this population; hence, further studies aimed to describe the role of this gene and its product on energy metabolism seems to be promissory in the understanding of current body weight excess epidemic.

