


 texto en
  Inglés (pdf)
 Articulo en XML
 Referencias del artículo
 Enviar articulo por email
 Citado por SciELO
  Citado por Google
  Similares en
SciELO
Similares en
SciELO  Similares en Google
 Permalink
Remark
| 1) Why was this study conducted? |
| Given the high prevalence of children with obesity, there is a need of a practical indicator to identify those with cardiovascular risk factors (CRFs) to prevent future complications. Body mass index (BMI) is commonly used and is associated with CFRs. However, BMI requires children´s age and sex, and accordingly specific cutoffs. The waist-to-height Ratio (WHtR) has the advantage of not requiring this information, simplifying the process. WHtR have shown higher associations with CRFs than BMI in adults, but in children studies show contradictory results. Therefore, this study analyzed the agreement between BMI and WHtR to identify preschool and school children with CRFs. |
| 2) What were the most relevant results of the study? |
| In preschool children (3-5 years) there was no agreement between WHtR and BMI to identify kids with CRFs. In school children (5-10 years) WHtR showed good agreement with BMI to classify kid´s nutritional status and to identify those with CRFs. |
| 3) What do these results contribute? |
| This study provides evidence that BMI and WHtR perform similarly to identify school children with CRFs but not in preschool children. |
Introduction
There has been a rapid increase in childhood overweight and obesity in many countries worldwide in the last decades 1. The prevalence of children with overweight increased by around 50% (from 11.0% to 16.8%) and the prevalence of obesity by more than 100% (from 3.4% to 7.6%) in Colombia, from 2005 to 2015 2. This is problematic since obese children are at increased risk of developing cardiovascular diseases, and the arteriosclerotic process may initiate during the first decade of life 3,4. Therefore, there is an urgent need to identify children with obesity and cardiovascular risk factors (CRFs) to implement the appropriate care 5. The body mass index (BMI) is commonly used to classify obesity in children. However, this indicator has limitations since it measures the excess in body weight not the excess of body fat or the body fat distribution 6. The waist-to-height Ratio (WHtR) is an indicator more related to abdominal obesity than BMI, and it has been suggested to be used instead of- or with- BMI for screening obesity and CRFs in children 5,7,8.
The WHtR is an efficient tool to evaluate obesity in children 7,9,10. It is calculated by simply dividing waist circumference by body height. Unlike the BMI, the WHtR application in children does not require the use of sex and age-specific cut-offs. The use of a single threshold value (≥0.50) for all age groups and sex makes the WHtR an indicator easy to apply and interpret 10. Furthermore, the WHtR appears to be more sensitive than BMI as an early warning of health risk, given its higher association with central obesity 10,11.
Several studies have found higher associations between CRFs with WHtR than with BMI 7,8. These findings are generally accepted in adults 11-13, but the superiority of WHtR over BMI is not clear in children 14,15. Furthermore, there is controversy about the plausible application of the WHtR cut-off (≥0.50) in children of different ages and ethnic groups 16,17. Limited data exist about the agreement between WHtR and BMI to identify Colombian children with CFRs; which is crucial to consider the use of WHtR for CRFs screening in youth. Therefore, this study aimed 1) to analyze the association of WHtR and BMI with CFRs in preschool and school children and 2) to examine the agreement between WHtR and BMI to identify kids with CFRs.
Materials and Methods
Study design and participants
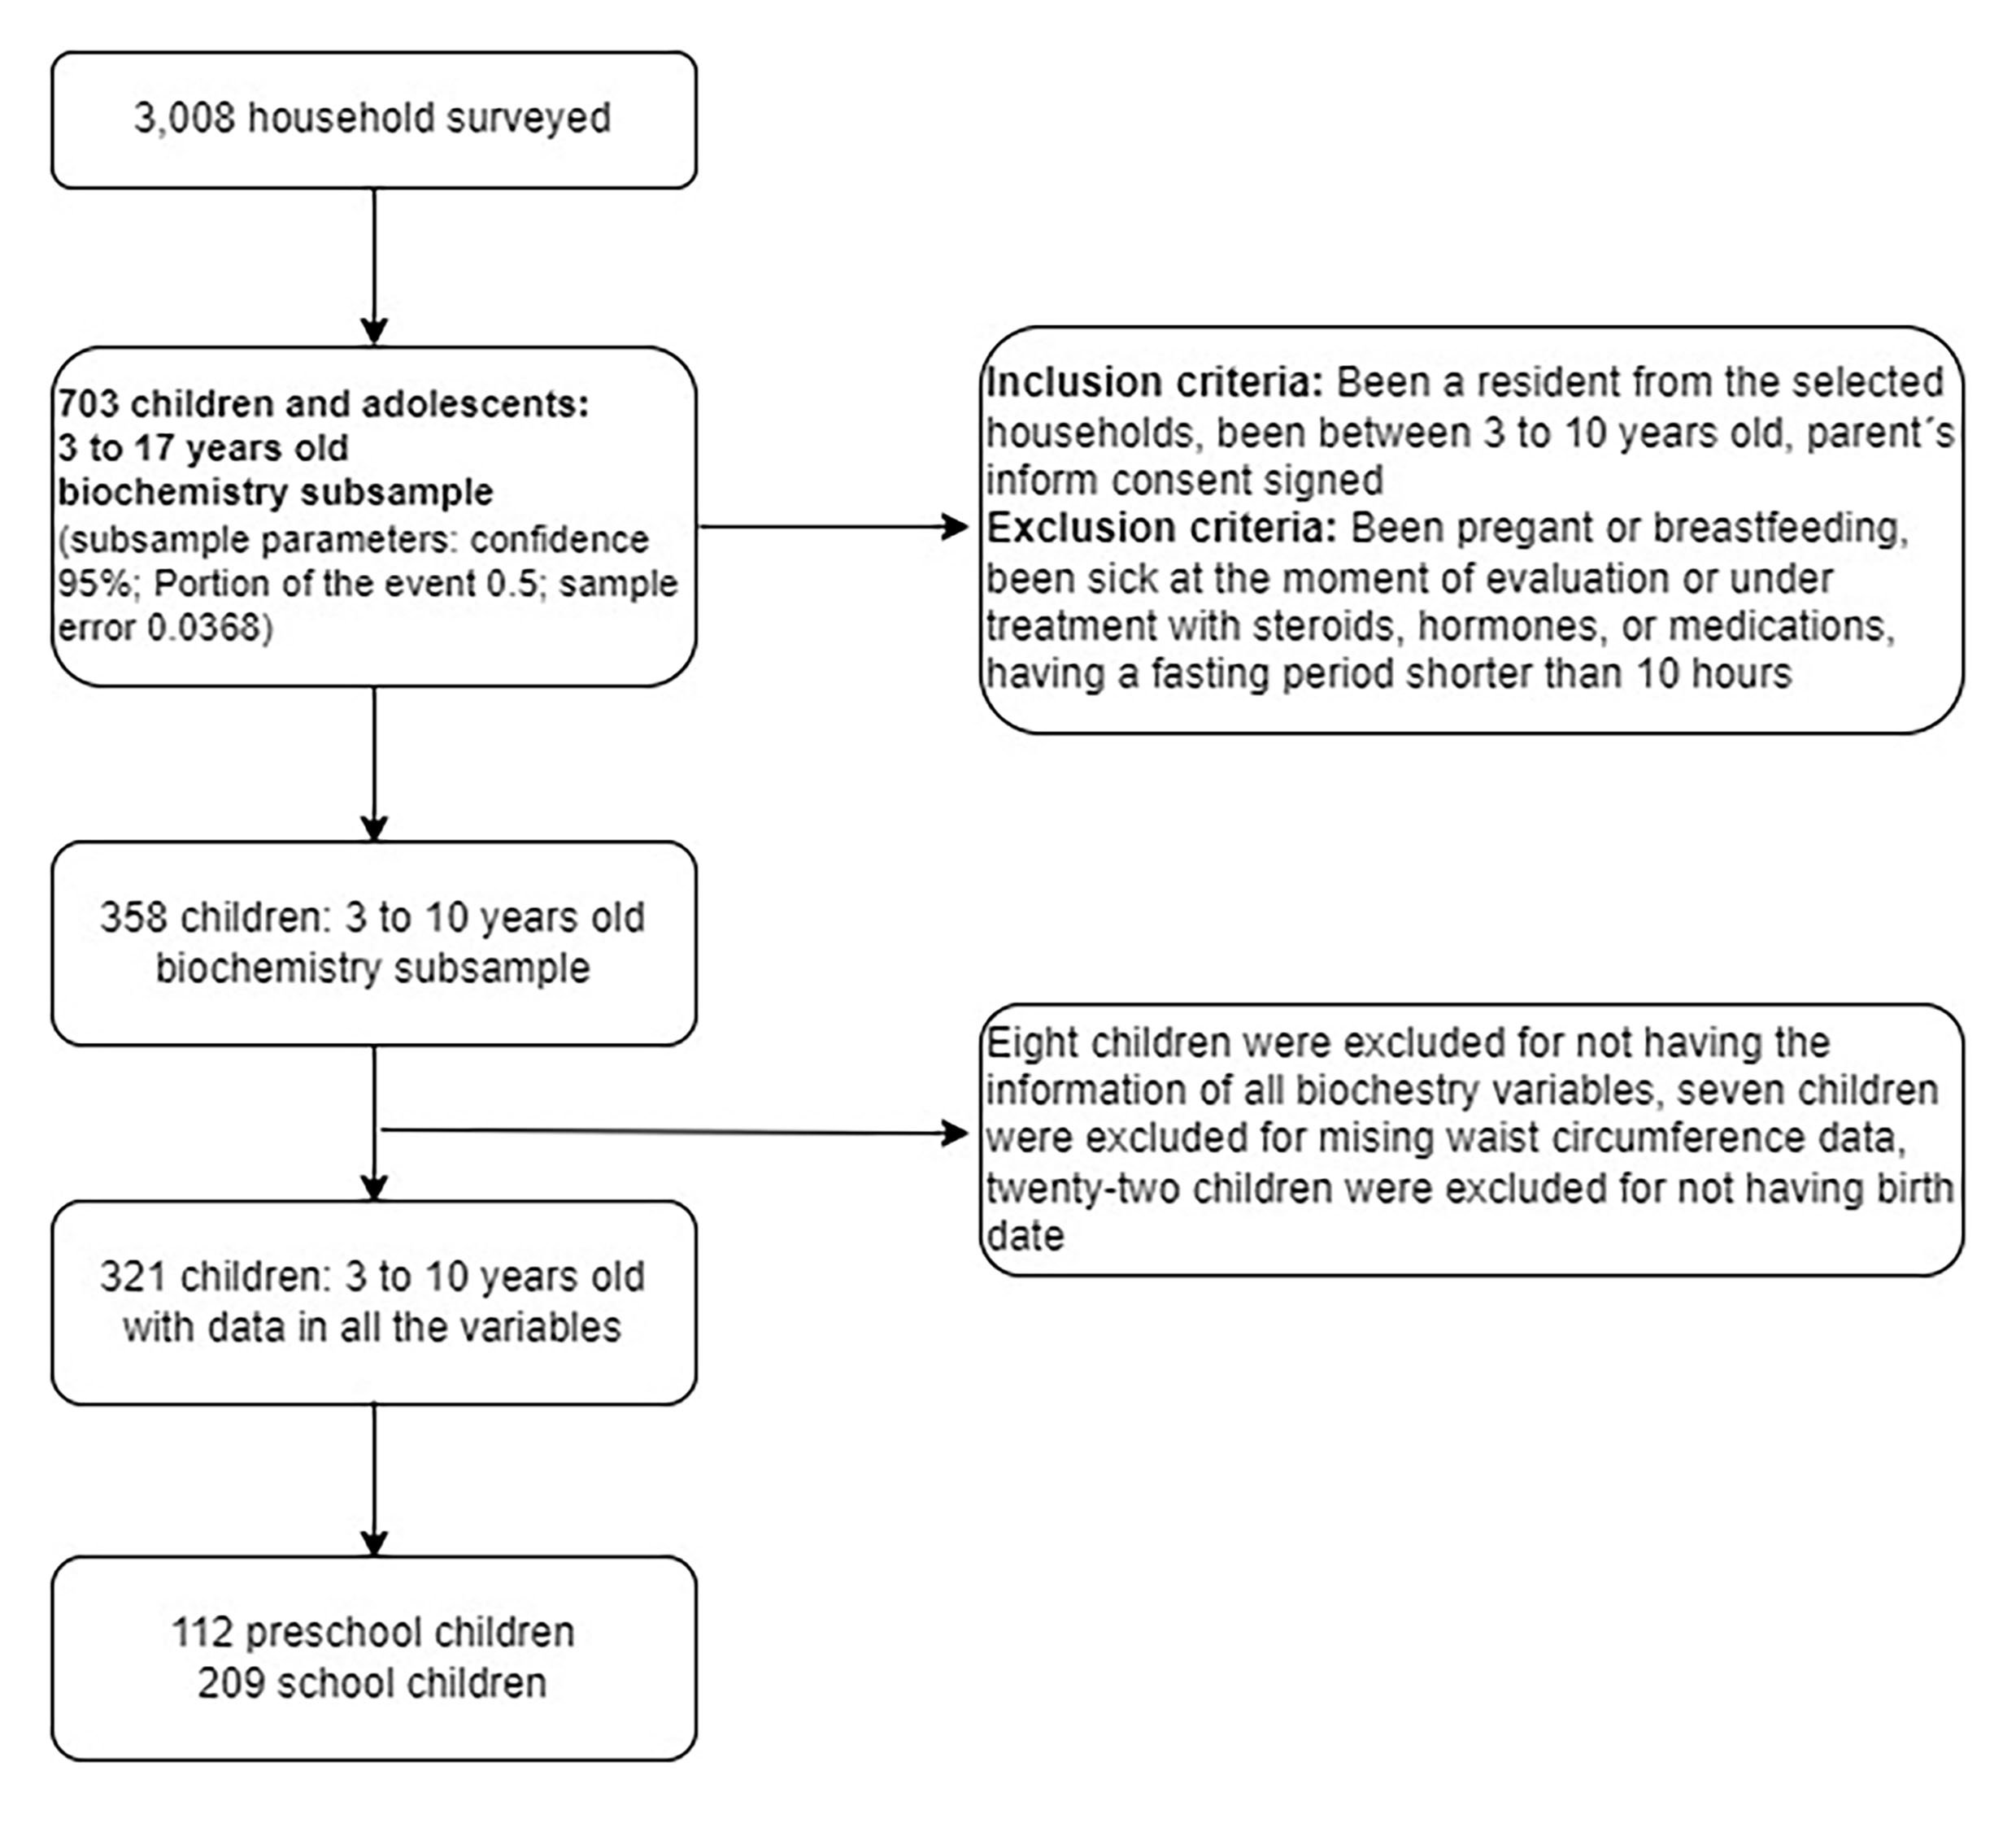
This cross-sectional study included 321 kids divided into preschool (3 to 5 years) and school children (6 to 10 years) living in Medellin-Colombia. They participated in the Medellin's Food and Nutritional Survey 2015 (from Spanish, Perfil Alimentario y Nutricional de Medellín) 18. A total of 3,008 homes from the city's six socio-economic strata were surveyed. The study included young from 3 to 10 years old, that were not in pregnancy or breastfeeding, whose guardians or parents signed the informed consent. Children who were sick at the moment of evaluation or under treatment with steroids, hormones, or medications were excluded from the study. Also children who were fasting for less than 10 hours before blood draw were not included in the analysis. Finally, 321 children (between 3 and 10 years) were included in the analysis (Figure 1). The study was performed according to the Helsinki Declaration and was approved by the Bioethical Review Board of the Faculty of Dentistry from the University of Antioquia (Act of approval No. 01, February 27, 2015).
Anthropometric measurements and indices
Anthropometric procedures where described elsewhere 19. Briefly, body measurements were performed by experienced and trained health personal following the techniques described by Lohman et al20. Body weight was measured to the nearest 0.1 kilograms using a digital scale (Seca 813, California, USA). Height was measured to the nearest 0.1 centimeters using a wall-mounted mechanical measuring tape (Seca 206, California, USA). Waist circumference was measured to the nearest 0.1 cm using a flexible tape (Seca 206, California, USA) at a midway point between the lowest rib margin and the superior border of the iliac crest. Anthropometric measurements were done at least by duplicate; a third measurement was done in cases where the difference between the first and the second reading was higher than 0.1 kg in body weight, 0.5 cm in height, and 1% in waist circumference. BMI was calculated by dividing body weight in kilograms by height in square meters. Overweight and obesity were defined by using the World Health Organization (WHO) reference values. In five year-old and older children were applied the 2007´s WHO reference values 21, and in younger kids the 2006´s WHO references values were used 22. WHtR was calculated by dividing waist circumference in centimeters by height in centimeters. A ≥0.50 WHtR cut-off value was used to classify children with abdominal obesity 23.
Cardiovascular risk factors
Children's parents were asked to bring their kids after a 10 to 12-hour overnight fast. Blood was drawn from the antecubital vein in dry tubes. Blood was centrifuged at 3000 x g for 10 minutes to obtain serum. Serum glucose, insulin, total cholesterol, triglycerides, low-density lipoprotein cholesterol (LDL-C) and high-density lipoprotein cholesterol (HDL-C) were measured by standardized methods using an automatic analyzer (Roche, Cobas c501, Mannheim, Germany). HOMA-IR was calculated as serum glucose (mmol/L) x serum insulin (mU/L)/22.5 24. Children were classified as having high total cholesterol (≥5.18 mmol/l), high triglycerides (≥1.13 mmol/l and ≥1.47 mmol/l for children <10 and ≥10 years old, respectively), high LDL-C (≥3.37 mmol/l), high non-HDL-C (≥3.76 mmol/l) and low HDL-C (≤1.03 mmol/l) according to the Expert Panel on Integrated Guidelines for Cardiovascular Health and Risk Reduction in Children and Adolescents 25. High insulin values were classified using the 90th percentile reported by the Identification and prevention of dietary- and lifestyle-induced health effects in children and infants (IDEFICS)-study 26. HOMA-IR value ≥3.1 was considered high, following the criteria previously applied to Medellin´s population 27,28. Multiple non-waist circumference (non-WC) metabolic syndrome factors (MetS-Factors) included high HOMA-IR, high triglycerides and low HDL-C.
Statistical analysis
The normal distribution of data was tested with the Kolmogorov-Smirnov test. Data are presented as means ± standard deviations or medians and interquartile range according to data distribution. Differences between groups were compared using one-way ANOVA with general linear models using sex and age as covariates in the normally distributed data, and the Mann-Whitney test in non-normally distributed data. The chi-square test was used to compare the proportions of children according to nutritional status and school age. Adjusted r by age and sex was calculated to determine the association between anthropometric indices and CRFs. Odds ratios (OR) were calculated using logistic regression analysis to measure the association between being at risk according to nutritional status (normal body weight / overweight+obese) and the presence of CRFs. Children with normal body weight were the reference group (OR= 1.0). In children with CRFs (i.e. hypercholesterolemia, hypertriglyceridemia, low HDL, etc.) the agreement of those having excess of body weight by the BMI (overweight+obese) and abdominal obesity by the WHtR, was tested using kappa coefficients, and interpreted according to Landis and Koch criteria 29. A p value <0.05 was considered statistically significant. The statistical analysis was developed in SPSS version 24.
Results
A total of 321 children, 112 preschool (4.5 ±0.9 years old) and 209 school kids (8.5 ±1.5 years old) were included in this study (Figure 1). The proportion of boys and girls was similar (p= 0.746) in preschool (53.6% vs 46.4%) and school kids (51.7% vs 48.3%). Compared to preschool children, school kids presented a higher proportion of overweight (18.2% vs 6.3%; p= 0.002) and overweight+obesity (24.9% vs. 9.8%; p= 0.001). Contrarily, preschool kids showed higher WHtR (0.51 ±0.04 vs 0.46 ±0.04; p= 0.001) and a higher proportion of abdominal obesity (59.5% vs. 18.7%; p= 0.001) (Table 1). WHtR classified with abdominal obesity more than half of the preschool kids that had normal body weight according to the BMI (59.6%). The agreement between the BMI classification of children with overweight+obesity and the WHtR classification of kids with abdominal obesity was poor in preschool (kappa: 0.098; p= 0.042). Contrarily, in the school group, the agreement between BMI and WHtR to classify the children nutritional status was substantial (kappa: 0.699; p <0.001).
Compared to preschool, school children showed higher triglycerides (1.03 mmol/l [0.75-1.42] vs 0.98 mmol/l [0.80-1.23]; p= 0.006) and HDL-Cholesterol (1.26 ±0.28 mmol/l vs. 1.20 ±0.27 mmol/l; p= 0.000) (Table 1).
Table 1 Participant characteristics by group
| Preschool Children (n = 112) | School Children (n = 209) | |
|---|---|---|
| Male (n, %) | 60 (53.6) | 108 (51.7) |
| Age (years) | 4.5 ± 0.9 | 8.5 ± 1.5 |
| Body height (cm) | 102.9 (96.4-108.4) | 127.1 (120.7-135.8) |
| Body weight (kg) | 16.0 (14.5-18.1) | 26.3 (22.6-31.1) |
| Waist circumference (cm) | 51.6 (49.6-53.5) | 57.8 (54.2-62.6) |
| Waist-to-height Ratio | 0.51 ± 0.04 | 0.46 ± 0.04* |
| Body mass index (z-score) | 0.1 (-0.5-0.7) | 0.1 (-0.5-0.9) |
| Overweight by BMI (n, %) | 7 (6.3) | 38 (18.2)‡ |
| Obese by BMI (n, %) | 4 (3.6) | 14 (6.7) |
| Overweight+Obese by BMI (n, %) | 11 (9.8) | 52 (24.9)‡ |
| Abdominal obesity WHtR ≥0.50 (n, %) | 66 (59.5) | 39 (18.7)‡ |
| Glucose (mmol·L) | 4.33 (4.00-4.55) | 4.44 (4.16-4.72) |
| Insulin (pmol·L) | 31.25 (19.1-47.58) | 51.74 (29.86-79.52) |
| HOMA-IR | 0.89 (0.53-1.35) | 1.5 (0.82-2.29) |
| Total Cholesterol (mmol·L) | 4.14 (3.69-4.71) | 4.14 (3.73-4.71) |
| Triglycerides (mmol·L) | 0.98 (0.80-1.23) | 1.03 (0.75-1.42)† |
| HDL-C (mmol·L) | 1.20 ± 0.27 | 1.26 ± 0.28* |
| LDL-C (mmol·L) | 2.41 (2.15-3.04) | 2.40 (1.98-2.78) |
| Non-HDL-C (mmol·L) | 2.83 (2.59-3.61) | 2.86 (2.46-3.33) |
Data presented as mean ± standard deviation or medians and interquartile range in parentheses according to data distribution. Nutritional status presented as numbers and percentages. *Differences between groups obtained with general linear models adjusted by sex. ‡Differences between groups obtained with Chi-square test. †Differences between groups obtained with the Mann-Whitney test; BMI: Body mass index; WHtR: Waist-to-height Ratio; HOMA-IR: homeostasis model assessment of insulin resistance; HDL-C: high-density lipoprotein cholesterol; LDL-C: low-density lipoprotein cholesterol.
The associations between anthropometric indices and CRFs are shown in Table 2. In preschool children, BMI and WHtR showed similar associations with insulin (r= 0.335, p= 0.000 and r= 0.299, p= 0.002; respectively) and HOMA-IR (r= 0.333, p= 0.000 and r= 0.303, p= 0.001; respectively). In school children, BMI and WHtR also showed similar associations with insulin and HOMA-IR, as well as with triglycerides (r= 0.277, p= 0.000 and r= 0.271, p= 0.000; respectively). Only the WHtR presented a negative association with HDL-Cholesterol (r= -0.163, p= 0.020) in school children (Table 2).
Table 2 Associations between antropometric indices and cardiometabolic risk factors*
| Preschool children | School children | |||||||
|---|---|---|---|---|---|---|---|---|
| Cardiometabolic | Body mass index | Waist-to-height Ratio | Body mass index | Waist-to-height Ratio | ||||
| Risk Factor | Adjusted r | p-value | Adjusted r | p-value | Adjusted r | p-value | Adjusted r | p-value |
| Glucose | 0.015 | 0.880 | 0.060 | 0.542 | 0.093 | 0.183 | 0.058 | 0.405 |
| Insulin | 0.335 | 0.000 | 0.299 | 0.002 | 0.399 | 0.000 | 0.320 | 0.000 |
| HOMA-IR | 0.333 | 0.000 | 0.303 | 0.001 | 0.393 | 0.000 | 0.316 | 0.000 |
| Total Cholesterol | -0.030 | 0.759 | -0.091 | 0.353 | -0.043 | 0.541 | -0.003 | 0.965 |
| Triglycerides | -0.052 | 0.595 | 0.074 | 0.446 | 0.277 | 0.000 | 0.271 | 0.000 |
| HDL-C | -0.022 | 0.823 | -0.141 | 0.146 | -0.123 | 0.078 | -0.163 | 0.020 |
| LDL-C | -0.011 | 0.913 | -0.064 | 0.513 | -0.075 | 2.287 | -0.018 | 0.800 |
| Non HDL-C | -0.023 | 0.811 | -0.046 | 0.637 | 0.001 | 0.994 | 0.056 | 0.422 |
*Adjusted by sex and age. HOMA-IR: homeostasis model assessment of insulin resistance; HDL-C: high-density lipoprotein cholesterol. LDL-C: low-density lipoprotein cholesterol.
The OR for having CRFs in overweight+obesity and abdominal obese children are shown in Table 3. In the preschool children, those with overweight+obesity did not have significant higher odds for CRFs. When these kids were classified according to WHtR, those with abdominal obesity were 2.94 times (95% CI= 1.2-7.01) and 3.85 times (95% CI= 1.2-12.2) more likely to have low HDL-Cholesterol and multiple non-WC MetS-Factors, respectively. In the school group, children with overweight+obesity or abdominal obesity were likelier to have high insulin levels, HOMA-IR, triglycerides and multiple non-WC MetS-Factors (Table 3). Only the school kids with abdominal obesity showed higher ORs for low HDL-Cholesterol 2.73 (95% CI= 1.3-5.9).
Table 3 Odds ratio (OR) for cardiometabolic risk factors in overweight/obese and abdominal obese preschool and school children*
| Overweight+Obese | Abdominal Obese | |||||
|---|---|---|---|---|---|---|
| OR | 95% CI | p-value | OR | 95% CI | p-value | |
| Preschool children | ||||||
| High Insulin | 3.02 | (0.85-10.74) | 0.093 | 1.07 | (0.47-2.46) | 0.873 |
| High HOMA | 2.57 | (0.72-9.22) | 0.158 | 1.34 | (0.55-3.30) | 0.517 |
| High Total Cholesterol | 0.86 | (0.80-0.94) | 0.352 | 0.46 | (0.15-1.44) | 0.176 |
| High Triglycerides | 1.18 | (0.32-4.33) | 1.000 | 1.26 | (0.57-2.83) | 0.567 |
| Low HDL | 0.71 | (0.18-2.84) | 0.746 | 2.94 | (1.22-7.01) | 0.014 |
| High LDL | 1.45 | (0.28-7.53) | 0.647 | 0.75 | (0.26-2.10) | 0.575 |
| High Non-HDL | 1.02 | (0.20-5.15) | 1.000 | 0.70 | (0.27-1.82) | 0.463 |
| Non-WC MetS factors | 2.01 | (0.54-7.54) | 0.283 | 3.85 | (1.21-12.24) | 0.039 |
| School children | ||||||
| High Insulin | 4.52 | (2.29-8.91) | 0.000 | 3.89 | (1.86-8.11) | 0.000 |
| High HOMA | 3.76 | (1.92-7.37) | 0.000 | 4.49 | (2.15-9.38) | 0.000 |
| High Total Cholesterol | 0.89 | (0.31-2.58) | 0.825 | 0.97 | (0.30-3.03) | 0.951 |
| High Triglycerides | 3.86 | (1.98-7.52) | 0.000 | 2.63 | (1.30-5.40) | 0.006 |
| Low HDL | 1.96 | (0.93-4.12) | 0.073 | 2.73 | (1.30-5.90) | 0.009 |
| High LDL | 0.51 | (0.14-1.84) | 0.408 | 1.10 | (0.35-3.50) | 0.872 |
| High Non-HDL | 0.83 | (0.31-2.21) | 0.710 | 0.99 | (0.35-2.78) | 0.984 |
| Non-WC MetS factors | 5.01 | (2.51-10.2) | 0.000 | 6.45 | (1.15-36.35) | 0.035 |
*Children with normal body weight were used as the reference group (OR = 1.0); HOMA-IR: homeostasis model assessment of insulin resistance; HDL-C: high-density lipoprotein cholesterol; LDL-C: low-density lipoprotein cholesterol; WC: waist circumference; MetS: metabolic syndrome factors.
BMI and WHtR agreement to identify children with CRFs is presented in Table 4. There was not a significant agreement between BMI and WHtR to detect preschool children with CRFs (kappa ranged between -0.025 and 0.200; p >0.05). Contrarily, in the school group, the agreement between BMI and WHtR was almost perfect for high total cholesterol and high LDL-C (kappa values ≥0.824; p <0.001) and the agreement was substantial for high values of insulin, HOMA-IR, triglycerides, non-HDL-C, low HDL-C values and the presence of non-WC MetS-Factors (kappa values ≥0.616; p <0.001).
Table 4 Agreement between the body mass index and the waist-to-height Ratio to identify preschool and school children with cardiovascular risk factors
| Cardiometabolic Risk Factor | Preschool children | School children |
|---|---|---|
| Kappa (p-value) | Kappa (p-value) | |
| High Insulin | 0.135 (0.242) | 0.648 (<0.001) |
| High HOMA-IR | 0.082 (0.484) | 0.702 (<0.001) |
| High Total Cholesterol | * | 0.857 (<0.001) |
| High Triglycerides | 0.023 (0.769) | 0.654 (<0.001) |
| Low HDL-C | -0.025 (0.629) | 0.616 (<0.001) |
| High LDL-C | 0.200 (0.182) | 0.824 (<0.001) |
| High Non HDL-C | 0.158 (0.202) | 0.651 (0.001) |
| Non-WC MetSyn factors | -0.005 (0.959) | 0.675 (<0.001) |
*There were not preschool children classified with high total cholesterol levels. HOMA-IR: homeostasis model assessment of insulin resistance; HDL-C: high-density lipoprotein cholesterol; LDL-C: low-density lipoprotein cholesterol; WC: waist circumference; MetS: metabolic syndrome factors.
Discussion
The main objective of the study was to analyze the agreement between BMI and WHtR to identify preschool and school children with CRFs. Similar to previous studies 30-32, BMI and WHtR showed parallel associations with CRFs. However, their agreement to identify children with CRFs was contrasting; been substantial in school children but almost inexistent in preschool kids. A possible explanation for the conflicting results could be the WHtR application of a single cut-off for all children independent of their age and sex.
The use of a universal cut-off is one of the advantages of the WHtR since it avoids using specific age and sex borderlines. Nonetheless, in this study, the WHtR ≥0.5 seems to have overestimated abdominal obesity in preschool children, which agrees with previous research 33. Preschool children showed a WHtR average above the threshold value (0.51 ±0.04) and more than half of the kids were classified with abdominal obesity (59.5%). This result exceeded the proportion of preschool kids with overweight+obesity (9.8%). In addition, more than half of the preschool kids with normal body weight classification by the BMI (59.6%) were classified with abdominal obesity by the WHtR. Thus, the WHtR ≥0.5 appears to have overestimated abdominal obesity in preschool children and this probably contributed to the lack of agreement between BMI and WHtR to classify the nutritional status of the kids and to identify those with CRFs. These results are in line with a recent review by Yoo EG 9, and suggest that WHtR ≥0.5 application is unsuitable in preschool children.
The WHtR appears to be unstable during early childhood and the use of age specific cut-offs could be necessary. Studies in young kids report that WHtR decreases during the first years of life, pointing out a higher growth velocity related to age in height than in waist circumference 34-36. Roswall et al33, in a representative sample of 4502 Swedish children, found that WHtR declined continuously from birth (0.69) to five years (0.48). The researchers developed reference graphs using six-month periods and suggested the charts to be used in Swedish children 33. Similar studies have been done in other populations 36,39,40 raising controversy about ethnic differences in the optimal WHtR threshold for CRFs 16,17,39. In this study, the use of specific cut-offs may have improved the WHtR performance since this indicator correlated with some CRFs, and it was able to identify ORs for low HDL-C and non-WC MetS-Factors not detected by BMI. However, the option of using specific cut-offs was not explored due to the lack of adequate references for Colombian preschool children. Further studies with larger sample size are needed to find optimal WHtR cut-offs in this population.
The WHtR performance in school children was similar to the BMI, which is in agreement with previous research 31,32,38. WHtR associations with CRFs were in line with those of the BMI with insulin, HOMA-IR and triglycerides. Likewise, WHtR was slightly superior to the BMI at identifying increased ORs for low HDL-C in school and preschool children. This could be due to the fact that WHtR has a greater association with abdominal obesity than BMI 7,8. WHtR and BMI showed substantial to perfect agreement to identify school children with high values of total cholesterol, LDL-C, triglycerides, non-HDL-C, insulin, HOMA-IR, low values of HDL-C and the presence of non-WC MetS-Factors (high HOMA-IR, high triglycerides and low HDL-C). These results are in line with the Bogalusa Heart Study, where Freedman et al.31, in a sample of 2,498 children aged 5-17 years, found not differences between BMI and WHtR abilities to identify kids with CRFs. Thus, the results suggest that WHtR is a valid option for screening CRFs in school children and its results are probably similar to those obtained by BMI.
There is not a straightforward explanation for the contrasting performance of the WHtR ≥0.50 in preschool versus school children. One reason could be that the differences in growth velocities in height and waist circumference present during early childhood, decrease when children get older, making feasible the use of a universal cut-off point (WHtR ≥0.50) for school kids. As a result, a fixed WHtR cut-off appears irrelevant in preschool but valid in school children. Nonetheless, there is some controversy about the optimal WHtR cut-off for screening CRFs in school children. Some studies support the use of 0.50 32,38,40, whereas others propose different thresholds 16,17,41. More research is needed to: 1) study how growth affects the relationship between WHtR and CRFs, 2) analyze the ability of the WHtR to predict future health outcomes, and 3) elucidate possible ethnic differences in optimal WHtR cut-offs for CRFs. These tasks will require collecting data from large reference population from Latin American countries, in order to contrast with North Americans and Europeans, in whom most of the studies have been done.
This study had some strengths and limitations. Among the strengths: a) the inclusion of two independent age groups, particularly the analysis of preschool children in which the information is more limited, b) the analysis of agreement between WHtR and BMI to identity CRFs in children, which provides information on their comparability, and c) the analysis of having multiple non-WC MetS-Factors given that the presence of one factor might be due to day-to-day changes (e.g., triglycerides). Among the limitations: a) this is a cross-sectional study and it does not allow to establish cause-effect relationships, b) the lack of a robust laboratory method as DXA to assess obesity in children; however, this is complicated to be measured in field studies in low-income countries, and c) the study sample is not representative of any particular group of the population, although the included children belonged to 3,008 homes selected randomly from a city close to 4.5 million of people.
In summary, in preschool children WHtR ≥0.5 disagree with the BMI results, but in school kids WHtR ≥0.5 has good agreement with the BMI to classify the children's nutritional status and to identify those with CRFs.

