text in
  English (pdf)
 Article in xml format
 Article references
 Send this article by e-mail
 Cited by SciELO
  Cited by Google
  Similars in
SciELO
Similars in
SciELO  Similars in Google
 Permalink
Remark
| 1) Why was this study conducted? |
| This study was conducted to evaluate the clinimetric properties of the Perme Intensive Care Unit Mobility Score.. |
| 2) What were the most relevant results of the study? |
| This study established the minimum clinically important difference (MCID), responsiveness, the ceiling and floor effects, the internal consistency, and predictive validity of the Perme Score.. |
| 3) What do these results contribute? |
| The results of this study will allow a better understand and interpretation of the results of the Perme Score as an outcome assessment instrument in clinical practice and research purposes. |
Introduction
A systematic review of physical function endpoints in critical care patients has found significant variability in measurement instruments utilized for clinical and research purposes 1. The evaluation of physical function is essential to deliver an effective and assertive therapeutic plan, able to predict individuals at high risk of developing functional impairments after critical care episodes and hospitalization 2,3. The Perme Intensive Care Unit Mobility Score (Perme Score) was designed to assess patients' mobility status when admitted to the intensive care unit (ICU) 1,4. The Perme Score consists of seven domains 4. Starting with the assessment of patients' alertness observed upon arrival and initial contact with the rater and ending with the total distance walked over 2 minutes, the total score ranges from 0 to 32 points, with higher scores indicating higher mobility status 4. Since the initial publication of the proposal, several studies have been published using the Perme Score as an assessment tool to objectively measure the mobility level of ICU patients 5-11.
However, measurement instruments must be sensitive to detect clinical changes and have robust measurement properties tested for validity and reliability 12. The Consensus-based Standards for selecting health Measurement Instruments (COSMIN) 13 initiative developed a taxonomy and three quality domains (e.g., reliability, validity, and responsiveness) 13, the greater the number of clinimetric properties tested, the more robust the measurement instrument tends to be. The interrater reliability of the Perme Score was previously tested, showing an excellent agreement between observers 5. The minimum clinically important difference can be defined as the most minor difference in score for an outcome of interest that would lead the patient or clinician to consider a change (e.g., better or worse) in the patient's status 14. The present study aims to establish the minimum clinically important difference (MCID) and the responsiveness of the Perme Score in generalizable patients admitted to the ICU. Secondly, we aimed to analyze the measurement properties: (1) floor and ceiling effect of the Perme Score to ICU admission and ICU discharge; (2) internal consistency; (3) predictive validity for in-hospital and hospital stay after ICU discharge.
Materials and Methods
Study design and ethics approval
This study is reported following the Strengthening the Reporting of Observational Studies in Epidemiology (STROBE) statement 15, and the Consensus-based Standards for selecting Health Measurement Instruments (COSMIN) methodology 13. A multicenter retrospective study including a convenience sample of patients from four private ICUs. All sites classified their ICUs as 'mixed general ICUs'. The local Institutional Review Board (IRB) of each hospital approved the study (Table 1S on the Supplementary Material for local IRB approval). Local institutional review boards approved this study, as follows: Hospital Israelita Albert Einstein Ethics Committee, Hospital Municipal Vila Santa Catarina Ethics Committee, Hospital Moinhos de Vento Ethics Committee and Hospital Nossa Senhora da Conceição Ethics Committee approved this study. The informed consent was waived for all sites for this retrospective study.
Participants
Records were eligible for inclusion if they had been admitted to the ICU between January 01, 2019, to June 30, 2019. The patients included in the study should be required mechanical ventilation support for a period of more than 24 hours. The exclusion criteria adopted were: (1) patients under 18 years old; (2) diagnosis of neurodegenerative diseases; (3) patients with cognitive impairment prior to hospital admission; (4) patients on comfort measures (e.g., palliative care); and (5) primary diagnosis of myopathic or neurological processes associated with muscle weakness (e.g., Guillain-Barré syndrome). All patients were followed up until discharge from the intensive care unit.
Data collection and study variables
All data were extracted by an independent research assistant who did not participate in this study and were fully anonymized before being made available to researchers. Collected variables included demographics, comorbidities, Simplified Acute Physiology Score (SAPS III) at ICU admission, with higher scores indicating more severe illness and higher risk of death 16, Sequential Organ Failure Assessment score (SOFA) at ICU admission, with higher aggregate scores indicating more severe organ dysfunction 17, Charlson Comorbidity Index (CCI), with a score of zero indicating that no comorbidities were found 18. The higher the score, the more likely the predicted outcome will result in mortality or higher resource use 18, Modified Frailty Index (MFI) - categorized frailty using MFI values into non-frail (MFI= 0), pre-frail (MFI= 1-2) or frail (MFI ≥3) 19, resource use and organ support duration of MV, ICU length of stay, and ICU and in-hospital mortality.
Statistical analysis
Continuous variables were reported as median [interquartile range (IQR)], since none of the variables presented symmetry or normality, assessed by the Shapiro-Wilk test. Categorical variables were presented as absolute and relative frequencies. Analyses were performed using 'R software', version 4.0.3 (R Foundation) 20, and 0.05 was set as an indicator of statistical significance throughout.
Minimum clinically important difference
The MCID was established by constructing the Receiver Operating Characteristic (ROC) curve with Perme Score at ICU admission, and the subsequent calculation of the area under the curve (AUC) determined the best cut-off point to discriminate between patient groups classified as 'little better' and 'much better' 21. Patients classified as 'worsening' were excluded from the analysis. The MCID is the value that results in a greater AUC while maximizing sensitivity and specificity. Youden's criterion was utilized to define this point.
Responsiveness
Responsiveness was assessed by considering three mobility milestones, as follows: (1) sitting activity; (2) standing activity, and (3) walking activity, by using the items of the Perme Score at ICU discharge, which were considered essential for defining clinical improvement (e.g.: item '9' supine to sit; item '11' sit to stand; and item '14' gait, respectively). We assessed change over time 22 based on the capacity of the Perme Score to predict these questions as an outcome by calculating the differences between 'ICU admission' and 'ICU discharge' values. The ROC curves were constructed and the AUC were calculated, with 95% CI, testing for the null hypothesis of an AUC equal to 0.5. The calibration of the ROC curves were assessed by the Hosmer and Lemeshow goodness-of-fit test (H-L test), with results presented by test statistics (Ji 2), degrees of freedom (Df) and p-value.
Floor and ceiling effects
The floor and ceiling effects were calculated by assessing the proportion of patients who obtained the lowest and highest Perme Score values. Floor and ceiling effects of less than 15% were considered acceptable 23,24.
Internal consistency
Internal consistency was assessed using Cronbach's alpha coefficient (α-Cronbach) 25, with a 95% CI, which was calculated between items with similar responses (e.g., Perme Score items '2 to 6', '7 and 8', and '9 to 15') 26. Internal consistency was considered adequate if α was between 0.70 and 0.95 27.
Predictive validity
The predictive validity of the Perme Score at ICU admission and the in-hospital mortality were performed using a generalized estimating equation model with binomial distribution, considering the expected correlation between data from the same center 28. The adequacy of the score in the prediction was evaluated by ROC curve and by calculating the AUC and the calibration of the ROC curve, assessed by H-L test 29. Model results were presented by (OR, 95% CI) and p-value. The relationship between the Perme Score at ICU admission and the ICU stay or hospital stay after ICU discharge was investigated using a mixed linear model applied to the length of stay log-transformed and considering the expected correlation between data from the same center. The results are presented by differences or mean ratios, 95% CI, and p-values. For the length of hospital stay after ICU, the constant 0.5 was added to all observations before the log transformation to deal with cases equal to zero.
Results
During the observation period, 1,209 patients were initially screened from a mix of medical and surgical ICUs for inclusion in this study. Of these, 1,200 (99.3%) patients met the inclusion criteria and were included in subsequent analyses (Figure 1).
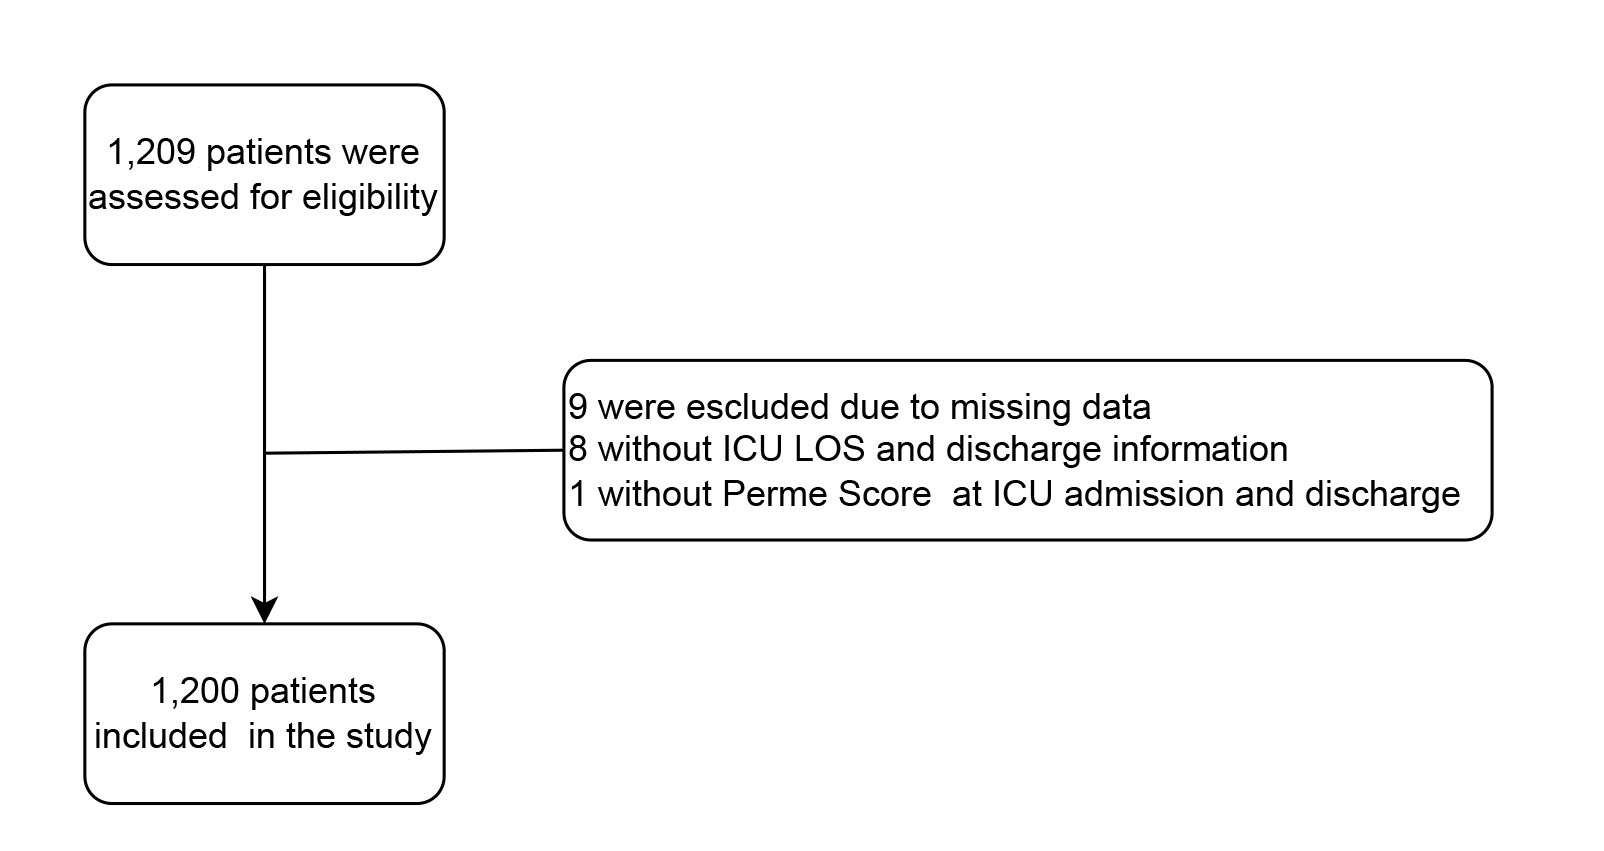
Figure 1 Consolidate flowchart of included patients Definition of abbreviations: ICU = intensive care unit; LOS = length of stay.
Nine patients (0.7%) were excluded due to missing core data. Baseline characteristics with demographic details of pooled patients' data are shown in Table 1 (Table 2S on the Supplementary Material for additional information about baseline characteristics and clinical outcomes of the included patients). The median [IQR] age of patients was 67 (55-79) years, 57.1% were male, and the total Perme Score at ICU admission mean 9.37 (95% CI: 8.84-9.90), and 17.20 (95% CI: 17.25-18.31) at ICU discharge of a total n = 1,200 patients. Excluding deaths and transfers for other hospitals the mean of 9.75 (95% CI: 9.21-10.29), and 19.05 (95% CI: 18.51-19.59) at ICU discharge of a total n= 1,089 patients (Table 3S on the Supplementary Material for additional information about patients' organ support during ICU stay).
Table 1 Baseline characteristics and clinical outcomes of the included patients
| Overall | HIAE1 | HMVSC2 | HMV3 | HNSC4 | |
|---|---|---|---|---|---|
| no. (%) | 1,200 (100) | 455 (37.9) | 268 (22.3) | 305 (25.4) | 172 (14.3) |
| Age, years, median (IQR) | 67 (55-79) | 75 (62-86) | 60 (48-68) | 70 (60-81) | 61 (49-70) |
| Male gender - no (%) | 685 (57.1) | 259 (56.9) | 159 (59.3) | 171 (56.1) | 96 (55.8) |
| Perme Score§, total points, median (IQR) | |||||
| ICU admission | 8 (2-13) | 8 (4-11) | 9 (8-19) | 7 (2-18) | 0 (0-8) |
| ICU discharge | 21 (9-27) | 18 (8-26) | 22 (11.5-26) | 24 (20-28) | 8 (0-18) |
Data are median and interquartile range [quartile 25% - quartile 75%] or n (%). Percentages may not total 100 because of rounding.
Definition of abbreviations: 1HIAE = Hospital Israelita Albert Einstein, São Paulo, Brazil; 2 HMVSC = Hospital Municipal Vila Santa Catarina, São Paulo, Brazil; 3 HMV = Hospital Moinhos de Vento, Porto Alegre, Brazil; 4 HNSC = Hospital Nossa Senhora da Conceição, Porto Alegre, Brazil.
§ Perme ICU mobility score range from 0 to 32, with higher scores indicating better mobility level.
||The Perme Mobility Index (PMI) is calculated by the difference between the total Perme Score at ICU discharge and the total Perme Score at ICU admission, divided by the ICU length of stay (ICU LOS) [PMI = ΔPerme Score (ICU discharge - ICU admission) / ICU LOS]. The result is a dimensionless number and it can be either positive or negative. Positive values are associated with patients that improve the mobility status during ICU stay, whereas negative values are associated with patients that decrease mobility status during ICU stay.
Minimum clinically important difference
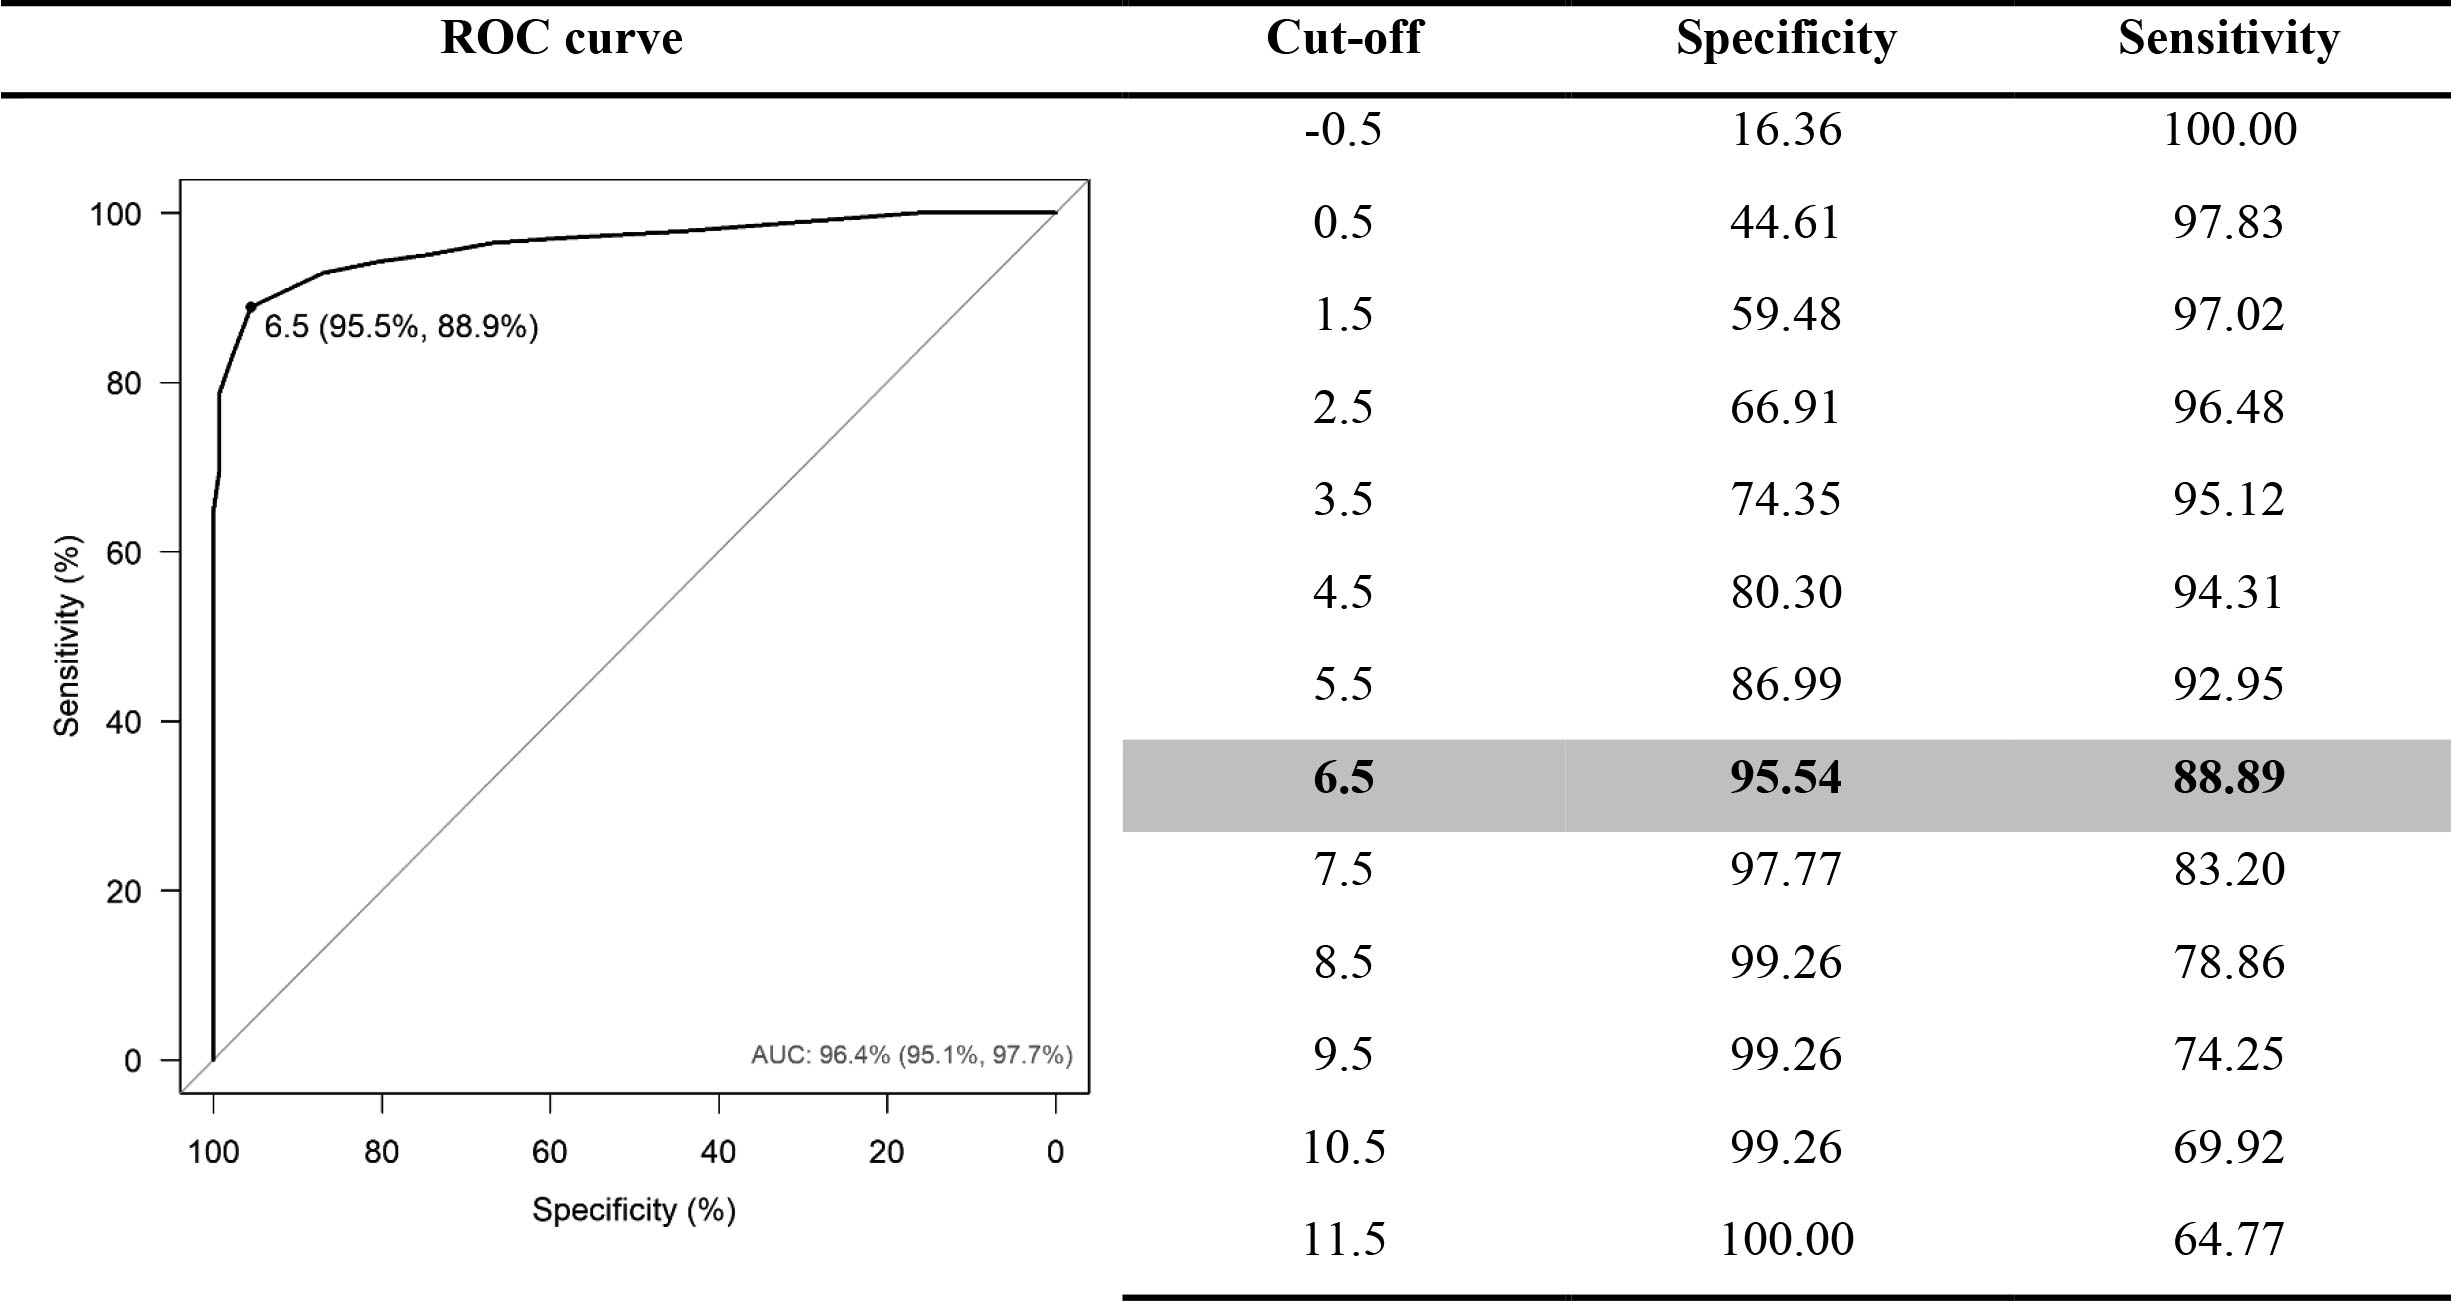
The MCID was determined by constructing a ROC curve that showed an AUC= 0.96; 95% CI: 0.95-0.98, and the optimal cut-off value of 6.5, by Youden criteria, with a specificity of 95.5% and a sensitivity of 88.9%, OR= 1.78; 95% CI: 1.62-1.97 (p <0.001) and H-L test χ2= 15.6; Df (7), p= 0.029] (Figure 1S on the Supplementary Material for additional information). The summary of clinical mobility improvement and mobility milestone occurrence are presented in Tables 2 and 3, respectively. When analyzing clinical mobility improvement, 723 patients were included in this analysis, corresponding to 60.2% of the sample. Mobility milestone occurrence was measured at ICU discharge, all patients were included in the study analysis.
Table 2 Clinical mobility improvement
| Overall | HIAE1 | HMVSC2 | |
|---|---|---|---|
| 1,200 (100) | 455 (37.9) | 268 (22.3) | |
| Clinical improvement - no.(%) | |||
| Worse | 83 (6.9) | 55 (12.1) | 28 (10.5) |
| Stable | 269 (22.4) | 173 (38.0) | 96 (35.8) |
| Little improvement | 120 (10) | 67 (14.7) | 53 (19.8) |
| Much better | 249 (20.8) | 158 (34.7) | 91 (34) |
Data are n (%), percentages may not total 100 because of rounding.
Definition of abbreviations: 1 HIAE = Hospital Israelita Albert Einstein, São Paulo, Brazil; 2 HMVSC = Hospital Municipal Vila Santa Catarina, São Paulo, Brazil.
Table 3 Mobility milestone occurrence rate at ICU discharge
| Overall | HIAE1 | HMVSC2 | HMV3 | HNSC4 | |
|---|---|---|---|---|---|
| Sit, no. (%) | 733 (68.4) | 296 (65.1) | 123 (45.9) | 280 (91.8) | 34 (19.8) |
| Stand, no. (%) | 661 (60.6) | 258 (56.7) | 104 (38.8) | 268 (87.9) | 31 (18) |
| Walk, no. (%) | 494 (41.2) | 146 (32.1) | 97 (36.2) | 237 (77.7) | 14 (8.1) |
Data are n (%), percentages may not total 100 because of rounding.
Definition of abbreviations: 1 HIAE = Hospital Israelita Albert Einstein, São Paulo, Brazil; 2 HMVSC = Hospital Municipal Vila Santa Catarina, São Paulo, Brazil; 3 HMV = Hospital Moinhos de Vento, Porto Alegre, Brazil; 4 HNSC = Hospital Nossa Senhora da Conceição, Porto Alegre, Brazil.
Responsiveness
The overall responsiveness of the Perme Score showed a good capacity to detect changes over time, from ICU admission to ICU discharge, as follows: (1) sit position- the ROC curve showed an AUC= 0.89 (95% CI: 0.87-0.90), and the optimal cut-off value of 5.5, a specificity of 89.7%, and a sensitivity of 74.9%, OR= 1.37 (95% CI: 1.31-1.44; p <0.001) and H-L test χ2= 3.83 (Df 8), p= 0.872) (Figure 2-A ); (2) stand position - the ROC curve, which showed an AUC = 0.87 (95% CI: 0.85-0.89) and the optimal cut-off value of 9.5, with a specificity of 96.5%, and a sensitivity of 65.4%, OR= 1.30 (95% CI: 1.26-1.35; p <0.001) and H-L test χ2= 8.77 (Df (8), p= 0.362) (Figure 2-B ); and (3) walk - the ROC curve showed an AUC= 0.79 (95% CI: 0.77-0.82) and the optimal cut-off value of 13.5 specificity of 85.6%, and a sensitivity of 59.5%, OR= 1.15 (95% CI: 1.13-1.17; p <0.001) and H-L test χ2= 33.56 (Df (8), p <0.001) (Figure 2-C ). Additional information about the optimal cut-off value is shown at Table 4S, 5S, and 6S on the Supplementary Material to summarize the Perme Score responsiveness.
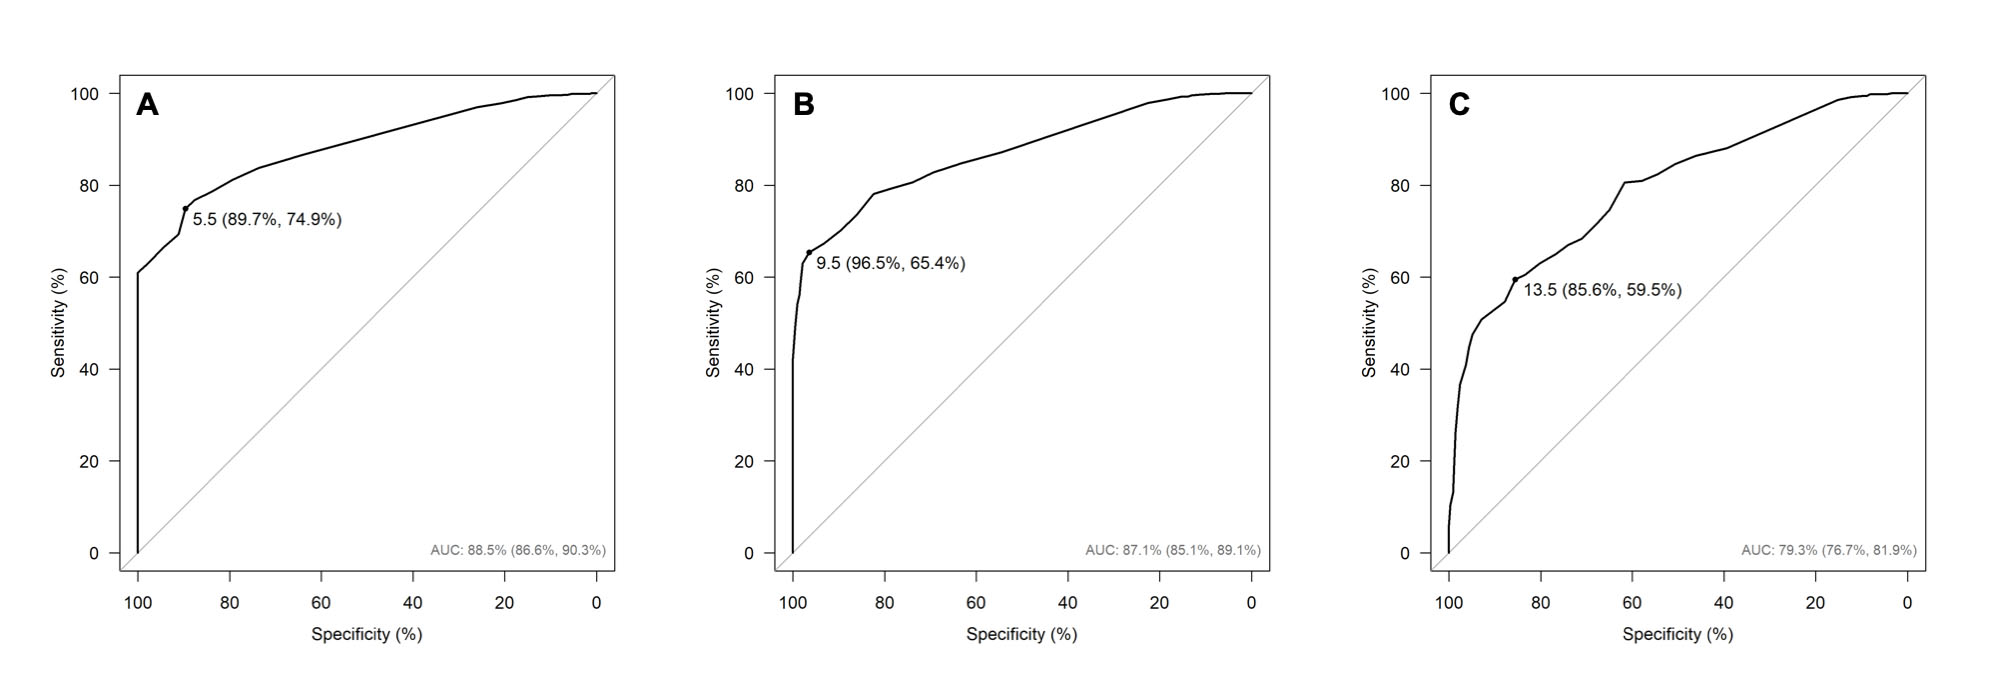
Figure 2 Responsiveness of the Perme Score. (A) Sit position - the ROC curve a the AUC= 0.89, 95% CI: 0.87-0.90, and the optimal cut-off value of 5.5 specificity of 89.7%; 95% CI: 86.14-92.63, and a sensitivity of 74.9%; 95% CI: 71.76-78.04 and calibration by H-L test χ2= 3.83 (Df (8), p= 0.872); (B) Stand position - the ROC curve shows the AUC= 0.87; (95% CI: 0.85-0.89), and the optimal cut-off value of 9.5 specificity of 96.5% (95% CI: 94.64-98.14), and a sensitivity of 65.4% (95% CI: 61.57-68.99) and calibration by H-L test χ2= 8.77 (Df (8), p= 0.362); and (C) Walk - the ROC curve shows the AUC= 0.79 (95% CI: 0.77-0.82), and the optimal cut-off value of 13.5 specificity of 85.6% (95% CI: 82.86-88.10), and a sensitivity of 59.5% (95% CI: 55.26-63.77) and calibration by H-L test χ2= 33.56 (Df (8), p <0.001). Definition of abbreviations: AUC= area under the curve, H-L test= Hosmer & Lemeshow test, ROC= receiver operator characteristics.
Floor and ceiling effects
The Perme Score presented a significant floor effect at ICU admission of 19.3% (scored '0' points), and a ceiling effect of 0.6% (scored '32' points). Nevertheless, the Perme Score presented acceptable floor and ceiling effects at ICU discharge of 8.8% (scored '0' points) and 4.9% (scored '32' points), respectively.
Internal consistency
The internal consistency was based on the Cronbach's alpha coefficient (Cronbach's α) value. For the Perme Score items' 2 to 6', the internal consistency was moderate at ICU admission and discharge, as follows: Cronbach's α= 0.70 (95% CI: 0.67-0.73) and 0.65 (95% CI: 0.61-0.69), respectively. For items 1, 7 and 8, the internal consistency was excellent at ICU admission and discharge, as follows: Cronbach's α= 0.93 (95% CI: 0.93-0.94) and 0.89 (95% CI: 0.88-0.90) respectively. For the Perme Score items' 9 to 15', the internal consistency observed was also excellent at ICU admission and discharge, as follows: Cronbach's α= 0.96 (95% CI: 0.95-0.96) and 0.97 (95% CI: 0.96-0.97), respectively.
Predictive validity
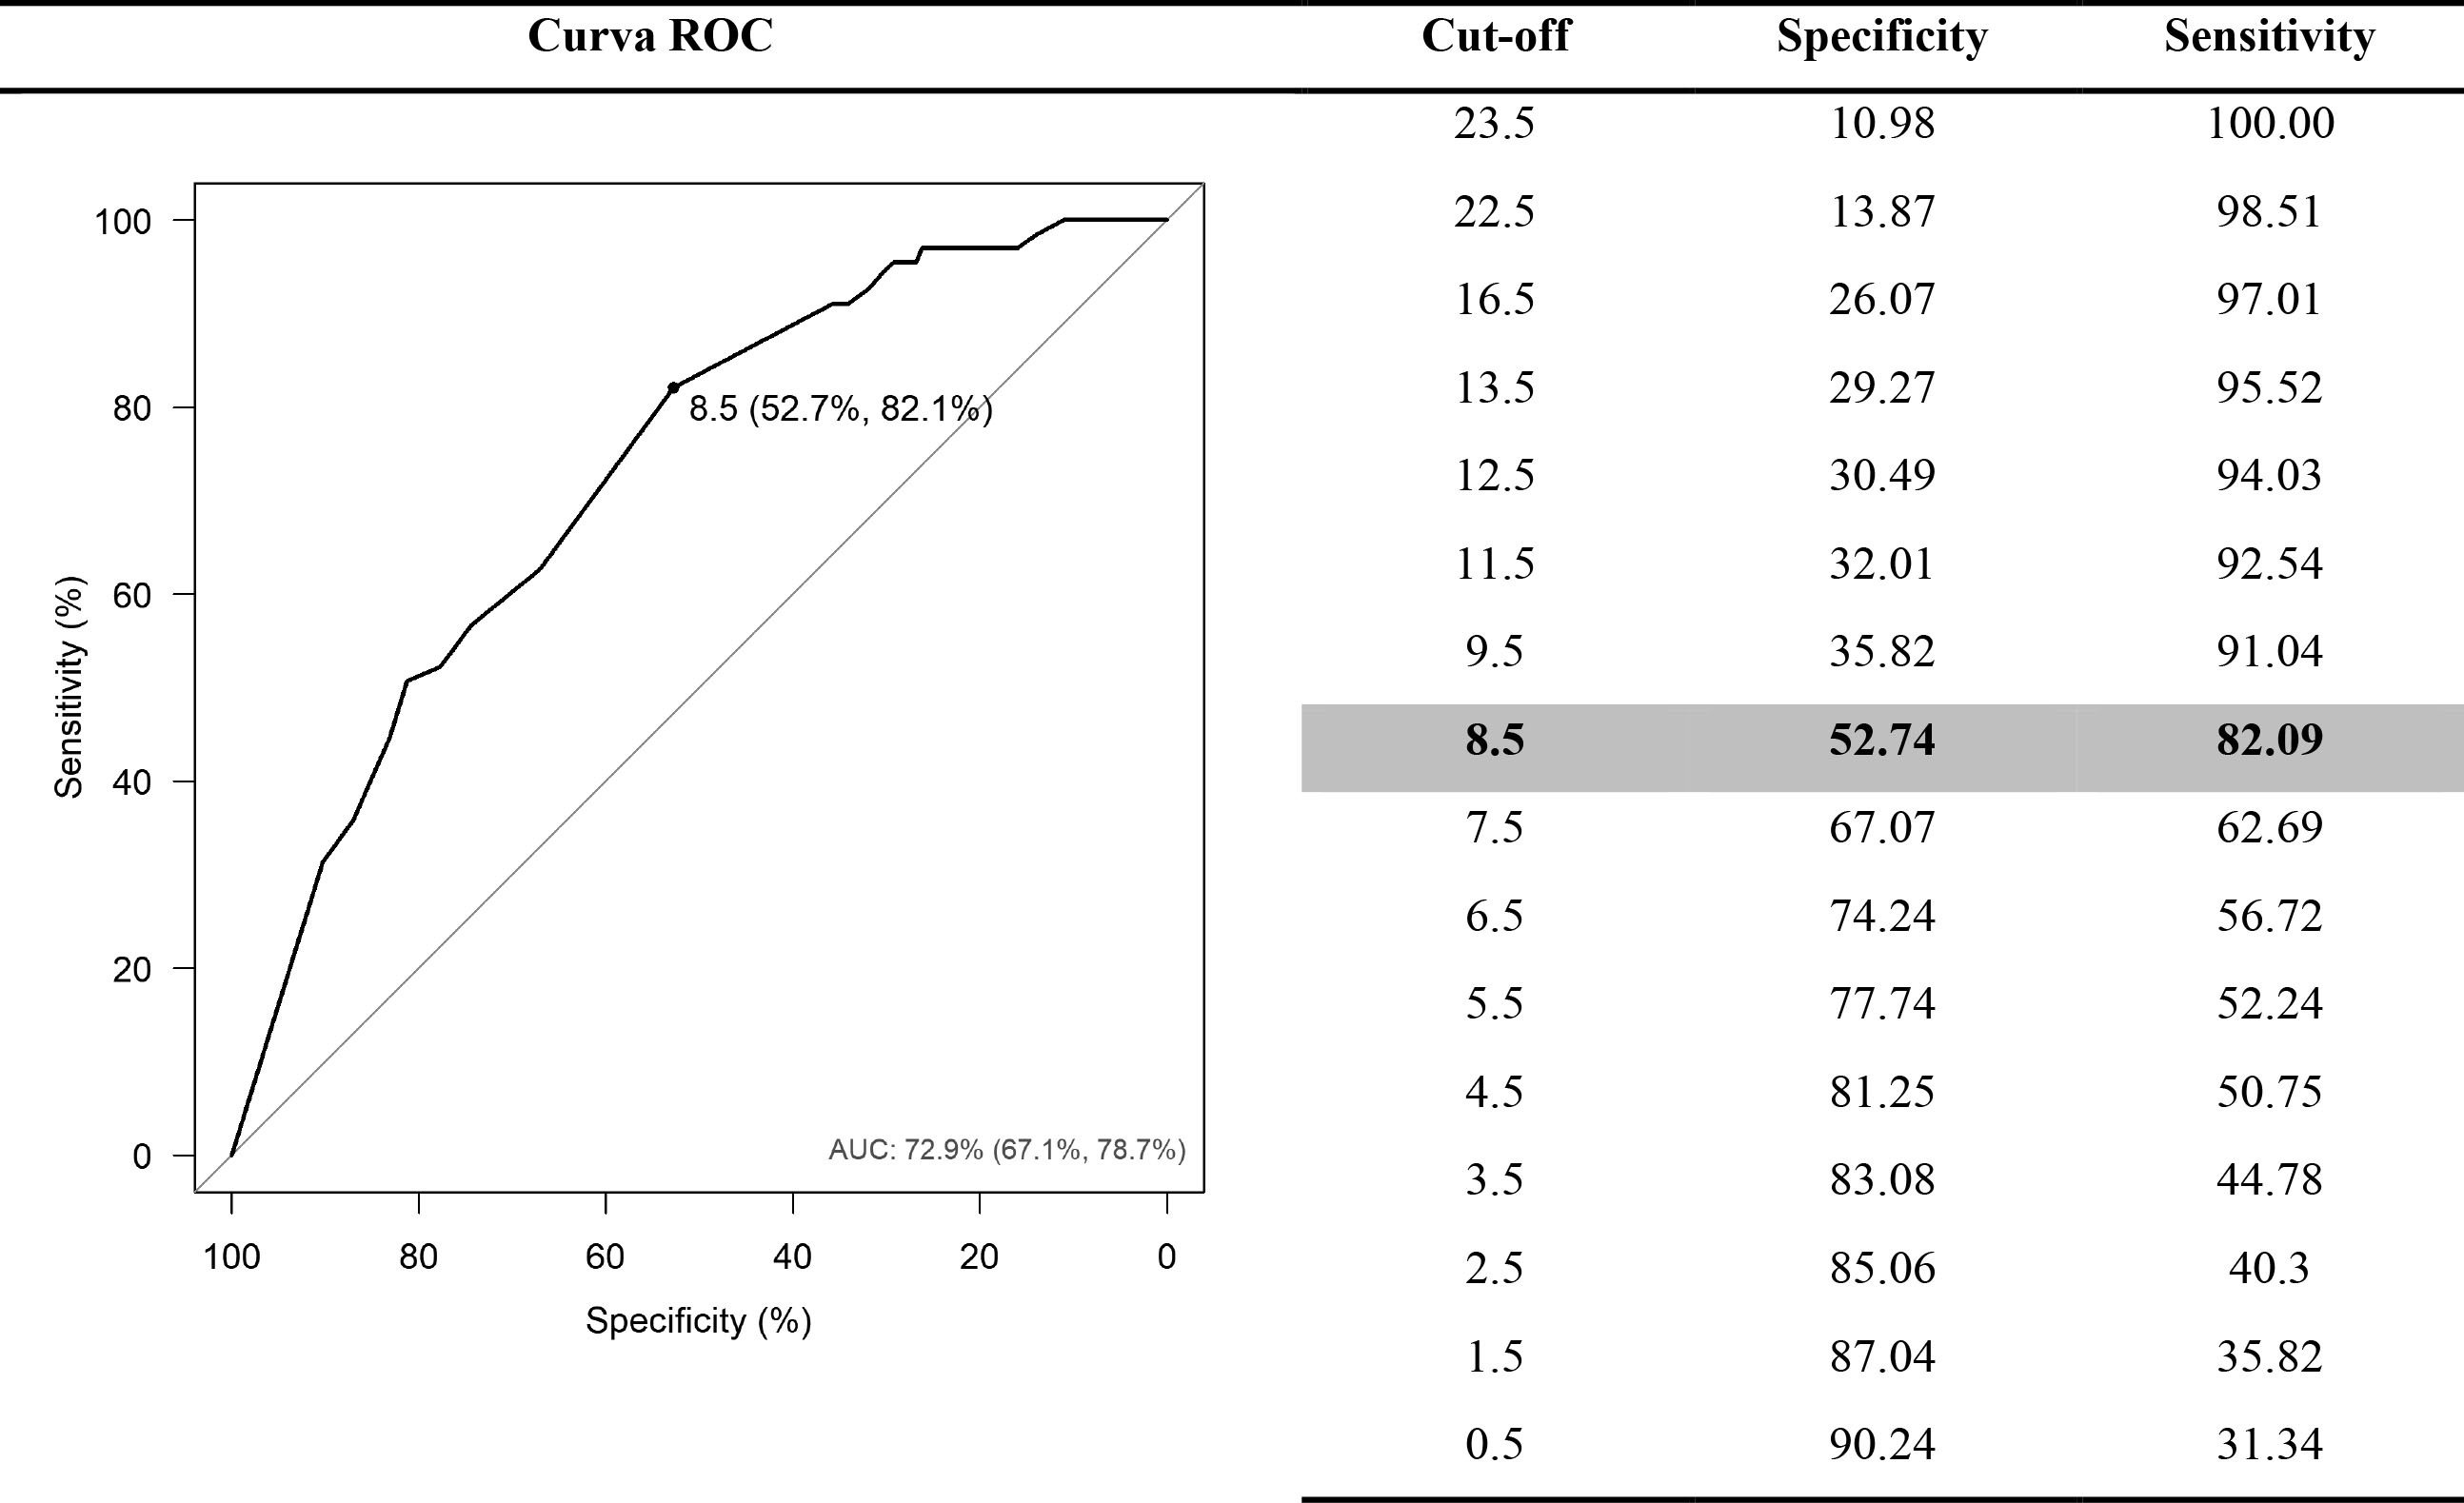
The total Perme Score at ICU admission predictive validity for hospital mortality showed OR= 0.86 (95% CI: 0.82-0.91). We also constructed a ROC curve, which showed an AUC = 0.792 (95% CI: 0.67-0.78) and an optimal cut-off value of 8.5, by Youden criteria, with a specificity of 0.53 (Figure 2S on the Supplementary Material for a summary of the predictive validity). The predictive validity between the Perme Score at ICU admission and the ICU length of stay showed that the addition of one unit in the Perme Score is expected to decrease 3.1% in the average ICU length of stay, and a mean ratio of ICU stay MR= 0.969 (95% CI: 0.96-0.97). However, the predictive validity between the Perme Score at ICU discharge and hospital stay after ICU discharge showed no evidence of a relationship between the variables and a mean ratio of hospital stay after ICU discharge MR= 0.99 (95% CI: 0.98-1.0) for hospital stay after ICU discharge.
Discussion
This study has shown the Perme Score establishment of the MCID and the predictive validity of hospital mortality and ICU length of stay. The Perme Score was also responsive to change; no floor or ceiling effects were present at ICU discharge in a mixed general ICU population. This is the first study to assess the predictive validity of the Perme Score about in-hospital mortality.
When selecting a measurement instrument, it is important to guarantee that it is being utilized only in the population for which they are intended or validated and at the time they are responsive 22,23,27,30 The clinimetric properties test is necessary to use outcome measures with strong evidence 30. This study calculating the MCID of the Perme Score will allow for a better understanding and interpretation of the results reported in previous studies already published using the Perme Score as an outcome measure 6-10,31-34. This should help clinicians and researchers provide better accuracy in physical therapy and rehabilitation interventions. However, this is not the first study to calculate the MCID of the Perme Score. A previous single-center study conducted with patients admitted to the ICU established an MCID of 1.36 points attributed to improved functional mobility 11. This value can be considered questionable because the value seems to be too narrow once the Perme Score total points range from '0' to '32' points. Additionally, the MCID found in this study might be appropriate for the convenience sample included in the study, not considering a higher number of patients from multicenter studies, which may better represent a population of a general ICU cohort. The strengths of our study were the multicenter design with a large number of patients included and a wide range of admission diagnoses, allowing generalizability of the results. The literature supports using different methodologies to calculate the MCID (e.g., anchor and distribution-based) 21,35-37. The study published by Wilches-Luna et al. (2020) 11, calculated the MCID using a distribution-based approach 37,38, based on the calculation of the standard error of measurement (SEM) index. The SEM index is calculated with the square root of two times the cut-off value of 1.96, representing a normal standard curve associated with a 95% CI 11. Our study adopted the methodology resulting in the greatest AUC, maximizing sensitivity and specificity, according to Youden's criterion, which tends to be more consistent when compared with the distribution-based approach. In order to establish the more appropriate value of MCID, we chose the data point closest to the upper left corner of the curve, with the best balance of sensitivity and specificity 35.
The results of this study also showed good responsiveness of the Perme Score when applied to a general mixed ICU population. The score detected changes in patients' mobility status over time during ICU stay. The responsiveness of a measurement instrument is a relevant psychometric item of a clinical scoring system. It determines whether the measure can detect changes it was designed to measure in the environment and cohort it was intended for 22 other measures of physical function have been designed for use in the ICU, and studies have been published testing the clinimetric properties of these instruments 1. We found a moderate floor effect at ICU admission. However, this is very likely to be related to the deep sedation of participants included in the study, yet close to values less than 15% considered acceptable by the literature 23,24. This finding is lower when compared with 31% found in a previous study 11. Similarly to the Wilches-Luna et al. 11, study, the ceiling effect was shallow at ICU admission and can be considered nonexistent. None of the previous studies have tested the predictive validity of the Perme Score, although this has been shown in this study. The findings of our study presented consistent data on the predictive validity of the Perme Score for hospital mortality and ICU length of stay.
Since the Perme Score is available in different languages 4,6,7,39, , we believe the results of this study will allow for extrapolation of the findings to interpretations of clinical conditions and research purposes, thus improving its utility. However, it is important to emphasize that no physical function assessment scoring system will ever be able to remain responsive to patients' clinical progress during the hospital stay linearly.
Our study has limitations. Although this was a multicentric study conducted in four different centers, the retrospective nature of this study should be considered a limitation. First, due to the significant number of enrolled patients, we truly believe our findings can contribute to clinical practice and a better understanding of mobility status assessment for hospitalized patients. Second, the time frame established was limited only during the ICU stay; we did not follow patients' mobility until hospital discharge due to the lack of the validation process of the use Perme Score outside the ICU setting. Another possible limiting factor would be that some analyzed variables, mainly in relation to the characterization of the sample, are not presented by all the centers included. However, we believe that this does not compromise the primary outcome of the present study, which was presented by all centers, which ensures adequate analysis as well as the outcomes obtained. Because the test can have a switching effect and is modifiable by therapeutic interventions, studies with a prospective design are required to evaluate these effects.
Conclusion
The establishment of the Perme Score minimum clinically important difference will improve its clinical use and the interpretation of the total score of points. A limited overall ceiling and moderate floor effect at ICU admission were observed. The Perme Score presented strong evidence of its capability to detect changes in patients' mobility status over time, showing responsiveness in a mixed general ICU population.