


 English (pdf)
 Article in xml format
 Article references
 Send this article by e-mail
 Cited by SciELO
  Cited by Google
  Similars in
SciELO
Similars in
SciELO  Similars in Google
 Permalink
1. INTRODUCTION
Brands are being made by peoples. They are the results of relationships between Peoples who build them and the individuals who purchase them (Harris 2007). Branding affects all aspects of a company and involves customers and employees. A company that makes a brand shapes all the things related to the business (King and Grace 2008). Branding is an effort to integrate all the things pertinent to a product or service in order to make customers remember them (Walvis 2008). Brand personality is a key factor that shows condition of a brand. Successful branding results in success in making eligible brand personality (Keller and Richey 2006). After success in branding the companies may face a new problem, called brand imitation. Being similar to a leading brand can help new products to remain competitive. For example, “if you don’t have access to your favorite drinking like Redbull, you’ll probably prefer the drinking which name is similar to it” (van Horen and Pieters 2012).
Although imitating a brand is a technique for mimicking developed brands’ success but it makes financial losses to the leading brands in long term (Zaichkowsky 2006).This prevalent technique may imitate a brand at least in color, size, and shape in addition to name and logo (Scott Morton and Zettelmeyer 2004). “Imitation in similar packaging can confuse two thirds of buyers and mislead on third of them” (Le Roux, Bobrie et al. 2016). Brand imitation can also decrease customer satisfaction of luxury brands because copycat brands cannot often please customers for their lack of quality. Therefore, it will mentally affect people who avoid buying imitated brands. This process will erode people’s confidence in those brands and make financial losses to them. Copycats, first, find the specification of a leading brand. For this purpose, they focus on name, logo, color, size, or shape of a product. “They also may mimic meaning or theme of a specified brand for instance, the wild cat theme of the puma or the traditional family-produced olive oil theme of the Bertolli brand” (Van Horen and Pieters 2013).
In studying brand imitation, it is necessary to recognize the factors that affect imitation. These factors are important because we must know which factor affects imitation more in order to prevent imitation process. In this study, we try to recognize these factors and rank them. For this purpose, we need to identify these factors by conducting a literature review. Then we ask experts to judge about the selected factors. We must assign a weight coeftcient to each factor and then ranking process will start. Ranking will be performed by using TOPSIS-Rough method. Also, the authors rank the effective factors by use of TOPSIS-Fuzzy method. This is useful because we can compare the findings of the employed methods and study the results. Therefore, this paper recognizes brand imitation constructs and deals with two important questions: (1) what are the provoking qualities which give rise to brand imitation? And (2) how important are these effective qualities in preventing imitation? These questions display the main ideas behind this study and answering them fills the gap in the previous works. This paper adds to the literature in several aspects. First, this is the first study in collecting and ranking imitation factors while previous studies just developed and tested the stimulating factors. Second, we employ a ranking method based on TOPSIS-Rough. This method consolidates the potencies of rough set theory in tackling vagueness and the capacity of TOPSIS in modeling multi criteria decision making to achieve robust results in existing research, but most studies do not consider this approach. Finally, we compare the results obtained by TOPSIS-Rough with those of TOPSIS-Fuzzy approach to check the strength of the applied method.
The reminder of the paper is organized as follows. In section 2 a review of imitation brand, its definition, especial aspects, and related works are presented. The proposed method based on TOPSIS-Rough is described in section 3. An empirical experiment is carried out using TOPSIS-Rough method in section 4. A TOPSIS-Fuzzy analysis is performed in section 4 to recalculate the ranking of the effective factors and evaluate the results’ robustness of the proposed method by a comparison presented in section 5. Finally, section 6 concludes the paper.
2. LITERATURE REVIEW
2.1. Defining imitation
Imitation is different from counterfeit. We define imitation as ”product or service, though not identical, (which) is viewed as similar in substance, name, shape, form, meaning or intent to an acknowledge and widely known product or service currently in the market place”(Lai and Zaichkowsky 1999). In other words, imitated products are those that look similar to other branded products, but are not identical (Le Roux, Bobrie et al. 2016). For defining lookalikes we refer to Balabanis and Craven (1997) to define it as ”a new generation of own brand products that have similar packaging characteristics to leading brand products” (Le Roux, Bobrie et al. 2016). Imitation is similarity in shape, logo, theme, appearance to a popular or accepted product or service (Lai and Zaichkowsky 1999).
2.2. Imitation aspects
After knowing about imitation the important thing is to understand whatever can be imitated. Researchers have defined multitude aspects of imitation. They have listed the aspects of products or services that can be imitated. “Copycats imitate the name, logo, and/or package design of a leading national brand to take advantage of the latter’s positive associations and marketing efforts” (Femke van Horen and Pieters 2012). Although everything that is important to success of a product can be imitated, feature is most accessible aspect of a product to imitate. Name, logo and package that are mentioned above belong to feature.
2.3. Effective imitation factors
Similarity to a leading brand is the most common strategy for copycat brands (Fazio 1986). “An important precondition for eftcient brand imitation strategy is similarity to the leader brand. Connection and relevance to the leader brand are pivotal keys for evaluation imitating. (Fazio 1986, Van Horen and Pieters 2013). In this paper, we aim to investigate the effective imitation factors. This seems important to know why some brands are more imitated than others. For this purpose, first, the authors seek the effective factors which reveal how leading brands can protect themselves from imitation. Name, appearance, place, and price are important factors that may affect imitation. We can use feature, as an important factor, instead of name because feature also includes name. Appearance signifies the figure of product such as packaging feature. Place represents where product is sold. Product price is also a significant quality (Le Roux, Bobrie et al. 2016).
Theme copycat is mainly varied from feature copycat. Theme is the background of brand feature (van Horen and Pieters 2012).“Brand specificand feature specific factors are hypothesized to influence speed. Brand specific factors include the brand’s category market, share, and the brand’s sponsorship-whether it’s a national or a store brand. Feature specific factors subsume the price premium charged for the new feature and the use of new technology to introduce a new feature. Research shows that an inverted U-Shaped relationship captures the relationship between share and imitation speed. (Sinapuelas 2007). High share and low share brands tend to imitate slower than intermediate share brands. High category share brands tend to wait and see until uncertainties are resolved and consumers accept the new feature, while low share brands are slow to imitate because of the lack of resources to imitate fast.
According to Porter’s five forces theory bargaining power of suppliers, bargaining power of buyers, threat of new entrants, threat of substitutes, and industry rivalry are the cardinal factors that affect attractiveness of an industry. These factors also affect brand imitation because attractiveness of an industry can affect attractiveness of a leading brand in that industry. Also, legislation is another factor that influences the attractiveness of an industry. Therefore, legislations and the level of intellectual property rights impact imitation. The threat of new entrants by spread of technology is also another effective factor. Moreover, brand value is an cardinal factor. By having category market share we don’t need to write industry rivalry. In summary, Factors that affect imitation are showed in Table 1.

2.4. Rough number based on rough set theory
The process of project risk and network analysis confronts uncertainties. Therefore, adopting methods with the capability of modeling uncertainties, such as fuzzy logic, seems appropriate for initial judgments. In addition, this study uses ordered pair numbers that needs a particular model to draw a comparison between them. If conventional mathematical logic is used, it will be necessary to apply desk comparisons or stable comparison sort. This kind of sorting has a great disadvantage because it demands large amount of memory. Since data of this filed have high- volume, the above methods are not applicable for this problem and rough numbers system is employed instead. This is an appropriate tool for dealing with inaccurate data based on expert opinions. The rough set theory was first proposed by (Pawlak 1982). This is an eftcient mathematical tool for dealing with subjective and inaccurate data with no need for excessive assumptions and additional revisions. In this theory, the concept of vagueness is shown by a pair of upper approximation and lower approximation, based on accurate concepts (Pawlak 1991). The lower approximation of set S is the set of all elements that are certainly included in S while the upper approximation includes elements whose attachment to S is uncertain. Fig. 1 shows the primary logic of rough set theory.
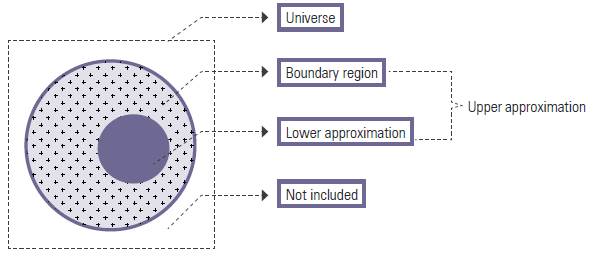
Source: Lee, C., Lee, H., Seol, H., & Park, Y. (2012). Evaluation of new service concepts using rough set theory and group analytic hierarchy process. Expert Systems with Applications, 39(3), 3404-3412.
Figure 1 Primary logic of rough set theory (Lee et al, 2012)
2.4.1. Rough numbers and standard mathematical operations
Let us assume U is a world encapsulating all things. The boundary region of S in U is composed of elements that are neither an element of the target set nor excluded from the set (Greco, Matarazzo et al. 2001). Zhai, et al.(2008) argued that upper approximation, lower approximation, and boundary region can be used against human inaccurate and subjective judgments. Assume a set of n groups of human judgments 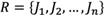 as sorted as
  where Y is an arbitrary object of U. In this case, the upper and lower approximations of
  and boundary region is determined as follows:


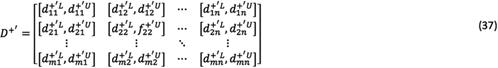
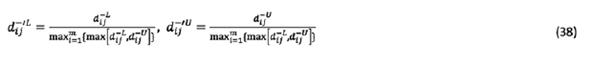
Therefore, human subjective judgments and preferences,  , can be displayed by a rough number determined by its lower limit,
  , and the upper limit,
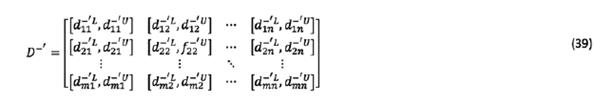
  . Interval of boundary region indicates the degree of accuracy. A rough number with the small interval of boundary region is interpreted as a more accurate number. Human judgment and the interval of boundary region are expressed by the following equations:


Interval analysis operations for rough numbers are applied as Equations (6) to (8):


2. 4. 2. Comparison of rough numbers and converting into crisp values
Rough set-based rating, pursued by this study, follows its own rules. In summary, there are three general rating rules (Zhai, Khoo et al. 2008). Let us assume  and
and  are the upper limit of numbers A and B, and
  and
and  are the lower limit of rough numbers A and B, respectively. There are three possible alternatives:


In Equation (11), rough numbers are compared via the following rules after the calculation of M:


Following the calculation of rough numbers, a set of rough numbers should be converted to crisp values in order to sort their rank. Let  and
and  be the upper approximation and the lower approximation of rough number
  and
and  be the optimism index. Therefore, the equation for converting the rough number to a crisp value (Song, Ming et al. 2013) will be as follows:

3. PROPOSED METHOD
The proposed method is accompanied by two assumptions. First, assume that there are k DMs and their opinions contributing to the final decision with the same importance  . Second, assume that there are m selection alternatives
  . The proposed method consists of eight steps as follows.
Where  is the value of the
  alternative in the
  criterion of expert’s opinion according to the
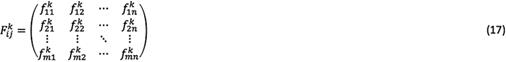
  expert. Then, group decision matrix is formed as matrix (18).
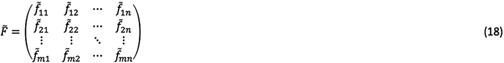
So that:
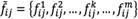
Step 2: converting  array of matrix
  to a rough number in order to constitute the rough group assessment matrix F using equations (19) and (20).


Thus,  can be displayed as a rough number determined by its lower limit,
  , and upper limit,
  , in which:

 and
and  are the lower approximation and the upper approximation components of
  , respectively.
  and
and  are the number of components placed in the lower approximation and upper approximation of
  , respectively. Now, rough number
  can be displayed as Equation (23):

where  and
and  are the lower limit and the upper limit of rough number
  in the pairwise comparison matrix, respectively. Then, it is possible to formulate the sequence of rough numbers as Equation (24):

In addition, mean rough intervals are defined as Equations (25), (26) and (27):


where  and are the lower limit and the upper limit of rough number
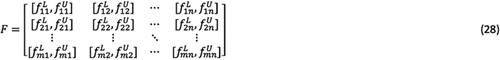
  , respectively. m is the number of experts. At this point, it is possible to form the rough group decision matrix, F, as matrix (28):
Step 3: Generating the positive ideal solution (PIS) and negative ideal solution (NIS) based on the characteristic of each criterion. Obviously, for the benefit criterion, its PIS value and the NIS are the largest and the lowest values that it may take, respectively. The PIS and NIS are formulated in Equation (29).

Where  and
and  are PIS and NIS values with respect to criterion j. B and C represent benefit criterion and cost criterion, respectively.
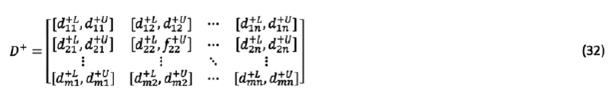
Step 4: calculating the deviation coeftcient. The deviation coeftcient (in the form of rough numbers) is calculated using the distance between the rough number and its PIS and NIS values as follows:

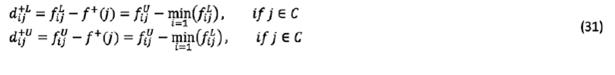
 represents the distance between a rough number and its PIS.
  and
and  denote the lower and upper limits, respectively. Now, we can establish the deviation coeftcient matrix
  as follows:

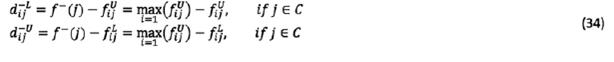
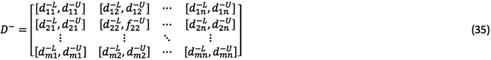
 represents the distance between a rough number and its NIS.
  and
and  denote the lower and upper limits, respectively. Now we can establish the deviation coeftcient matrix,
  , as follows:
Step 5: Normalizing the deviation coeftcients of alternatives and obtaining the normalized deviation coeftcient matrices,  and
and  , as follows:

 and
and  represent the lower and the upper limits of normalized deviation coeftcients between a rough number and the PIS.
 and
and  represent the lower and upper limits of normalized deviation coeftcients between a rough number and the NIS.
Step 6: Calculating the separation measure  and
and  (weighted normalized deviation) of each alternative as follows:


Separation measures and represent weighted normalized deviation of alternative i from its PIS and NIS values, respectively.  is the weight of the
  criterion obtained from expert’s opinion.
Step 7: Transforming the separation measures  and
and  into a crisp value with the optimistic indicator
 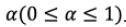 . If decision makers are more pessimistic, they select a smaller value for α (α < 0.5). If decision makers are more optimistic, they can select α with a bigger value α (α < 0.5). If decision makers keep a realistic and moder- ate attitude, in other words, neither very optimistic nor very pessimistic, they give value of 0.5. The transformation calculation is as follows:


 and
and  represent the crisp value of rough number
  and , respectively.
Step 8: Calculating the distance closeness coeftcient of all alternatives for their priority rankings.

Then, the author prioritize the data sequences based on the  . An alternative with a larger is a better choice because it is probably closer to the PIS and farther from the NIS.
4. CASE STUDY
In this study, three groups of brand experts were asked to rank the brand imitation factors through questionnaires. One group included brand experts with academic career. The second group consisted of experts with practical experiments, and the third group was formed with peoples who were expert in academic and practical aspects of brand studies, simultaneously. Each group included 5 experts. The weight factor for advices of group 1 and 2 was 0.4 and it was 0.7 for group 3. Factors are shown in Table 1. Ranking Steps are classified as follows:
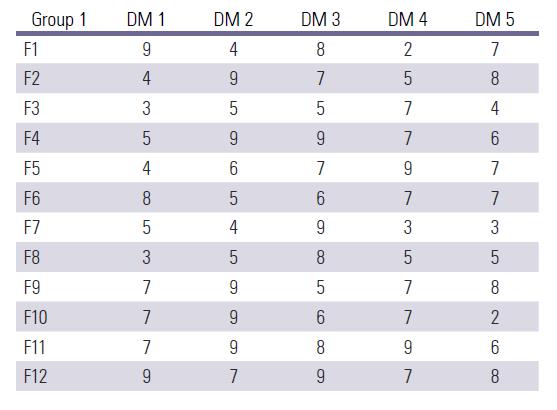
Step 1: Forming individual decision-making matrix, as shown in Table 2, using the opinion of three groups of brand experts derived from questionnaire. The rows of this matrix stand for alternatives i.e. the factors that affect brand imitation whereas the columns stand for criteria i.e. Expert’s opinion.
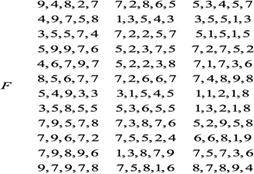
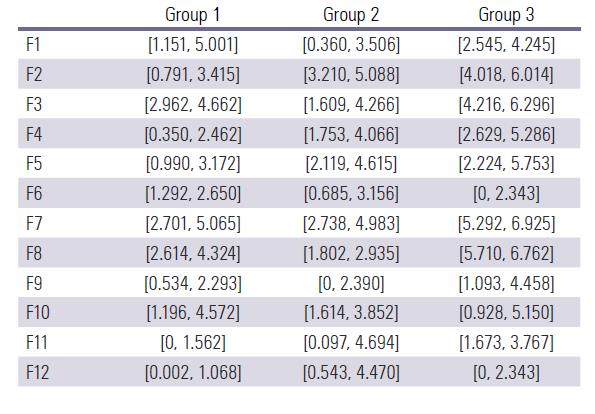
Then, group decision matrix is formed(F), as presented in Figure 2.
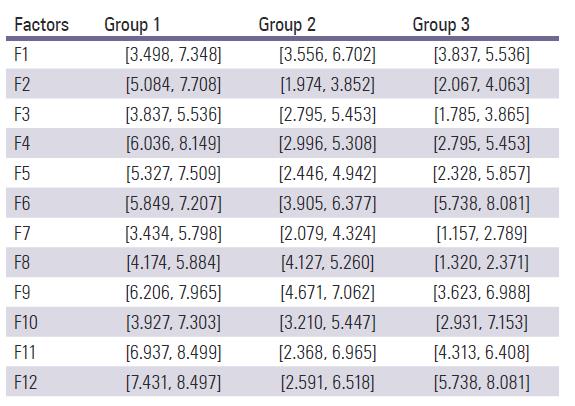
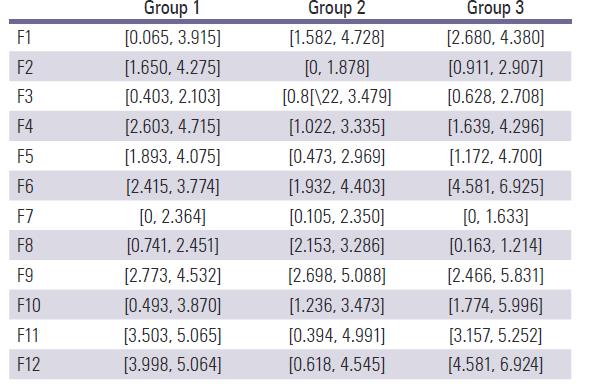
Step 2: Transforming the group decision matrix to rough numbers for forming rough group decision matrix as presented in Table 3.
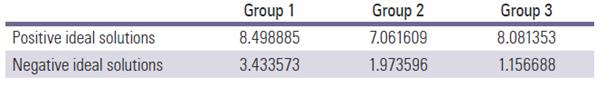
Step 3: Positive and negative ideal solutions are defined as presented in Table 4.
Step 4: Calculating the deviation coeftcients (distance of each criterion from the PIS in Table 5 and from the NIS in Table 6).


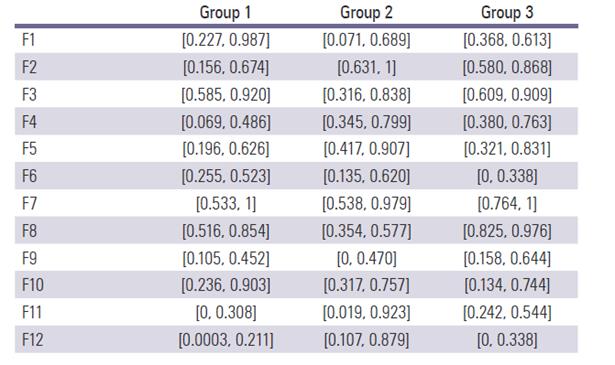
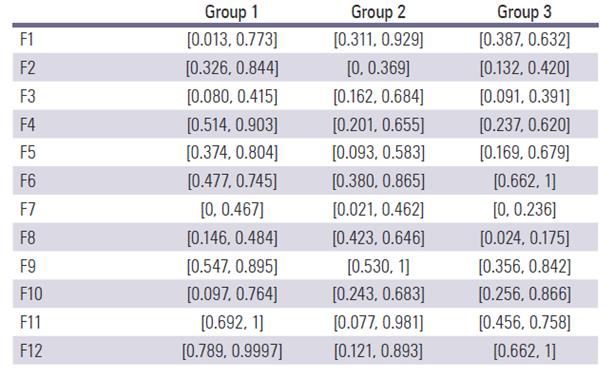
Step 5: Normalizing the deviation coeftcients of alternatives in Tables 7 and 8.


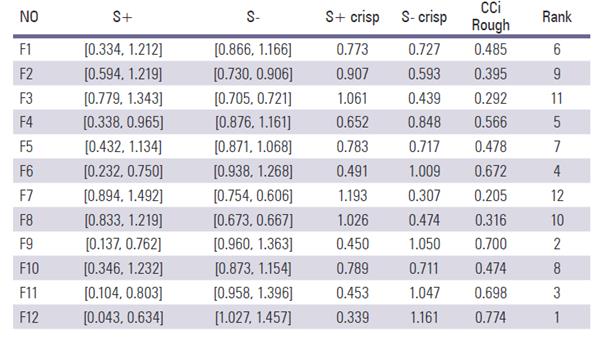
Step 6: Computing the separation measure  and
and  , as shown in Table 9.
Step 7: Transforming the separation measures  and
and  into crisp values with the optimistic indicator as presented in Table 9.
Step 8: Calculating the relative closeness to the ideal solution and ranking the alternatives. The rank results can be seen in Table 9. The rank of criteria is as follows:
F12>F9>F11>F6>F4>F1>F5>F10>F2>F8>F3>F7.
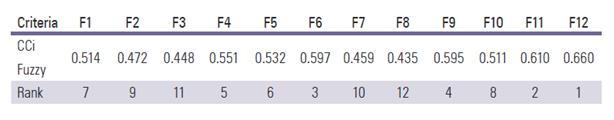
5. COMPARISON AND DISCUSSION
For comparison, TOPSIS method was implemented with fuzzy numbers. According to the resulted, shown in Table 10, the ranking is as follows:
F12>F11>F6>F9>F4>F5>F1>F10>F2>F7>F3>F8.
In both methods F12 (Legislation) is the most important factor. Both Rough and Fuzzy numbers describe similar mathematical concepts. Both applied methods describe vague information and recognized the range of ambiguity through fuzzy and rough limit measures. Mathematical operations of both rough and fuzzy groups are based on ranges. Rough theory is similar to fuzzy, evidence, and grey theory but this approach is independent.
TOPSIS rough method shows priorities in experts’ judgments. Although TOPSIS fuzzy operates like a logical method for ranking in a fuzzy condition, there are several limitations. One limitation is individual membership function that needs more information and investigation. Furthrmore, fuzzy range, indicating individuality and ambiguity, is a constant dependent to the membership function. For instance, in decision matrix the related scores for expert’s advice are 7, 7, 6, 5, and 8 that are in the constant distance range of triangular numbers of (8,6), (8,6) , (5,7) , (6,4) , and (9,7), respectively. Geometric mean of collective advices of experts is (5.501, 7.529) but the fuzzy mean range is not suitable for a real experiments because the distance that shows approximation range in ranking differs when we have experts with different sciences and experiments. In TOPSIS Rough collective ranking approach, the mentioned numbers are converted to more flexible and smaller ranges as (8, 6.517), (6.517, 5), (6.964, 5.477), (7.174, 6.192), and (7.174, 6.192).
The fuzzy collective mean range is (5.846, 7.207) that is smaller than fuzzy range. Similar results are derived from other arrays of matrix. Large distances show more ambiguities that are not acceptable in risk rankings. Therefore, rough numbers provide higher level of significance than fuzzy numbers.
With TOPSIS Rough collective method change in expert’s priorities can be recognized because of rough number’s capability for determining limitations based on total expert’s priorities. If experts in previous example alter their judgments to 4, 7, 6, 4, and 7, then Fuzzy ranges will change as these: (3, 5), (6, 8), (5, 7), (3, 5), and (8, 6). Also, rough ranges will change to these: (4, 5.426171), (5.426171, 7), (4.578857,
6.66494), (4, 5.426171), and (5.426171, 7). It is clear that fuzzy modified ranges also have the constant distance that is equal to 2. This constant distance is not real because change in advices cannot be recognized in this method. This will affect decision and ranking in affair.
This study is an effort to rank imitation using rough numbers’ specifications. Comparing the results of this method with Topsis-Fuzzy, according to brand imitation literature, reveals that which method can be more useful for this purpose. The result derived from Topsis-Fuzzy method is similar to TOPSIS-Rough method but not the same. The important thing is that legislation is the most important factor that affects imitation in both methods. In rough method, technology is more important. This finding seems to be true because high technology can prevent imitation while the appearance attracts imitators. In Topsis-Fuzzy method, in addition, value is more important than technology that is not really true because if a company decides to imitate a product with high brand value and it will not be able to copy technology and manufacture the product it can’t imitate it. This means the TOPSIS-Rough method has gave us more logical answers.
6. CONCLUSION
Brand imitation can result in deep failures for businesses. To prevent this, we must first know what brand imitation is and recognize brand imitation factors. These factors are collected from literature. The second step is to rank these factors. In this paper, we employed TOPSIS-Rough method to rank the factors and compared the results with TOPSIS-Fuzzy. By comparison of two mentioned methods, it is clear that the most important factor that affects imitation is legislation. Thus, the act of laws for preventing imitation can be emphasized. The second effective factor is technology. Technology is influential in two ways. It can be effective by preventing new entrants according to Porter’s theory. It also can avoid imitation by making it diftcult for rivals. It means that if we want to stop brand imitation, we must codify law to stop them. Also imitation occurs usually in cases that lack of high technology is observed. Laws and technology are two cardinal factors that can prevent brand imitation and counterfeit. According to the findings, appearance is the third factor. Attractiveness of appearance and also easiness of appearance imitating can be effective. Brand value is the fourth factor which shows prosperity of a brand. Imitators are eager to select brands with high value to imitate. Following the effective factors are adduced with their significance priority:
TOPSIS FUZZY :
Legislations > Appearance > Value > Technology > Market share > Finance > Feature > Substitutes > Place > Suppliers > Price > Buyers
TOPSIS ROUGH :
Legislations > Technology > Appearance > Value > Market share > Feature > Finance > Substitutes > Place > Buyers > Price > Suppliers

