


Serviços Personalizados
Journal
Artigo
 Espanhol (pdf)
 Artigo em XML
 Referências do artigo
 Enviar este artigo por email
Indicadores
-
 Citado por SciELO
 -
 Acessos
Links relacionados
-
 Citado por Google
 -
 Similares em
SciELO
Similares em
SciELO -
 Similares em Google
Compartilhar

 Permalink
Revista Ingenierías Universidad de Medellín
versão impressa ISSN 1692-3324versão On-line ISSN 2248-4094
Rev. ing. univ. Medellin v.8 n.14 Medellín jan./jun. 2009
El impacto de las inversiones extranjeras directas en las economías en desarrollo y el ambiente
Luis Carlos Arango Vieira2
2 Negociador Internacional, Universidad EAFIT. B.A. in Business Administration, Metropolitan College London Campus. larango4@eafit.edu.co
ABSTRACT
All of us that are concerned about the environment should ask if the increase in capital mobility associated with the world-wide process of liberalization, deregulation and privatization known as the Neo-liberal global regime has contributed to the problems of higher emissions, ozone layer destruction, and pollution of water sources, as well as to create false economic bubbles that lead to increase consumption in these regions and force the poor to destroy the environment in order to survive and cope with the roles their society demands. Neo-liberal practices such as those enforced in developing countries like Colombia, seeking to attract foreign investment to push their economies tend to generate a false aggregated demand growth, that in most cases is not sustainable in the long term, and thus high global unemployment, unleash destructive competitive processes, and weaken government's ability to regulate business in the citizens best interests. The forces of global Neo-liberalism are now so powerful that it has become difficult if not impossible for countries like Colombia to maintain non-Neo-liberal economic structures, in which countries are forced to deregulate FDI policies and receive inflows of capital no matter the terms and the objectives as long as it helps to maintain consumption levels.
Key words: Capital Mobility, EKC: Environmental Kuznet Curve, FDI: Foreign Direct Investment, Neo-liberal Regime, Emmissions, Ozone Layer, Pollution, Economic bubble, Consumption.RESUMEN
Todos los que nos preocupamos por el medio ambiente debemos preguntarnos si el aumento en la movilidad de capitales, asociado con los procesos mundiales de liberalización, desregulación y privatización conocido como “neoliberalismo”, han contribuido al problema del aumento en las emisiones, la destrucción de la capa de ozono y la polución de fuentes de agua, así como a la creación de falsas burbujas económicas que llevan a aumentar el consumo en estas regiones, obligando a los más pobres a destruir el medio ambiente para sobrevivir y poder cumplir con los roles impuestos por la sociedad. Prácticas neoliberales, tales como las implantadas en países en vías de desarrollo como Colombia, que buscan atraer inversión extranjera para impulsar sus economías, tienden a generar un falso crecimiento de la demanda agregada que, en la mayoría de los casos, no es sostenible en el largo plazo, y generan eventualmente, un aumento del desempleo y de procesos competitivos destructivos, y debilita la capacidad de los gobiernos de regular los negocios y salvaguardar los intereses de los ciudadanos. Las fuerzas del neoliberalismo en el ámbito global son ahora tan poderosas que es muy difícil, por no decir que imposible, para países como Colombia el mantener estructuras económicas no neoliberales en las que no se obligue a los países a desregularizar las políticas de IED y recibir influjos de capital, sin importar en qué condiciones y con qué objetivos, con tal de ayudar a mantener los niveles del consumo.
Palabras clave: la movilidad del capital, CMK: Curva Medioambiental de Kuznet, IED: inversión extranjera directa, régimen neoliberal, emisiones, capa de ozono, polución, burbuja económica, consumo.
INTRODUCTION
In this paper, we are going to try to find an answer to whether the increase in capital mobility associated with the world-wide movement of liberalization, deregulation and privatization that it is referred to as the Neo-liberal global regime (NLR) has contributed to the problems of higher emissions, ozone layer destruction, and pollution of water sources. Neo-liberal practices such as those enforced in developing countries seeking to attract foreign investment to push their economies tend to generate a false aggregated demand growth, that in most cases is not sustainable in the long term, and thus high global unemployment, unleash destructive competitive processes, and weaken government's ability to regulate business in the citizens` best interests. Since all these effects are harmful to environment, it is not surprising that countries in which ordinary citizens have fared best in the past twenty years are countries that have resisted the adoption of Neo-liberal institutions and policies. Also, the forces of global Neo-liberalism are now so powerful that it has become difficult if not impossible for countries like Colombia, to maintain non-Neoliberal economic structures, in which countries are forced to deregulate FDI policies and receive inflows of capital no matter the terms and the objectives as long as it helps to maintain consumption levels in these developing economies.
How does mobility of investment capital across nations affect environmental policy then? Is there a direct relation between investment and the environment? Among economists, attention to these questions has focused primarily on the influence of capital inflows on environmental policy in recipient countries. The Standard assumption in these analyses has been that capital is “disembodied” that it is installed in the region offering the highest direct rate of return and without consideration for other channels through which the location in which capital is installed affects solely the welfare of its owners. This is a rather simplistic assumption. Capital owners are residents of one country or another: for instance, in the United States at least, nearly two thirds of corporate stocks are controlled either directly or indirectly by households. Moreover, residents are rarely compensated directly for the disutility associated with pollution from local or nearby industry. It seems logical then that investors will take into consideration any effects on the quality of their local environments when deciding where to invest their capital. A treatment of the investment/environment overlap that explicitly takes this into account is overdue.
THE CONCEPT OF CAPITAL MOBILITY
At least, in the United States and other developed economies corporate stocks are owned by households and somehow they are getting benefits and can decide whether to invest in such corporations and force them to regulate their emissions. But in developing countries, eager to accept “Flight” capitals to push their economies, what is being done? It has been found that trade openness has a positive association with education and social security expenditures, that financial openness does not constrain government outlays for social programs, and that democracy has a strong positive association with social spending, particularly on items that bolster human capital formation, but what about the environment and the direct impact openness has in it?.
There are five views that have been identified of the effects of FDI on the trajectory of the world economy. These views are labeled “The Race to the Bottom”, “The Climb to the Top”, “Neo-liberal Convergence”, “Uneven Development”, and “Much Ado about Nothing”.
According to “The Race to the Bottom” view (Bluestone and Harrison, 1982; Barnet and Cavanagh, 1994; Greider, 1997), capital will increasingly be able to play workers, communities and nations off against one another, threatening to run away if demands for tax, regulatory (environmental laws) and wage concessions are not forthcoming. In this perspective, increased capital mobility benefits corporations, while people and therefore the environment lose. A modified version of this view is that the winners in the race to the bottom will include highly educated and skilled workers, and those in privileged professions, no matter where they live. The losers will be the less skilled and the unemployed everywhere.
“The Climb to the Top” view takes the opposite position. It suggests that multinational corporations are attracted less by low wages and taxes than by highly educated workers, good infrastructure, and high levels of demand and agglomeration effects arising from the clustering of companies in a particular location. According to this view, competition for FDI will lead countries to try to provide well educated labor and high quality infrastructure in order to retain and attract foreign investment but relaxing environmental policies in most cases. Thus footloose capital and national competition for FDI will induce a global climb to the top. This climb to the top could lead to the outcome represented by “ Neo-liberal Convergence”.
This is the widely held belief that free mobility of multinational corporations, in the context of a deregulated scenario, will produce increased living standards in all countries. These processes will then transfer capital and technology from developed to developing countries, thereby raising the standards of living of those in the poorer countries at a faster rate than those in the wealthier ones, eventually generating a world wide convergence in living standards. These same processes could, however, lead to the outcome envisaged in the fourth view, “Uneven Development”, which holds that some regions of the world will grow at the expense of others. For decades the dominant version of this view was the theory of imperialism: if the South integrated itself with the North, the North would grow at the expense of the South. Now, the reverse fear holds: by forcing Northern workers to compete with cheap Southern labor, an integrated world economy will help the South grow at the expense of the North. The previous four views take for granted FDI and have a substantial effect on national economies. In contrast, the “Much Ado About Nothing” view asserts that FDI plays a rather modest role in global economics. Adherents argue that FDI is still a relatively small percentage of national income and most of it is between rich countries; thus, FDI can generate neither convergence nor a race to the bottom. Which of these views is correct? It cannot be provided a complete answer. It can be argued that foreign direct investment is neither inherently good nor bad; its effects are conditioned by the overall national and international context within which capital mobility occurs. When FDI occurs in the context of high aggregated demand and tight labor markets, effective regulatory institutions, and non-destructive competitive processes, it may indeed have a positive impact on nations and communities. If these conditions are not met, FDI can have destructive economic and political consequences on both home and host countries.
ENVIRONMENTAL ECONOMIC MODELS AND SIMULATIONS
One way to demonstrate whether capital mobility and deregulated FDI negatively affects the environment is through environmental economic models and simulations, there are various models proposed for the issue but most of them have been simulated in closed economies, but what this research is trying to achieve is how the environment in open economies is affected by production and foreign capital inflows in developing countries.
Lahiri (2007) proposes the following model, which introduces environmental considerations to standard analyses of gain and losses from international trade. This model is especially interesting because it gives a very good explanation to what the effect of capital mobility is and its effects on environmental quality in any given open economy. Standard analyses of gains and losses from international trade use the income of the nations as determinant of welfare. Evolution of environmental quality is another important component of social welfare and the present analysis adds this dimension to the outcome of international trade. Empirical studies driven primarily by cross-sectional variation have found an inverted U shaped relation between income and environmental quality, especially for local pollutants which is called the Environmental Kuznets curve (henceforth EKC). This has raised questions whether growth in income has a negative or positive impact in environmental quality. These empirical studies have not incorporated the effect of international trade and growth in any given economy.
The model investigates if the EKC relation is also a given property of open economy growth in the long run and what are the forces involved in the income-environment relation. In order to achieve this, it is considered the trading partners to be different either in environmental policy regime or in the stage of growth when they enter trade. Allowing for the standard sources of comparative advantage in the form of the two economies having different relative endowments of the internationally immobile resource only shifts the environmental-income relation but does not change the inter temporal properties derived here.
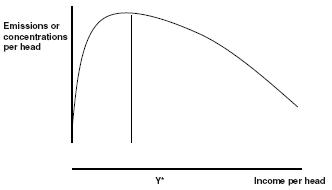
Figure 1. A Hypothetical Environmental ]Kuznets Curve
The model finds that if the environmental policy does not respond to the stronger valuation of pollution disutility as the residents get richer, then the environmental quality monotonically worsens as the income increases. So, if environmental policy becomes stricter with growth of the economy, the environmental quality first worsens and then improves as income gets better. At early stages of economic development, production grows rapidly to meet the strong investment demand under regulated and deregulated taxation regimes. The difference in shape occurs because if emission taxes are high at later stage of growth, this provides incentives to producers to reduce the emission per unit of production and move to cleaner sectors where the pollution tax payment is low. These two effects gradually start dominating the growth effect as capital accumulation slows down when the economy gets closer to a steady state. This improvement in environmental quality can be seen in the downward segment of the EKC. When the policy regime is so relaxed that emissions taxes do not increase with growth, these two pressures are absent and as a result environmental quality worsens monotonically. The model considers two economies that would have experienced an identical incomepollution trajectory with growth under autarky, and founds that in the context of international trade, the economy that enters trade at an earlier stage of growth is faced with a worse environmental outcome than the one that enters trade at a later stage in development and also experiences a better environmental quality compared to autarky. This happens because at every point in time, the poorer economy, whatever is its level of growth, values pollution less than its rich partner and it is eager to accept foreign capital that flows wherever returns are higher. Although the returns on the foreign capital are remitted abroad, the effect of the pollution remains in the poorer economy. In this case, it would be misguided for less developed countries, at any given income level, to expect environmental quality to be the same as what the developed country had enjoyed at an identical income level. The model makes it clear that the majority of the studies on EKC are empirical in nature, looking at environmental outcomes being explained by income and some other explanatory variables. The few existing theoretical studies are constrained in one or more of the following dimensions: are static in nature, do not explicitly model the environmental policy, consider a single production commodity or consider closed economies. These constrain the models from capturing one or more of the growth, intensity, composition or trade effects.
This model fills this void by allowing these effects to interact in determining the final outcome. Additionally having environmental policy as an endogenous variable in the model, it provides an instrument that may be used to influence these forces; the endogenously determined pollution tax in each country influences the overall shape of the relation as well as determines the exact levels of results. This happens because the environmental policy affects the payment to capital. This influences the desire to invest every period, and for any given period also determines the allocation of world capital stock between the two economies. So the environmental policy has both a dynamic and static role in determining the amount of capital that is accumulated and the location where it is employed, leading to the emission results. While using the inter temporal income-environment relation of one economy to make predictions for another economy, the model considers that one needs to account for the differences in structure of production, techniques of production, stage of development, nature of environmental policy and pattern of trade simultaneously, which is done in a tractable manner in this model. The model is a dynamic general equilibrium model of a developing country trading with the rest of the world. The dynamic aspect of the model allows analyzing the growth of the economies and the scale effects on environment. Traded commodities are classified into clean and dirty sectors. This allows analyzing the change in the mix in production composition as the system moves towards the steady state. In this model environmental policy is modelled as a per-unit pollution tax. Change in the pollution tax affects the per unit emission of each good. The spirit of the model is similar to the Ramsey-Cass- Koopman's Neoclassical Growth Model with an endogenous savings rate. This model uses a system of difference equations that arise from the first order conditions of inter temporal welfare maximization, and also uses analytical results and numerical simulation to track the complete time path of income and environmental conditions of the two economies. Evolution of the variables is defined as the movement from the initial conditions to the steady state along the saddle path. Change in the initial conditions, parameters of the model and the environmental tax rule translate into changes in the intertemporal paths and the relations between variables. These dimensions of the exercise provide a more comprehensive understanding of the economic reasons underlying the Environmental Kuznets Curve. It examines whether and when it is realistic for polluted economies to pin their hope on higher incomes as a solution to improve environmental quality.
Model Framework
A study by Grossman and Krueger (1991) discovered the inverted U shaped relation between income and environmental quality for local air and water pollution. This study motivated multiple empirical studies to analyze the EKC. Theoretical papers by Andreoni and Levinson (1998), John and Pecchenino (1994), Jones and Manuelli (1995), Selden and Song (1995) and Stokey (1998) have derived patterns for the transition path of pollution. They differ in the forms of the welfare function, the production functions, abatement functions and intergenerational considerations. However, none of them model the impact of international trade and of different environmental policy regimes as important influences on the change in pollution in the context of growth of an economy. Smulders et al (2005) construct a dynamic simulation EKC model. In a closed economy scenario, they distinguish subsequent phases when better technologies become exogenously available. Also, the environmental tax structure change exogenously in the different phases. These two characteristics affect the profit maximization decision of firms in choosing to adopt the new technology or to continue with the old. This is a dynamic model in which it is examined both exogenous and endogenous changes in tax policy. Also, the technique of production is determined within the model. The interaction between the two trading partners, usually absent in the EKC literature, is an important addition in the analysis. Starting with two countries that differ in capital and labour characteristics, Copeland and Taylor (1997) outline a static framework to examine the implication of trade on each country's production pattern and environmental outcomes. They allow capital to be mobile, so that a country could employ its domestically owned capital abroad. This model starts from this framework and extend it to a dynamic model so that it is suitable for analyzing the intertemporal relation between income and environment for an economy. The differences in initial relative characteristics play a weaker role in this model because in a dynamic context the endogenously determined inter temporal interest rate is the primary determinant of the capital owned by the country. The endogenously determined pollution tax in each country has both dynamic and static implications in the model. The pollution tax path determines the amount of capital that is accumulated over time, while every period it affects the location where the capital is employed and the intensity of emissions. The interaction of the intertemporal and static effects of the tax determines the final emission outcome in the model.
The classic Ramsey-Cass-Koopman (RCK) Neoclassical Growth Model with an endogenous interest rate provides the dynamic structure for this model. It simplifies the instantaneous utility function to be the log function instead of constant elasticity of substitution in the original RCK framework. However the consumption package comprises of two goods instead of the single commodity in the RCK model, while the disutility from pollution is added in the welfare function. While the original RCK model was for a closed economy, this model applies it to two country trading framework. In recent research Roe (2005) has used this framework to conduct a simulation exercise in an open economy framework in a non environmental context. He however simplifies the openness of the model by assuming a small open economy trading with the rest of the world at steady state implying constant prices. Also there is no international capital mobility. This model incorporates pollution considerations and international capital mobility in a larger country setting.
Theoretical Model
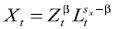
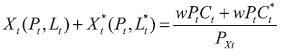
This model starts with a dynamic a general equilibrium model with two types of goods (Xt and Yt) and two inputs (Xt and Yt) all indexed by time. The consumption package is of the Cobb-Douglas form C= (Xt)ω(Yt) (1–ω). Expenditure on consumption is Et=Pxt Cxt+ CYt = PtCt where Pt is the price index of the consumption package. The every period utility is additive in consumption and pollution. It is concave in consumption Ct and linear in pollution Zt where γ is the constant marginal disutility from pollution. The inter temporal social welfare function is:
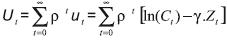 (1)
(1)
Although the disutility parameter associated with pollution is constant, the marginal valuation of disutility increases as economies get richer. This can be seen from the ratio of the marginal utilities. If is Pz,t the marginal valuation of pollution, and Pt is the marginal valuation of consumption, then
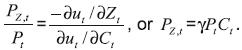 (2)
(2)
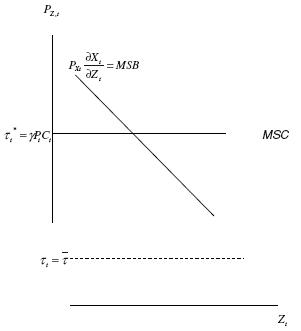
In every period the government imposes a tax {τt} per unit of emission. The emission tax is available as the instrument to maximize social welfare. Three different policy regimes are considered. First, as in the static model, the pollution tax is assumed to be set efficiently as the shadow price of pollution each period in both economies. This is more realistic for developed economies where wealthier residents, who are more aware of the cost of environmental degradation, can expect the policy making agency to reflect their concerns through stricter regulations. However for economies with fewer resources, the cost of monitoring as well as the administrative costs of changing the standards may make periodic synchronization of pollution tax with consumer demands infeasible. Hence the second pollution tax framework is such that one economy sets efficient pollution tax every period, while the other economy keeps its pollution tax fixed for the period under consideration, zero environmental taxes being a special case of this fixed-tax. This may be a more realistic institutional set up if one identifies the efficient-tax economy as the developed countries and the fixed-tax economy as the less developed countries. A third scenario considered is one where the emissions tax in one economy is rising with growth, but not sufficiently to reflect the entire marginal valuation of pollution disutility.
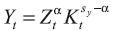
Production of each commodity uses one specific physical input, and emits pollution Z as by-product. Y uses K and X uses L as specific factors (Specific factors assumption is done for analytical simplicity. Similar results emerge when both inputs are allowed to be mobile across both sectors). K can be created and accumulated and is internationally mobile.
L is internationally immobile and also cannot be accumulated (example: land). Y is treated as the enumerative good. The production functions are decreasing returns to scale in the specific factor. The production function can also be interpreted as constant returns where a sectorally mobile third input labour or entrepreneurship has not been explicitly modelled. Y emits more pollution per unit of production relative to X. Pollution emission can be abated if some resources are diverted for this purpose. Under some specific functional forms of this abatement technology, the production and abatement relations may be combined so that pollution appears like an input for production. However, it is to be kept in mind that higher pollution is associated with a higher production level because fewer resources are diverted for abatement of the pollution.
 (3)
(3)
 (4)
(4)
α > β implying Y is more pollution intensive, sx is the degree of returns to scale in X industry, sz is the degree of returns to scale in Y industry. According to this interpretation of production and emissions, production technology is fixed and the input mix changes with changing price of the inputs. Stokey (1998), provides an alternate explanation for the production process where technology can be interpreted to be changing. All the information for the spectrum of cleanest to dirtiest technology is available. Z  [0,1] is the index of the technology actually adopted in an economy depending on the prevailing incentives. Higher values of Z indicates that a dirtier technology is adopted which yields more goods but also more pollution. As there is no uncertainty, the emissions tax for next period is taken into account when making input decisions for the next period. If is the prevailing emissions tax, then profit maximizing leads to
 (5)
(5)
Using this condition to substitute for in the production function makes production a function of and relative prices.
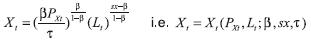 (6)
(6)
Similarly i.e. 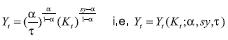 (7)
(7)
Given the prevailing market incentives, there is efficient allocation of resources in every period both for consumption and production. However, investment motives cause the sequence of static equilibrium to evolve and move towards the steady state, where there is no further desire for change. Comparison of the evolution towards the relevant steady states provides interesting insights about the environmental degradation outcomes.
Environmental outcomes under free trade
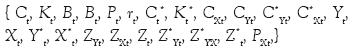
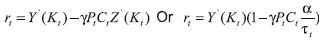
Under free trade, both goods X and Y are traded. Capital Ktaccumulates over time without any depreciation and is internationally mobile. In every period capital moves to where the returns are higher, until the returns in both economies are equalized. The second input land or labour Lt is assumed to be fixed and internationally immobile. The two economies are assumed to have identical characteristics of this fixed input. An international financial market for bonds Bt also exists and an interest rt is earned on each bond held. To focus on environmental issues, it is assumed that exchange rate equals unity and purchasing power parity is satisfied. For the two economies interacting with each other, the equations are similar in form. The foreign variables are denoted with *. The model has 23 variables:
Under free trade when the two economies are considered. So the strategy in solving this model is to identify a smaller subset of variables which are solved from the dynamic equations. Once the time path of these key variables is known, the rest of the system is solved using the static equations of the model. With free trade, the core subset of dynamic relations are the difference equations below.
 (8)
(8) (9)
(9) (10)
(10) (11)
(11) (12)
(12) (13)
(13) (14)
(14) (15)
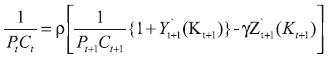
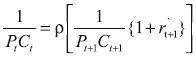
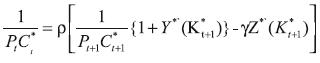
(15)Equations (8) and (9) are the budget equations of the two economies. While interpreting these equations it is important to distinguish between the stock of capital that is employed in an economy and the amount of capital that is actually owned by the economy. This discrepancy occurs because the residents of an economy may own capital which they decide to employ in a foreign country, and enjoy the returns earned on the capital in the foreign economy. The Kt and K*t in equations (8) and (9) denote the amount of capital employed in the two countries respectively. The represents flow of domestic wealth to foreign nations for purpose of consumption smoothing and investments in production both of which earns returns at the rate rt. The profits from employing capital stay with the country where it is employed, while the owners receive only the rental returns. Equation (10) and (11) are the first order conditions with respect to 1+ Kt and Bt respectively. Equations (12) and (13) are the corresponding equations for the foreign economy. These four equations together imply that the investments in capital located domestically, capital located abroad and from bondholding earn equal marginal return every period.
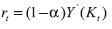
Equations (14) and (15) are the market clearing conditions for X and Y in the world market. For the X commodity, consumption demand is the only source of demand. Since Y commodity is used both for consumption and as capital, the demand has consumption demand and investment demand components. Since the individual budget conditions are being considered, one of the market clearing conditions given by equation (14) or (15) is redundant by Walras Law. So equations (8) – (15) represent 7 equations in the 7 variables 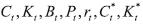 (Note that the price index Pt for the consumption package Ct is a unique transformation of
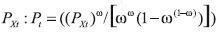
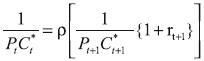
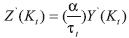
Once the time paths of these 7 variables are known, the remaining 16 variables of the system can be determined using the static equations. At the start of trade, the model assumes that capital is reallocated across economies so that the marginal return to every unit of capital employed in any country is the same. This represents the familiar jump of variables as countries relocate on the new saddle path on their journey to the new steady state. There is no cost to capital reallocation in this model. Hence the jump of a large amount of capital to the country with weaker environmental standards is an expected result and serves as a check for the model rather than as an insight. The first order conditions for optimization are solved for the steady state. The steady state is defined as a situation where all variables maintain a constant level. Then the first order conditions, which are first order difference equations, are linearized around the steady state to get an idea about the evolution of the variables. The steady state in this model exhibits saddle path stability and the stable eigenvalues define the movement of the variables along the saddle path over time. At this point, it is important to examine whether such an outcome can be sustained with decision making by private agents. The emissions tax serves the purpose of making the producers abate as long as their abatement cost is less than the per unit tax. The amount of tax collected τZt on the emission actually produced is distributed in lump sum to the consumers. Comparison of equations (10) and (11) show that from the social planner's perspective, the socially efficient payment is less than the value of marginal product of capital. This is to internalize the disutility of pollution (even at the optimal pollution level) that is being caused by employing the capital. Payment to bonds, on the other hand does not need to be discounted because it earns interest without causing any pollution disutility. Equation (10) and (11) provide the following relation.
 (16)
(16)Under the optimal pollution tax τt= γPtCt, equation (16) derived from social optimum conditions reduces to
 (17)
(17)However when taxes are not set in this optimal manner, e.g. taxes are low, i.e. τt <γPtCt then the social optimal payment to capital as captured by equation (16) should be even lower. This is because, with low emission taxes, every unit of capital is associated with a higher emission, causing a high disutility, the valuation of which should be reduced from the payment to capital to provide it with the correct incentives.
Let us examine what the payment to capital is under profit maximization; If this is different from the socially efficient payment to capital, it would mean that an additional capital tax is required for private agents in order to implement the socially optimum outcome.
Profit maximization: 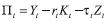
An additional unit of capital employed increases the amount of Y produced. However, the additional unit of capital also increases the profit maximizing amount of pollution emitted, which has to be paid a tax at the rate  From the profit maximizing behaviour ,
  the exact increase in pollution can be derived due to increase in capital employed.
 therefore
 (18)
(18)Equation (18) emerges from profit maximizing conditions irrespective of the pollution-tax scenario. The profit maximizing payment to capital (18) is the same as the socially optimal payment to capital under optimal pollution tax (17). Since the incentives are perfectly aligned, any additional capital tax is not required. Setting pollution taxes optimally every period in a private agent setting makes the system attain the social planner's outcome in terms of implementing the desirable amount of emissions every period, as well as providing correct incentives for capital accumulation. In the scenario of fixed pollution taxes, the profit maximizing condition given by equation (18) is unchanged.
However, the socially efficient payment to capital in the face of the resultant pollution, captured by equation (16) is now different from equation (18). With a small pollution tax τt, profit maximizing payment to capital  is greater than the socially optimal payment to capital
  Alternately, for a prevailing interest rate, the level of capital that the consumers want employed is less than what the producers wish. This happens because capital is causing more than the socially optimal pollution every period and hence capital accumulation should be discouraged. Hence either the payment to capital needs to be corrected by the use of taxation of capital, or the private economy will follow an evolution path that is different from the socially optimal path. In the static case, the tax on capital was not important because once the pollution had occurred, that was the end of the story. In the dynamic model, payment to capital is an important consideration because it determines the incentive for building future capital stock in each economy and hence future pollution and consumption. Rationalization of a fixed pollution tax in an economy as arising due to the governing institution's lack of capability in evaluating pollution disutility every period or because it wants to provide an incentive to produce for some reason other than maximizing social welfare. Hence it would be unrealistic to expect that this governing body will be able or willing to set a complicated and instantaneously changing capital tax in order to partially offset the effect of its inefficient pollution taxes. This makes it important to compare the evolution of an economy where emission taxes are efficient against one where the emission taxes are suboptimal and corresponding capital taxes are absent. So the system of equations for the economy with fixed pollution tax and no subsequent tax on capital comprises of equation (18) and not equation (16). In the social welfare maximization situation, the satisfaction of equation (18) would have ensured the satisfaction of equation (16) but not in the private agent's setup with the sub-optimal emission taxes.
The relationships shown above are more likely to hold for certain types of environmental damage, e.g., pollutants with more short-term and local impacts, rather than those with more global, indirect and long-term impacts (Arrow et al, 1995; Cole et al, 1997 and John and Pecchenino, 1994). The significant EKCs exist only for local air pollutants like SO2, SPM and NOx (Cole et al, 1997) and urban air concentrations with a peak at lower income levels than total per capita emissions (Selden and Song, 1994).
In contrast, the global environmental indicators (indirect impact) like CO2, municipal waste, energy consumption (Horvath, 1997) and traffic volumes, either increase monotonically with income or have high turning points with large standard errors (Holtz-Eakin and Selden, 1995). Several studies in this issue have attempted to estimate the influence of policy explicitly. The strong policies and institutions in the form of more secure property rights, better enforcement and effective environmental regulations can help to ‘flatten' the EKC (Panayotou, 1997). In the case of some European countries, the impact of technological change in reducing SO2 emissions is largely attributable to the installation of better end-of-pipe (EOP) abatement technology, which is in turn related to tougher environmental policy and regulation (de Bruyn and Opschoor, 1997).
As income level rises, public spending on environmental research and development also increases. These R&D spending may not directly account for greater environmental improvement but also act as a catalyst for private spending on development of cleaner technologies (Komen et al, 1997). The income of a country may be significant in determining the 'zeal and effectiveness' of its air pollution regulatory structure. A more fruitful approach to the analysis of the relationship between economic growth and environmental impact would be the examination of historical experience of individual countries, using econometrics and also qualitative historical analysis (Stern et al, 1996). Unfortunately there is not enough available data for countries in Latin America to contrast the analysis with those from developed economies or developing economies from other regions like Asia for instance. On the other hand the increasing relationship between pollution and income in Malaysia may be due to the fact that low-income states are still sources of emissions because of land conversion through burning and replanting of tree crops, while high-income states are emitting increasing emissions because of industrial and municipal wastes (Vincent, 1997). Rapid urbanization and industrialization, which are correlated with rising income in Malaysia, are responsible for the increasing concentrations of ammoniac nitrogen and PH in water, as expansion of municipal and industrial sewage treatment has lagged behind (Vincent, 1997). Several authors have attempted to explore, empirically, which structural factors are responsible for EKC behaviour. The scale and the composition of economic activity, and techniques of production (Grossman and Krueger, 1991; Vukina et al, 1999 and Xiaoli and Chatterjee, 1997), which may lend explanatory power to the observed relationships between income levels and measures of environmental impacts.
Several authors have tried to explain the downward segment of EKC in different ways. Developed countries have fairly stable production structures, whereas rapidly industrializing and developing countries have unstable production structure and the effects of structural change on emissions may be less obvious. In comparison, structural change is less important than technological innovation, represented by the change in emission intensity across sectors, in explaining declining SO2 emissions in developed countries (de Bruyn and Opschoor, 1997). Structural changes have not been a dominant factor in reduction of SO2 emissions in such countries, at least during the 1980s. The changes in production structure in developed economies are not accompanied by equivalent changes in composition of production. The solution of environmental problems associated with growth must mean more than “passing them off” to people in other places. It can be speculated that improvements in environmental quality may in reality be indicators of increased ability of consumers in wealthy nations to distance themselves from environmental degradation associated with their consumption. To extend this speculation, mechanisms for such distancing might include both moving polluting sources (flow pollutants which is emphasized by Rothman, 1998) and selected households moving away from pollution concentration (stock pollutant which is the study of Gawande et al, 2000). Considering general hypothesis of ‘distancing' as a possible source of EKC results in which internal migration plays a central explanatory role for an observed EKC for hazardous waste sides (Gawande et al, 2000 and Wang, 1998). Different social groups are differentially able to migrate away from areas with critical build-ups of hazardous waste sites; therefore a capital migration mechanism is likely to be a source of increasing environmental inequality.
Thus, capital migration is an important factor behind capital mobility and environmental degradation. A high share of manufacturing in total GDP is associated with higher levels of energy consumption. The importance of trade in combination with composition of economic activity is investigated in the decomposition of EKC for SO2 concentrations across countries (Kaufmann et al, 1998). The effect of shifts in the sector structure of economy (Panayotou, 1997) can be represented by industry's share of GDP (Dinda, 2000 and Friedl and Getzner, 2003). It should be noted that the manufacturing share in developed economies starts to decline rapidly after oil crisis. The modified EKC analysis can be used to compare the differences in EKC between countries (developed and developing specifically, as long as enough data exists) due for instance to inter-country variations in the presence of corruption.
One of the determinants of environmental policy is the socio-political regime of a particular country. Corruption and rent-seeking behaviour can influence the relationship between income and environment (Lopez and Mitra, 2000). However, for any level of per capita income, the pollution levels corresponding to corrupt behavior are always above the socially optimal level. So, the turning point of EKC takes place at income and pollution levels above those corresponding to the social optimum, which depends on the existing social institutions. Institutional changes triggered by citizens' demand for cleaner environments are more likely to occur in developed countries than in developing.
Generally, technological progress leads to greater efficiency in the use of energy and materials. Thus, a given amount of goods can be produced with successively reduced burdens on natural resources and environment. One aspect of this progress may be better and more efficient recycling of materials, which (coupled with greater efficiency in use) can yield large resource savings. As income grows, people can adopt better and efficient technology that provide cleaner environment. This preferential behaviour of people should be reflected through their income elasticity. The income elasticity of public research and development funding for environmental protection is positive (Komen et al, 1997). It is true for public expenditure on R&D for environmental protection in the case of developed countries over the period 1980–1994 (Magnani, 2000). This indicates the key role of such public investments for environmental improvements in reducing environmental degradation as income levels rise and even decreasing relationships found for some pollution indicators in developed countries. The effect of economic growth on pollution and emissions differ substantially among high-income countries. Relative income and political framework in which policy decisions are taken determine the emergence of downward sloping segment of EKC. This also depends on the adoption of new technology. New technologies, unambiguously, improve productivity but create potential dangers to the society such as new hazardous wastes (cellular phones for instance), risk and other human problems. These externalities are unknown in the early phase of diffusion of technology; in later stages regulation becomes warranted to address it. Once the technology is regulated, this may stimulate the gradual phase out of existing technology. So, a cyclical pattern arises in technologies, which first diffuse, then become regulated and finally are phased out by next generation of technologies (Smulder and Bretschger, 2000).
This implies that over a certain period during which income grows, one pollutant may decline but another may rise due to adoption of new technology. Improved technology not only significantly increases productivity in the manufacture of old products but also the development of new products. There is a growing trend among industries to reconsider their production processes and thereby take environmental consequences of production into account. This concerns not only traditional technological aspects but also the organization of production as well as the design of products. Technological changes associated with the production process that may also result in changes in the input mix of materials and fuels (Lindmark, 2002). Material substitution may be an important element of advance economics (Labys and Wadell, 1989) that may result in lower environmental impacts. The EKC approach seeks to relate the stages of economic development of a country to that of environmental degradation. Developing countries could learn from the experiences of industrialized nations, and restructure growth and development to go through (Munasinghe, 1999) any potential EKC, thereby avoiding going through the same stages of growth that involve relatively high (and even irreversible) levels of environmental harm.
CONCLUSIONS
We can conclude that during growth of an economy, whether developed or developing, a stricter environmental standard with growth of the economy is a necessary condition for the inverted-U shaped relation between increasing capital inflows, income and emissions to emerge. This is because at higher taxes in greater economic prosperity encourages profit maximizing producers to adopt cleaner technologies and at the same time provides reasons to move to cleaner sectors. Difference in trade patterns cause shifts in the inverted-U shape, but does not change the overall shape of the relation. Efficient emission taxation laws correctly reflecting the increasing disutility of emissions is a special case of the necessary condition of pollution taxes rising with capital inflows and economic growth. This efficient taxation leads to an inverted U relation between capital mobility, income improvement and pollution that is welfare maximizing for the economy. Anyhow, observing an inverted U-shape is not enough to infer efficiency of the environmental policy or the effect of capital inflows or the income environment outcomes for that economy. We cannot rely solely on higher incomes as a remedy for environmental degradation issues, whereas environmental concerns are already an important fact in developing countries agendas. When emission tax policies do not respond to consumer disutility, pollution shows no sign of decreasing at higher income levels. Which is the case in some Asian countries, sufficiently high fixed taxes may make the fixed-tax steady state outcomes consistent with the steady-state under optimal tax but this would impose an unnecessary burden at earlier stages of development when the shadow cost of pollution to those affected is relatively smaller. However, without accounting for the difference in environmental policy between developed and developing economies, it would be misguided for all to expect that environmental degradation will decline at higher income levels. Governments need to respond to consumer preference to attain the optimal outcome. In a free trade, open economy framework, and identical efficient policy regimes will not deliver identical environmental outcomes to economies that have different trade patterns like it is the case of Mexico and the USA. For two economies that begin international trade starting at different points in their growth path, the implications are very different. In absence of other sources of comparative advantage caused by difference in factor endowments, the developing economy will accept foreign capital inflows and will experience a worse environmental outcome than its developed partner. The developed economy will be able to invest its capital abroad, wherever the highest returns are available, and use them to buy dirty commodities. This result highlights the fact that predictions for individual economies using analyses based on two economies might be misleading. When Cropper and Griffiths predict that “A country with population density of 0.7 persons per hectare requires an income of $11,650 per year to achieve the same rate of deforestation” they do not consider that the timing of growth itself will have an inter temporal influence on the incomeenvironment relation which cannot be taken care by country specific fixed effects or by other explanatory variables. If the developed economy adopts a suboptimal environmental policy, then the share of capital that is invested within the developed economy is large. If the developing partner implements a more efficient environmental regime, then the developed partner may end up accepting the bigger share of world capital at a bigger environmental cost to itself. Hence the inverted-U curve of the poor foreign economy is initially above that of the rich home economy. At a later stage of growth of the world economy, the inverted-U of rich home might intersect and rise above that of the poorer foreign economy. Additional factors that affect the relationship of environmental outcomes and income are pollution disutility awareness, price changes in the sectors that the country has comparative advantage in, and the technology of production and abatement.
If an economy implements a cleaner technology, the effect might not be evident in the short horizon. With prevailing emission tax structure, the scale of production might go up to such an extent that it overwhelms the cleaner effect. In the longer horizon, the effect of the lower intensity will dominate and the economy will also be able to sustain a higher income level due to lower expenditure on abatement and a higher acceptable capital stock at home. This dynamic model can analyze the differences in scale of production, composition mix and technology used. It uncovers the environmental standards prevailing in the economy as well as effect of capital inflows (level of FDI) and international trade on environmental quality. Using these dimensions the model can predict income-environment relationship that the economy can expect to experience if the environmental policy, trade pattern or one or more of the other components change. Simultaneous movement toward lower emission intensity and cleaner sectors during a 10 year period indicates that emissions policy was becoming stricter for this time, which is a necessary condition for efficient policy as defined by this model. The composition of net imports moved toward dirtier sectors allowing a larger domestic consumption of emission intensive sectors than what is possible from domestic production. This pattern of trade also suggests that the emissions standards for the trading partners have not kept up with the emissions standards of such developed economy. A potential extension of the current model is to incorporate inter-industry as well as international knowledge spillovers resulting in increasing returns to production which allows a greater variety of commodities. A paper by Grossman and Helpman (1991) considers knowledge accumulation and investments in R&D making technology endogenous. This process produces a more sophisticated evolution of technology and could serve as a starting point of incorporating environmental considerations in trade economy growth models. Finally, the Environmental Kuznets Curve analysis is rapidly becoming the standard in technical investigations about environmental policy. Understanding the impact of capital mobility and economic growth on environmental quality is becoming increasing important as environmental concerns are making their way into main public policy agenda for developed and developing countries. The general implication of EKCs is that promoting economic growth are sufficient criteria to safeguard the environment. In the long run, the surest way to improve the environment is to become rich. But environmental policies may or may not be implemented when economy is developing. There are several points that impede a clear policy conclusion derived from the EKCs but the path for further investigation is being built.
REFERENCES
1. ANDREONI, J and LEVINSON, A., (1998). The simple analytics of the environmental Kuznets curve. Journal of public economics, 80(2): 269-286 [ Links ]
2. ARROW, KENNETH; BOLIN, BERT; COSTANZA, ROBERT; DASGUPTA, PARTHA; FOLKE, CARL; HOLLING, C. S.; JANSSON, BENGT-OWE; LEVIN, SIMON; GÖRAN-MÄLER, KARL; PERRINGS, CHARLES and PIMENTEL, DAVID. (1995). Economic growth, carrying capacity, and the environment. Ecological economics, 15(2): 91-95 [ Links ]
3. BARNET, R and CAVANAGH, J. (1994). Global dreams: imperial corporations and the new global order. New York: Simon & Schuster (Touchstone). 480p [ Links ]
4. BLUESTONE, B and HARRISON, B., 1982. The deindustrialization of America. Basic books. New York. [ Links ]
5. COLE, M.A., RAYNER, A.J., and BATES, J.M., (1997). The environmental Kuznets curve: an empirical analysis. Environment and Development Economics, 2: 401-416, Cambridge University Press. [ Links ]
6. COPELAND, B., and TAYLOR, M. (2004). Trade, Growth, and the Environment. Journal of Economic Literature, XLII (March): 7–71. [ Links ]
7. DE BRUYN, S.M. and OPSCHOOR, J.B., (1997). Developments in the throughput–income relationship: theoretical and empirical observations. Ecol. Econ, 20: 255–268 [ Links ]
8. DINDA, S. (2000). Air quality and economic growth: an empirical study. Ecological Economics, 34(3): 409-423 [ Links ]
9. FRIELD, B and GETZNER, M. (2003). Determinants of CO2 emissions in a small open economy. Ecological Economics, 45(1): 133-148 [ Links ]
10. GAWANDE, KISHORE; BOHARA, ALOK K.; BERRENS, ROBERT P., and WANG, PINGO, (2000). Internal Migration and the Environmental Kuznets Curve of US Hazardous Wastes Sites, Ecological Economics, 33: 151-166 [ Links ]
11. GREIDER, W., 1997. One world, ready or not: the manic logic of global capitalism. New York: Simon & Schuster. 528p. [ Links ]
12. GROSSMAN, G.M. and HELPMAN, E. (1991). Endogenous product cycles. The economic journal, 101 (September 1991):1214-1229 [ Links ]
13. GROSSMAN, G. M. and KRUEGER, A. B., 1991. “Environmental Impacts of a North American Free Trade Agreement”, NBER Working Paper 3914. The MIT Press, Cambridge, Massachusetts. [ Links ]
14. HOLTZ-EAKIN, D., and SELDEN, T., (1995). Stoking the fires? Co2 emissions and economic growth. Journal of public economics, 57(1): 85-101 [ Links ]
15. HORVATH, R.J., 1997. Energy consumption and the environmental Kuznets curve debate. Department of Geography, University of Sydney, Sydney NSW. [ Links ]
16. JOHN, A and PECCHENINO, R, (1994). An Overlapping Generations Model of Growth and the Environment, Economic Journal, Royal Economic Society,104(427: 1393-1410, November [ Links ]
17. JONES, LARRY E. y MANUELLI, RODOLFO E., 1995. A Positive Model of Growth and Pollution Controls, NBER Working Papers 5205, National Bureau of Economic Research, Inc. [ Links ]
18. KAUFMANN R. K.; DAVIDSDOTTIR, B.; GARNHAM, S, and PAULY, P. (1998) The determinants of atmospheric SO2 concentrations: reconsidering the environmental Kuznets curve, Ecological Economics, special issue on EKC [ Links ]
19. KOMEN, M.H.C., S. GERKING, and H. FOLMER (1997). Income and environmental R&D: empirical evidence from OECD countries. Environment and Development Economics, 2(4): 505–515 [ Links ]
20. LABYS, W.C. and WADELL, M.M. (1989). Commodity lifecycles in US materials demand. Resources policy, 15(3): 238-252 [ Links ]
21. LAHIRI, B., 2007, International Trade, Capital Mobility and the Environmental Kuznets Curve in an open economy growth model pp. 13-24. [ Links ]
22. LOPEZ, R. and MITRA, S. (2000). Corruption, pollution and the Kuznets environmental curve. Journal of Environmental Economics and Management, 40: 137-150 [ Links ]
23. MAGNANI, E. (2001). The Environmental Kuznets Curve: development path or policy result?. Environmental modeling & software, 16(2): 157-165 [ Links ]
24. MUNASINGHE, M. (1999). Is environmental degradation an inevitable consequence of economic growth: tunneling through the environmental Kuznets curve. Ecological Economis, 29(1): 89-109 [ Links ]
25. PANAYOTOU, T. (1997). Demystifying the environmental Kuznets curve: turning a black box into a policy tool. Environment and Development Economics, 2(4): 465–484 [ Links ]
26. ROTHMAN, D., (1998). Environmental Kuznets Curves–real progress or passing the buck? A case for consumptionbased approaches. Ecol. Econ, 25: 177-794 [ Links ]
27. SELDEN, THOMAS M. and SONG, DAQING, (1995). Neoclassical Growth, the J Curve for Abatement, and the Inverted U Curve for Pollution, Journal of Environmental Economics and Management, Elsevier, 29(2): 162-168 [ Links ]
28. SMULDERS, SJAK and BRETSCHGER, LUCAS. 2000. Explaining Environmental Kuznets Curves: How Pollution Induces Policy and New Technology. Tilburg University Center Working Paper No. 2000-95. [ Links ]
29. SMULDERS, SJAK; BRETSCHGER, LUCAS and EGLI, HANNES, 2005. Economic growth and the diffusion of clean technologies : explaining environmental Kuznets, Economics working paper series 05/42, CERETH - Center of Economic Research (CER-ETH) at ETH Zurich. [ Links ]
30. STERN, D.I., COMMON, M.S., and BARBIER, E.B. (1996), Economic growth and environmental degradation: the environmental Kuznets curve and sustainable development. World Development, 24: 1151–1160 [ Links ]
31. STOKEY, NANCY L.(1998). Are There Limits to Growth?. International Economic Review, 39(1): 1-31 [ Links ]
32. VINCENT, J.R. (1997). Testing for environmental Kuznets curves within a developing country. Environment and Development Economics, 2(4): 417–431 [ Links ]
33. VUKINA, T., J. C. BEGHIN and E. G. SOLAKOGLU. (1999). Transition to Markets and the Environment: Effects of the Change in the Composition of Manufacturing Output. Environment and Development Economics, 4(4): 582–598 [ Links ]
34. XIAOLI, H. and CHATTERJEE, L. (1997). Impacts of growth and structural change on CO2 emissions of developing countries. World Development, 25(3): 395-407 [ Links ]
Recibido: 25/10/2008
Aceptado: 07/05/2009
1 Este artículo es producto de la investigación sobre el impacto que el aumento en los últimos años en el intercambio comercial entre naciones, sobre todo en aquellas en vías de desarrollo, ha tenido en el medio ambiente. Esta investigación fue llevada a cabo por el grupo de investigación Trade and Environment, de la Universidad EAFIT de Medellín dirigido por la Profesora Anne Marie Zwerg y con la participación de el Centre for International Trade and Development y el College of Agricultural Engineering de la Jawaharlal Nehru Agricultural University de la India, para la UNCTAD (United Nations Conference on Trade and Development), ver:
http://vi.unctad.org/joomla/index.php?option=com_groupjive&task=member_list&groupid=4&Itemid=10
http://vi.unctad.org/joomla/index.php?option=com_groupjive&task=showgroup&groupid=33&Itemid=105

