


Services on Demand
Journal
Article
 English (pdf)
 Article in xml format
 Article references
 Send this article by e-mail
Indicators
-
 Cited by SciELO
 -
 Access statistics
Related links
-
 Cited by Google
 -
 Similars in
SciELO
Similars in
SciELO -
 Similars in Google
Share

 Permalink
Revista Ingenierías Universidad de Medellín
Print version ISSN 1692-3324On-line version ISSN 2248-4094
Rev. ing. univ. Medellín vol.11 no.20 Medellín Jan./June 2012
ARTÍCULOS
REDUCTION OF SPECKLE NOISE BY USING AN ADAPTIVE WINDOW
REDUCCIÓN DE RUIDO SPECKLE EMPLEANDO UNA VENTANA ADAPTATIVA
Jorge Quiñones*; Flavio Prieto**
* Físico. Estudiante de Maestría en Automatización Industrial, Universidad Nacional de Colombia, Sede Bogotá. Email: jaquinoness@unal.edu.co.
** Profesor del Departamento de Ingeniería Mecánica y Mecatrónica, Universidad Nacional de Colombia, Sede Bogotá. Email: faprietoo@unal.edu.co.
Recibido: 29/06/2011
Aceptado:: 25/05/2012
RESUMEN
Speckle noise is a multiplicative noise that results from random fluctuations of signals when they are reflected on a surface. This research article proposes a technique to reduce speckle noise by using classic statistical filters and a size-adaptive window. The advantage of using the mentioned window is that such filters show adequate performance at reducing noise and preserving edges. In fact, the results show that the measurement of absolute performance that can be obtained with this window is better than the best results when the window is not used. Such better performance is expressed in terms of the signal / noise ratio, the edge improvement index and the mean square error.
PALABRAS CLAVE
Speckle noise, Nonlinear filters, adaptive filter, image enhacement.
ABSTRACT
El ruido speckle es un ruido multiplicativo que resulta de las fluctuaciones aleatorias de las señales reflejadas en una superficie. En este artículo se propone una técnica de reducción de ruido speckle mediante el uso de los filtros estadísticos clásicos pero empleando una ventana de tamaño adaptativo. La ventaja de utilizar esta ventana es que los filtros tienen un adecuado desempeño en cuanto a reducción de ruido y preservación de contornos. En efecto, los resultados muestran que con esta ventana se obtiene una medida de desempeño absoluto superior a los mejores resultados cuando no se usa esta ventana. Este mejor desempeño es en términos de la relación señal a ruido, del índice de mejora de los contornos y del error cuadrático medio.
KEY WORDS
Ruido speckle, filtros no lineales, filtro adaptativo, realce de imágenes.
INTRODUCTION
In systems of image acquisition such as ultrasonic scanners (in medicine) and Synthetic Aperture Radars (in satellites), the waves dispersed by numerous elements on the surface interfere with each other in such a way that both constructive and destructive interference is produced. Due to the interference of the reflected waves, the image presents spot-like noise known as speckle. The speckle noise has the characteristics of a multiplicative and random noise where its effects are higher on areas of high intensity [1] Being the píxel (x,y) of an image corrupted by multiplicative noise n(x,y), such: g(x,y) = z(x,y)n(x,y), here, g(x,y) represents the intensity (or the magnitude) of the image's pixel, z(x,y) is the surface reflectivity and n(x,y) is the sequence of the white random noise that follows a normal distribution with a media n and a variance given by s.
There are multiple techniques to reduce the speckle noise in images; among them, the ones based on statistics are the most frequently used; the best known filters are: Lee [2], Kuan [3], Frost [4] and their modifications proposed by Lopes et al. [5] Even though those filters have a good performance at reducing noise, they also tend to degrade the image edges. Image's edge, as it is well known, is one of the most important characteristics in the analysis and interpretation of the images. In order to reduce the multiplicative noise while maintaining the quality of the image edge, the present article proposes the use of the mentioned filters but including an adaptive window, which is adjusted in each (x,y) position of the image.
For filter evaluation we used in this study synthetic images with different noise levels. Five images were produced for each level of noise, each of them contained a specific percentage of randomized multiplicative noise. As a criterion for evaluating the performance of the filters the signal to noise ratio (SNR), the edge improvement index (EEI), and the mean quadratic error (RMSE), were used. In each case five measurements were made and average values were ??reported in the results. All images with a known percentage of noise were processed using statistical filters with fixed-size windows, and with our proposal of adaptive window. We define a function of commitment that allows us to compare the results of the three criterion above. As a result we obtained that performance of filters increased by using our proposed adaptive window.
The rest of the document is organized in the following way: Section 2 shows briefly the most representative statistical filters intended to reduce the speckle noise. The size-adaptive window proposed to improve noise filtering is presented in Section 3. The following section introduces the criteria of evaluation of the filtering process. Subsequently, Section 5 presents the obtained results and then the conclusions.
1 STATISTICAL FILTERS TO REDUCE SPECKLE NOISE
Different types of filters have been presented in the literature; some of those filters adjust the pixel value according to the estimation of local statistics where the window size used is a commitment between precision of the estimation and variability of the own image. Next, the most representative statistical filters are briefly introduced.
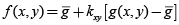
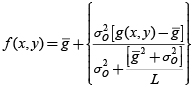
1.1 M3 filter
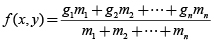
The most basic filters are: media, median and mode. The M3 filter is a hybrid between the media and the median [6], defined by  , where f(x,y) is the filter output and, therefore, the estimation of the noiseless image; and g(x,y) corresponds to the image with noise.
1.2 Lee's filter
It is one of the most used filters in the literature [2, 7-10], it uses the local statistics as the media and the standard deviation in a fixed-size window to determine the adequate weights to smoothen the image and it is given by the following equation:
 , (1)
, (1)
where  is the value of the estimated media in the neighborhood and kxy is the adaptive parameter that adjusts itself for each pixel, as
 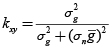 , with
  the estimation of the variance in the window of the processing of the corrupt image and sn is the standard deviation of the noise. Regarding this last parameter, there are standard values for the different types of images and it can also be used a normalized value equal to the unit. In a homogenous region, the filter's output is a linear average of the neighboring pixels; in contrast, in extremely heterogeneous regions, the output can be the same value as that of the input pixel.
1.3 Improved Lee's filter
Lee's filter was improved by Lopes et al. [5, 10], by dividing the study zone into three types of areas. The first class corresponds to homogeneous regions in which the noise can be removed by using a low-pass filter. The second class corresponds to heterogeneous regions in which the noise is reduced by preserving the texture. Finally, the third class contains isolated points where the filter needs to preserve the observed value. The improved Lee's filter is given by:
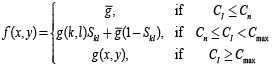 . (2)
. (2)
The function of weight Sld is given by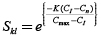 , where K is the damping factor, Cmax is the maximum coefficient of noise variation,
  and
and  , whith n the noise and I the image. The value of the damping coefficient depends on the unfiltered image and is usually adjusted by experimentation.
1.4 Kuan's filter
This filter can be considered a generalization of Lee's filter. It is based on the criteria of minimum mean quadratic error (MMSE) [3, 5, 11, 12] A first MMSE estimation is developed for a model of additive noise g = z + n. The model of the multiplicative noise is considered as follows: g(x,y) = z(x,y)+[n(x,y)–1]z(x,y). Kuan's filter is defined by:
 . (3)
. (3)
For the previous equation  , being
  the determined estimation of the variance of the original image in the neighborhood;
  is the estimation of the variance of the noiseless image and L the ratio to the square between the estimation of the media and the standard deviation of the total image. Kuan's filter becomes optimal when the scene and the detected intensities have Gaussian distribution.
1.5 Gamma filter
This filter is based in a Bayesian analysis and the statistical properties of the image [11] In order to do that, it is assumed that the radar reflectivity as the speckle noise follow a Gamma distribution. The filter is given by:
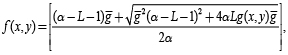 (4)
(4)
where 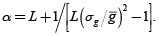
1.6 Frost's filter
It is an adaptive filter that performs a convolution of the pixel's values within a window of fixed size [4], with the exponential impulse response 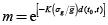 , where K is a parameter of the filter that represents its damping value, t0 = (x,y) represents the location of the processed pixel and d(t0,t) is the Euclidean distance measured from the pixel's location t = (x,y) to t0. The estimation of the pixel in t is given by:
 , (5)
, (5)
where gi are the values of the image with noise in the positions of the window of convolution and mi are the coefficients of convolution.
1.7 Improved Frost's filter
Frost's filter was modified and improved by Lopes et al. [5, 10] The improved model uses 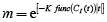 , where func(CI(t)) is a hyperbolic function of CI(t), defined as:
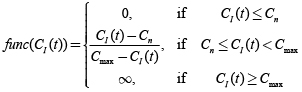 .
.
1.8 Oddy's filter
It is a filter of mean whose window shape varies according to the local statistics [11] The evaluation is done locally on a window of vicinity 3 x 3 where it is obtained: 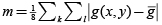 . The filter is defined as:
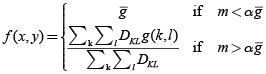 , (6)
, (6)
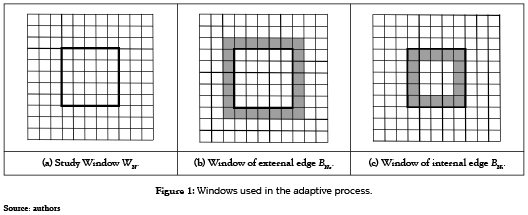
where α is the filter's parameter and D plays a role of adaptive binary mask that it is applied on the window, being DKL = 1 if  or DKL = 0 otherwise. In order to use Oddy's filter with windows greater than 3 x 3, m is modified as
 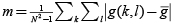 , where N is the window size.
2 ADAPTIVE WINDOW ON THE FILTERED PROCESS
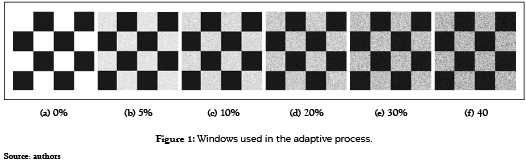
In the presented filters, the window size plays an important role. In homogeneous zones, large windows allow precise estimations with a high number of samples; nevertheless, in heterogeneous zones, the use of large windows gathers different statistical properties of the image which are not useful for processing the pixel object of the present study. This study proposes the improvement of the performance of the classic statistical filters by means of an adaptive window. The size of such window is determined evaluating the likeliness among pixels in the current window region WN(x,y), of size N x N and centered in the pixel(x,y); and the pixels in the region of its external perimeter BNe or internal perimeter BNi (see figure 1). The external and internal edge is noted by BN.
The filtering process is carried out in standard way by checking rows and columns in the image. The adaptive process modifies the window size that frames the area on which the filter is applied for each position. The window size allowed varies between 3 x 3 and 11 x 11. If the pixel on position (x,y) was filtered with a WN, for the pixel in position (x + 1,y) the algorithm evaluates the similarity between WN and BNe, if they are similar, the window size increases by 2 (WN = WN+2), and it filters with this new window and it moves on to the next position. If the pixels are not similar, the algorithm evaluates the similarity between WN and BNi, if this new comparison meets the condition of similarity, the filtering is carried out with the current (WN) window and the window moves to the next position; otherwise, the window reduces its size by 2 (WN = WN–2), and it filters with the new (WN) window and it moves to the next position where again it verifies the similarity condition. In the beginning of the filtering process, the (WN) window starts with the minimum size, that is, a 3 x 3 window size. Being an adaptive window, the padding on the frontiers of the image is also adaptive and it is adjusted to the window existing at that moment.
To evaluate the similarity of the regions WN and BN we use the invariant moments of Hu [13] Being hi with I = 1,2,...,7 each of the Hu moments. The similarity between regions WN and BN, is determined by comparing the seven moments as:
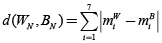 , (7)
, (7)
where  and
and  , the W and B super-indexes make reference to the region of the current window and its perimetrical region. We say that WN and BN are similar if d(WN,BN) 0.1. The 0.1 value is a threshold determined experimentally with the support of the performance function introduced in Section 5.3 by evaluating the selected threshold versus the filter's performance.
3 EVALUATION CRITERIA
There are several quantitative measurements to evaluate the performance of the speckle noise filters as function of different criteria such as: noise reduction, edge preservation, preservation of certain features and execution time [14-15] Multiple measurements have been reported in the literature, such as: signal to noise ratio (SNR), the equivalent number of simple views (ENL), speckle suppression index (SSI), measurement preservation index and speckle noise suppression (SMPI), edge improvement index (EEI), edge preservation index (EPI), image detail preservation coefficient (IDPC), quality factor (Q), mean quadratic error (RMSE), etc [15] Since the improvement of the image quality is the objective of the adaptive filtering, and such objective needs to be achieved without degrading significantly the edges, the performance evaluation of the filters was carried out using three measurements that are not correlated with each other: signal to noise ratio (SNR); the edge improvement index (EEI) and the mean quadratic error (RMSE).
The signal to noise ratio is defined as the quotient resulting from dividing the mean digital levels of the filtered image f by its standard deviation σf. The measurement is given by SNR = f/σf. In the practice, the measurements are estimated locally within a window of finite size. A greater value of SNR indicates that the filter has better performance.
The edge improvement index is a measurement of the ability the filters have to preserve the edges and it is defined as: EEI = σ|f(a)–f(b)|/σ|g(a)–g(b)|, where f(a) and f(b) are values of the pixles on each side of the shape in the filtered image and g(a) and g(b) the values of the image without any filtering. EEI values are close to 1 and higher values indicate better capacity to preserve the edges.
The mean quadratic error which is defined by 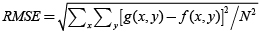 , is a statistical measurement of the deviations of an estimator regarding the true value.
4 RESULTS
As it is done normally at evaluating filters, this work uses synthetic images with different levels of noise. The images were created with five levels of multiplicative noise: 5%, 10%, 20%, 30% and 40%. These images were processed with filters presented in Section 2. Subsequently, the performance of the filters was evaluated by using the proposed adaptive window. Adaptive windows were used with size N x N, with N = 3, 5, 7, 9 y 11. As image, a chess board was selected. Figure 2 shows the noiseless image used and the image with different levels of noise.
4.1 Filters Performance
As it was metioned, three measurements were selected initially to analyze the performance of the filters: SNR, EEI and RMSE. These measurements were analyzed for a 7 x 7 window and for the image with two levels of noise. Results are presented in
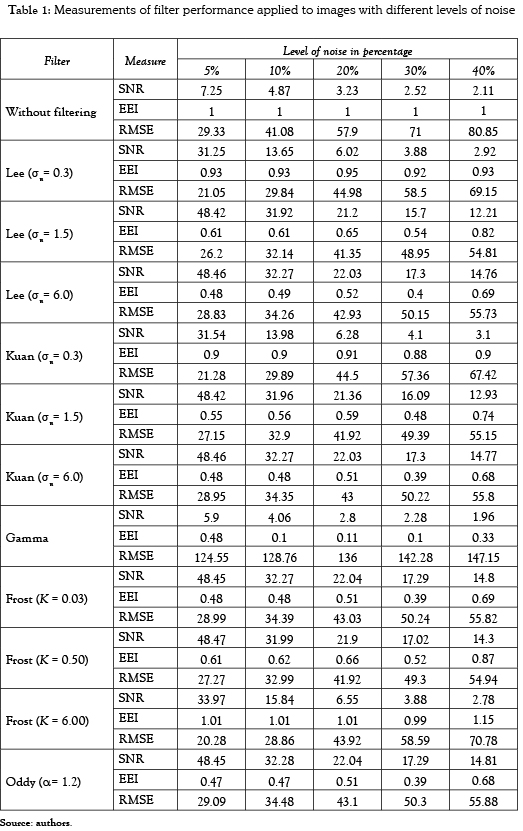
The previous table shows that the filters with better performance are Lee's filter (σn= 6.0) and Frost's filter (K = 0.03). This result matches what was reported in [11] The effect of using the proposed adaptive window was evaluated with these filters.
4.2 Window size effect
The behavior of the SNR against the noise percentage when the window size changes is shown in Figure 3. It is evident the effect the window size has on the filter's performance. In fact, it is observed that when increasing the window size, the SNR ration improves notoriously; the best values of SNR were obtained for N =11. Similarly, it is observed in Figure 3 that filters performance diminish when increasing the noise percentage. That is, the filter's performance falls significantly when the image noise increases. In Figure 3 and in the following figures, N represents the window size. The results of the filtering process by using the adaptive window proposed in this work are presented as an empty square labeled as ''Ad''.
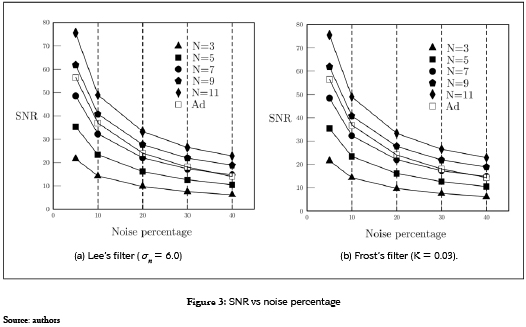
Even though the performance of the adaptive filter is not the best, regarding the SNR measurement, in general it has a performance higher than 60% above than that obtained with an 11 x 11 window.
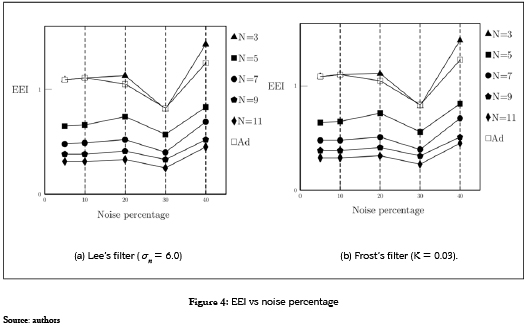
On the other hand, the edge improvement index EEI is inversely proportional to the window size (see Figure 4). The best values of the EEI index were found for windows N = 3. EEI value increases with the increase of the image noise percentage. For this latter index, the performance of the adaptive filter is above 80% and, in general, it is very close to the performance achieved with a 3 x 3 window.
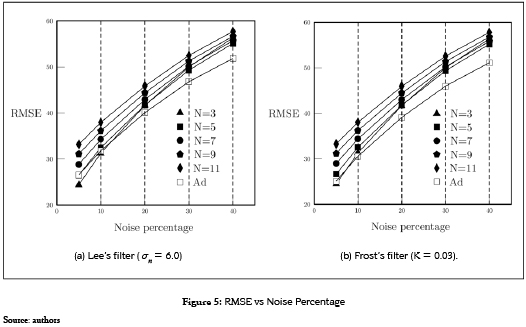
As per the quadratic error mean, this value increases with the increase of the window size (see Figure 5). For all the percentages of noise, the smaller value of RMSE are obtained when a window N = 3 or a N = 5 is used. In this case the filtered image was compared to the synthetic one and it was observed that when increasing the noise percentage the RMSE value also increases. In this latter case, the use of an adaptive filter obtains RMSE values higher than 80% which is one of the best in some cases.
4.3 Quantitative performance of the adaptive filtering
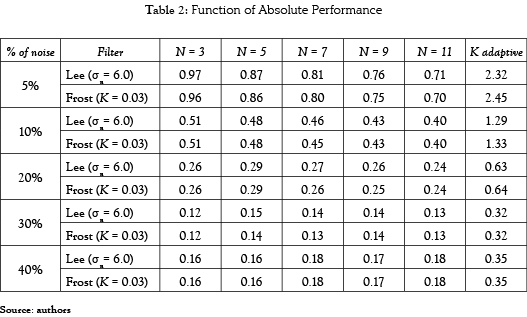
Since the indexes that measure the performance of the filters are inverse, some values need to he high (SNR and EEI) and the other small (RMSE); we define a function of absolute performance such as DF = SNR x EEI/RMSE. This measurement indicates better performance when it is high. Table 2 shows the results obtained with this index. It is observed that for both Lee's and Frost's filters and for all noise levels, the absolute performance function is greater when it uses an adaptive window.
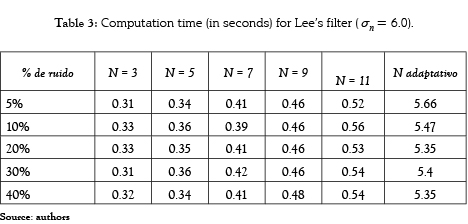
Even though the absolute performance of the filtering with adaptive window is twice and sometimes thrice as better as that of the classic statistical filters, the cost of this better performance is the computation time. In fact, due to the adjustment of the window on each position, this adjustment increases as shown in Table 3. It should be noticed that the testing was carried out on an equipment Intel(R) Pentium(R) Dual CPU T2390 @ 1.86GHz, with 2,5 GB of RAM memory. The algorithms are implemented in C++, using the OpenCv library on an Ubuntu platform.
5 CONCLUSIONS
A technique to improve the performance of filters to reduce statistical speckle noise without degrading the edges significantly was presented. The technique uses a window of adaptive size which is based on the comparison of the current window to its internal and external perimeters.
A function for absolute performance was defined which allowed to assess the behavior of the selected filters: Lee (σn= 6.0) and Frost (K = 0.03). This function showed that the use of an adaptive window increases the performance of the filters, that is, it reduces the noise without significant edge degradation.
Although the proposed adaptive window improves the performance, it also increases the computation time up to an order of magnitude. As future work, a non-sequential technique –a parallel technique– is proposed by using a GPU.
REFERENCES
[1] Z. Shi and K.B. Fung. ''A comparison of digital speckle filters''. Proceedings of Geoscience and Remote Sensing Symposium, 1994. IGARSS '94. Pasadena, CA , USA. vol. 4, 8-12 Aug. 1994, pp. 2129-2133. [ Links ]
[2] J.S. Lee. ''Speckle analysis and smoothing of synthetic aperture radar images''. Computer Graphics and Image Processing. vol. 17, no. 1, September 1981, pp. 24-32. [ Links ]
[3] D.T. Kuan, et al., ''Adaptive noise smoothung filter for images with signal dependent noise''. IEEE Transactions on Pattern Analysis and Machine Intelligence. vol. PAMI-7, no. 2, March 1985, pp. 165-177. [ Links ]
[4] V.S. Frost, et al., ''A Model for Radar Images and Its Application to Adaptive Digital Filtering of Multiplicative Noise''. IEEE Transactions on Pattern Analysis and Machine Intelligence. vol. PAMI-4, no. 2, March 1982, pp. 157-166. [ Links ]
[5] A. Lopes, et al., ''Adaptive speckle filters and scene heterogeneity''. IEEE Transactions on Geoscience and Remote Sensing. vol. 28, No. 6, November 1990, pp. 992-1000. [ Links ]
[6] K. Thangavel, et al., ''Removal of speckle noise from ultrasound medical image based on spacial filters: comparative study''. ICGST-GVIP Journal. vol. 9, No. 3, June 2009, pp. 25-32. [ Links ]
[7] J.S. Lee. ''A simple speckle smoothing algorithm for synthetic aperture radar images''. IEEE Transactions on Systems, Man and Cybernetics. vol. 13, no. 1, 1983, pp. 85-89. [ Links ]
[8] J.S. Lee. ''Speckle suppression and analysis for synthetic aperture radar images''. Optical Engineering. vol. 25, May 1986, pp. 636-643. [ Links ]
[9] G.D. Bermúdez, et al., ''Estudio comparativo de algoritmos para la reducción del speckle en imágenes SAR''. XXI Simposio Nacional de la Unión Científica Internacional de Radio. Libro de Actas- URSI 2006. pp. 618-621. [ Links ]
[10] J.P. Ristau and W.M. Moon. ''Adaptive filtering of random noise in 2-D geophysical data''. Geophysics. vol. 66, no. 1, January-February 2001, pp. 342- 249. [ Links ]
[11] L. Gagnon and A. Jouan. ''Speckle Filtering of SAR images-A Comparative Study Between Complex-Wavelet-Based and Standard Filters''. In Proc. SPIE #3169. San Diego, 1997, pp. 80-91. [ Links ]
[12] D.T. Kuan, et al., ''Adaptative restoration of images with speckle''. IEEE Transactions on Acoustics Speech and Signal Processing. vol. 35, no. 3, March 1987, pp. 373-383. [ Links ]
[13] S.O. Belkasim, et al., ''Pattern recognition with moment invariants: A comparative study and new results''. Pattern Recognition. vol. 24, no. 12, December 1991, pp. 1117-1138. [ Links ]
[14] A. Shamsoddini and J.C. Trinder. ''Image texture preservation in speckle noise suppression''. In: Wagner W., Székely, B. (eds.): ISPRS TC VII Symposium – 100 Years ISPRS, Vienna, Austria, July 5–7, 2010, IAPRS, Vol. XXXVIII, Part 7A. pp. 239-244. [ Links ]
[15] R. García, et al., ''Análisis del comportamiento de filtros de reducción de speckle en imágenes ER2-SAR''. Teledetección y Desarrollo Regional. X Congreso de Teledetección. Cáceres, España, 2003, pp. 325-328. [ Links ]

