


 Inglês (pdf)
 Artigo em XML
 Referências do artigo
 Enviar este artigo por email
 Citado por SciELO
  Citado por Google
  Similares em
SciELO
Similares em
SciELO  Similares em Google
 Permalink
INTRODUCTION
Food production and water are inextricably linked. Water has always been the main factor limiting crop production in many regions of the world, where rainfall is insuffi cient to meet crop demand 1 and relying on a network of several scientific institutions, FAO has packaged a set of tools in this Irrigation and Drainage Paper to better appraise and enhance crop yield response to water. These tools provide the means to sharpen assessment and management capacities required to: compare the result of several water allocations plans: improve soil-moisture control-practices under rainfed condi tions; optimize irrigation scheduling (either full, deficit or supplementary. Therefore, irrigation has been crucial for improving crop production in those dry areas. 40 % of global food production comes from the 20 % of irrigated areas 2.
However, in agricultural fields there are three principal problems that may arise due to delivered water quality 3: a) salinity hazard, causing osmotic pressure rises in the soil solution, and thus, it reduces water availability; b) sodicity hazard, resulting in a breakdown of soil aggregates responsible for good soil structure, which is needed for free water and air movement through the soils; and c) toxicity hazard, that affects some crops due to high concentrations of specific ions such as sodium, chloride, boron, carbonates, and molybdenum 4.
Soil salinisation is inconvenient at farmlands since the total amount of salts in water is such that the salts accumulate in the root zone to the extent that crop yields are adversely affected 4. That’s why the U.S. Salinity Laboratory Staff 5 developed an indirect -and wide spread- method of determining the salt content of irrigation water by measuring its electrical conductivity (ec). The higher the salinity contents in irrigation water, the higher its salinity hazard for the crops - that is if the soil and climatic conditions, and cultural practices remain the same, as they may promote accumulation of soluble salts in the root zone 4.
On the other hand, assessing the hazard is “to predict” the occurrence of the phe nomenon based on the study of its generating mechanism, and monitoring the process over time. Likewise, the assessment can be improved by mapping the different levels of threats, which is the major input in the physical and territorial planning 6.
Irrigated areas show the highest salinity process in soil 7-10, thus, a tool is needed for managing the soil salinity hazard due to water quality, especially in flat and dry areas. Besides, with the ever-increasing competition for finite water resources and the steadily rising demand for agricultural commodities, the call to improve the efficiency and productivity of water use for crop production, to ensure future food security and address the uncertainties associated with climate change, has never been more urgentand relying on a network of several scientific institutions, FAO has packaged a set of tools in this Irrigation and Drainage Paper to better appraise and enhance crop yield response to water. These tools provide the means to sharpen assessment and mana gement capacities required to: compare the result of several water allocations plans: improve soil-moisture control-practices under rainfed conditions; optimize irrigation scheduling (either full, deficit or supplementary.
Hence, this study aimed to develop a methodology -in the risk management framework-for assessing the soil salinity hazard and its mapping over an irrigation district located in a dry region of Colombia
1. MATERIALS AND METHODS
1.1. Methodologicalapproach
The methodological approach assesses and maps the soil salinity hazard originating from the delivered water for irrigating flat-dry regions of Colombia. This threat is a component of risk management theory (R= Hazard [H] x Vulnerability [V]) 11 practitioners and the public. The previous version \u201cTerminology: Basic terms of disaster risk reduction\u201d was published in \u201cLiving with risk: a global review of disaster risk reduction initiatives\u201d in 2004. The following year, the Hyogo Framework for Action 2005-2015 requested the UNISDR to \u201cupdate and widely disseminate international standard terminology related to disaster risk reduction, at least in all official United Nations languages, for use in programme and institutions development, operations, research, training curricula and public information pro grammes\u201d. The 2009 version is the result of a process of ongoing review by the UNISDR and consultations with a broad range of experts and practitioners in various international venues, regional discussions and national settings. The terms are now defined by a single sentence. The comments paragraph associated with each term is not part of the definition, but is provided to give additional context, qualification and explanation. It should be noted that the terms are not necessarily mutually exclusive, and in some cases may have overlapping meanings. The Terminology has been revi sed to include words that are central to the contemporary understanding and evolving practice of disaster risk reduction but exclude words that have a common dictionary usage. Also included are a number of emerging new concepts that are not in widespread use but are of growing professional relevance; these terms are marked with a star (*. Vulnerability assessment, relationship between internal and external factors in soil, will not be considered in this paper. The next four guidelines describe the steps that must be followed in order to successfully achieve the methodological approach:
1.1.1. Step 1. Delimitation of irrigated areas and location of sampling points
Each irrigated area must be defined according to both water source and water quali ty. Thereby, key spots as catchment, agricultural runoff and sewage dumping points must be identified over the irrigation-network scheme of the irrigation district, which contains main, secondary and tertiary hydraulic distribution. Once these zones are defined, three sampling points must be selected at least -at the beginning, middle, and end- over the main canal of each irrigated area.
1.1.2. Step 2. Waterqualitycharacterization
Major parameters such as electrical conductivity (ECw), pH, cations (Ca2+, Mg2+, Na+, K+), anions (HCO3- or CO3=, Cl, SO4= and NO3-) must be determined for each sampling point, following standard procedures from the American Public Health Association 12. The sampling campaign must consider changes in weather (e.g. raining and dry season). Thus, the recommended minimum numbers per year are two. However, we should keep in mind that more sampling campaigns per season result in better unders tanding of such threat over time.
1.1.3. Step 3. Salinityhazardassessment
Cations and anions should feed in Solsariego model, which is a procedure to predict salinity and sodicity levels of soil, assessing the irrigation water quality. The computed quality indexes are the amount of required amendment and the leaching fraction values 13. However, Solsariego only predicts salt contents in the water samples (e.g. Table 6).
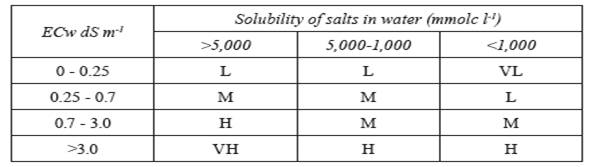
The qualitative assessment of salinity hazard (very high [vh], high [h], medium [m], low [l], very low [vl]) may be obtained from matching classes of ECw and solubility of salts in water (Table 1). ECw column shows four groups 5. On the other hand, the solubility columns illustrate the salt concentration values in three ranges.
1.1.4. Step 4. Hazardmapping
Each sampling point holds an influence area, which should be drawn on the irrigation scheme using cad software, and then converted into a shapefile or feature-class file (vector data). Next, a database should be complied by adding features as location of measuring point, water quality, and qualitative assessment in each polygon. As a re sult, soil salinity hazard due to water quality may be mapped using the Geographic information system (gis) tool.
1.2. Case Study: The rut Irrigation District
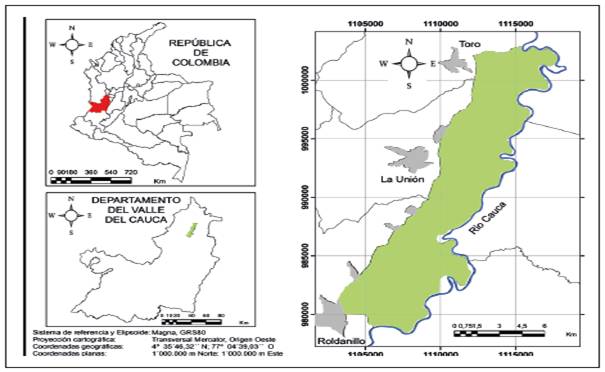
The study was carried out in the influence area of the Roldanillo-Unión-Toro (rut) Irri gation District located north of the Valle del Cauca Department, in southwest Colombia. The rut Irrigation District lies on the flat zone (approx. 10,200 ha) of rut watershed, and it limits to the north with the Cauca river -Toro Municipality-, east with the left bank of the Cauca river, south with the Cauca river -Roldanillo Municipality-, and west side with the right hillside of the western range mountain of Colombia (Figure 1). Altitude varies between 915 and 980 m.a.s.l. Relieve is slightly sloped (3-7 %). The average annual rainfall is 1,074 mm and average annual ETo is 1,510 mm. The predo minant soil order is alluvial clay, and predominant taxonomic orders are inceptisols, vertisols and mollisols. Natural drainage ranges between slow and moderate, given the heavy texture of the soils 14.
In general terms, the irrigation system is a flood protection and irrigation/drainage scheme. The long and narrow bowl-shaped area is surrounded by a protection dike that runs along the east border of the Cauca River and a flood interceptor canal on the west side. A main drain divides the area almost in half, running through the lowest elevations 15-16.
The main source of water is the Cauca River, whose water has to be pumped up to the main irrigation canal, passing by secondary and tertiary canals towards farms. The flood interceptor canal also acts as an irrigation canal for the water users who use small centrifugal pumps to serve their individual needs. Likewise, there is a network of drainage canals interconnected to the main drain, whose water flows from south to north across the Irrigation District and discharges into the Cauca River.
Despite the fact that The rut Irrigation District is one of the most important irrigation systems in Colombia, since it holds excellent characteristics (climate, soils, water, and strategic geographical location) for developing agriculture 16; nowadays, the district shows a growing crisis due to a combination of administrative, technical and environmental factors. For instance, the spoilt state of physical infrastructure, change in cropping pattern (sugarcane monoculture), and inexistent irrigation and cropping scheduling. We also highlight the inefficiencies in water management, such as the irrigation with water coming from the main drain, which contains a mixture of drainage water plus fertilizer and pesticides, and the interceptor canal is polluted with domestic wastewater from surrounding municipalities.
1.2.1 Step 1. Location of sampling points and their influence areas
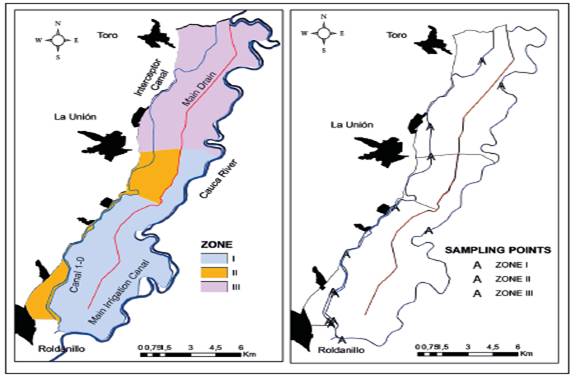
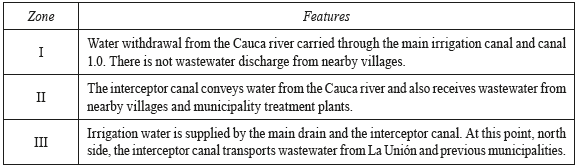
Several workshops and fieldwork were held along with stakeholders in order to identify key irrigated zones. After that, three zones were arranged to evaluate water quality (Figure 2). Table 2 illustrates general features of eachzone.
1.2.2. Step 2. Waterqualitycharacterization
A grab-sample technique with two successive repetitions of sampling was taken between 8:00 and 16:00 hours (matching with the irrigation schedule, from 6:00 to 18:00) for each of the 13 selected sampling points. Three-sampling campaigns were held (Sept ember 2013, January 2014 and July 2014), corresponding to dry season in the region.
Statistical Analysis: Two statistical models for water data analysis were employed for testing differences among each irrigated zone (I, II, III) over time (Sep. 2013, Jan. 2014, Jul. 2014) and for comparing means of the irrigation zones (I, II, III).
One-way anova was performed when the independence, normality (Shapiro- Wilk test) and homogeneity of the variances (Levene test) were verified. Otherwise, nonparametric tests (Kruskal-Wallis) were used in the analysis. Post hoc tests were performed, Tukey-b for anova and pairwise comparison for nonparametric test. ibm® spss® Statistics 20 software was used in the analytical process.
1.2.3. Steps 3 & 4. Hazard assessment of salinization and hazard mapping
Salinity hazard was classified using table 1, as proposed in step 3 of the methodolo gical approach. Then, hazard classes were mapped along The rut Irrigation District following step 4 of the methodological approach- by employing Autocad 10 and ArcGIS 10.3.
2. RESULTS AND DISCUSSIONS
2.1. Waterqualitycharacterization (Step 2)
As shown in table 3, concentration values meet Colombian standards (pH 6.5-9.0; ECw 1 dS m-1; Ca 60 mg l-1; Mg 36 mg l-1; total alkalinity as CaCO3 200 mg l-1; Cl 250 mg l-1; SO4 250 mg l-1) present in resolution 2115 of 2007 from the Health and Environmental Ministries of Colombia, for drinking purpose as well as permissible limits (ECw 0.7 dS m-1, Na 69 mg l-1, 78 mg l-1) of the Food and Agriculture Organization of the United Nations (FAO) guidelines for agricultural-water quality 3. However, comparing them to a previous surface-water assessment study in the rut Irrigation District 17, there exists a pronounced tendency toward increasing ion concentrations, which point out a forthcoming salinization process in the region.
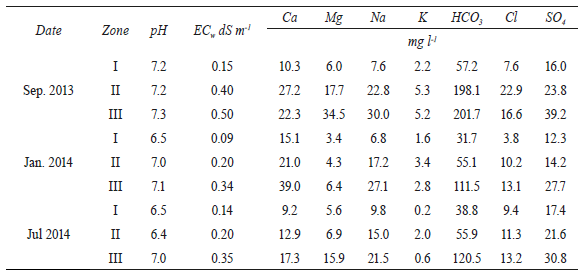
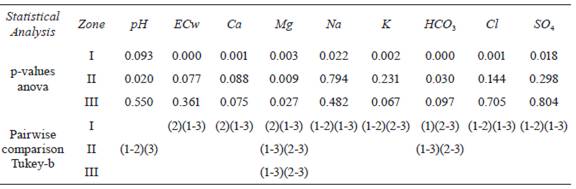
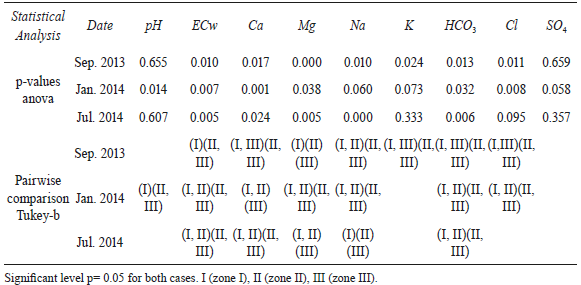
Table 4 shows that excepting pH, most of the parameters present differences over time in zone I. Zone II showed differences only in pH, Mg and HCO3 values. Zone III had changes only in Mg concentrations over time. On the other hand, comparing irrigation zones at each sampling campaign, statistical differences were found in ECw, Ca, Mg, Na and HCO3 (Table 5), whereas, Cl evidenced variances in two sampling periods, pH and K in only one. No significant difference among ZI, ZII and ZIII was found for SO4. In the meantime, post-hoc tests indicate a strong difference between ZI and ZII in most of the parameters tested.
At last, as expected, there are differences amongst ZI, ZII, and ZIII and these are constant over time. The irrigation zone arrangement took into account water features throughout the rut Irrigation District and sampling campaigns were held in dry season.
2.2. Salinizationhazardassessment (Step 3)
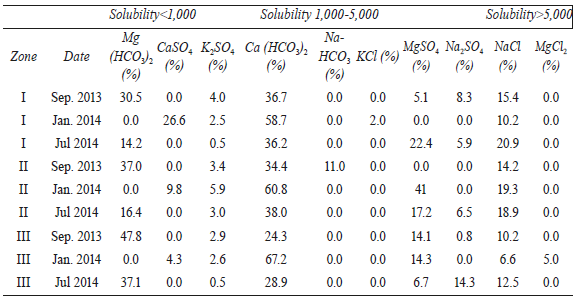
In general terms, water composition presents salt contents as follows: Ca (HCO3)2 (low solubility), Mg (HCO3)2 (very low), NaCl (high) and MgSO4 (medium) (Table 6).
The zone 1 classed low salinity hazard for all sampling campaigns (Table 7). Mean while zone 2 fell into medium class at Sep. 2013 campaign and low at Jan. 2014 and Jul. 2014 Zone III classified low at Sep. 2013 and medium at the other two campaigns. According to these results, and as found in statistical analysis, there is a pronounced difference between ZI and ZIII.
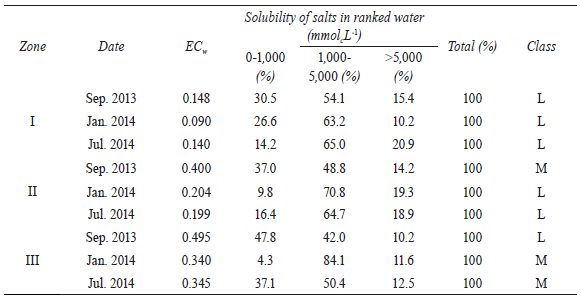
ZII keeps similar ranks of solubility among sampling campaigns (Table 7), but ECw value for Sep. 2013 fell in a different class (Table 1), thus its classification was higher than the other seasons. On the contrary, salt contents in ZIII classed low (Table 1) in Sep. 2013 due to low value for salt solubility.
2.3. Hazardmapping (Step 4)
Given the hazard mapping for each tested season (Figure 3), here is a pattern of greater qualification (medium) on the northern side of the rut Irrigation District. As described in Table 1, the interceptor canal transports wastewater that originates in Roldanillo, La Unión and Toro Municipalities; whereas the main drain conveys water with high concentrations of fertilizer and pesticides.
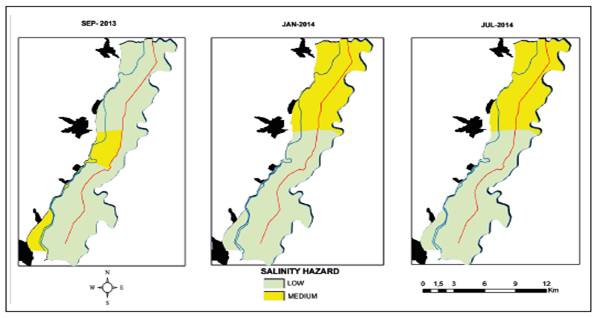
In general terms, proposals such as setting a water treatment process, employing another water resource or canceling the irrigation activity might control the soil salinity hazard (ECw and salt contents) in the rut Irrigation District. Nonetheless, these solu tions are unfeasible due to their high operational cost. Thus, we would like to propose alternatives that may be more suitable for Colombian circumstances. The southern zone of the rut Irrigation District (I and II) shows low salinity hazard, therefore, main activities must focus on improving efficiencies of the irrigation methods and hydrau lic distribution, as well as adopting a tight irrigation schedule based on climate, soil moisture and crop water needs. In the case of the northern area of the Irrigation Dis trict (Zone III), apart from the above-mentioned activities, irrigation with water frommain drain must be prevented and water resources as the Cauca River or shallow/deep wells should be developed. In addition, growing crops with low water requirements or medium tolerant crops may be suitable solutions. However, these proposals are partial options as we are facing only hazard. Considerations for addressing the vulnerability component must be considered as well.
3. CONCLUSIONS
We consider the methodological approach based on water quality assessment (ECw and prediction of salt contents in water) is a helpful tool for decision makers in irrigation districts in flat and dry regions of Colombia, since they can address resource investments in a specific way, according to the hazard levels and their locations. In other words, this proposal may be extended to irrigation districts with similar characteristics. However, the results are partial since it is important to consider, not only one component of the risk management, but also the vulnerability, and its intrinsic and extrinsic factors related to irrigation water quality (hazard).
Concerning the study case, through the methodological approach two hazard zones, low and medium level, were identified, as well as their sources. In the first zone, low-level hazard is caused by the type of salts; whereas in the second zone, medium-level hazard is due to the combination effect from ECw and the type of salts. Thus, activities for facing hazard would be specific for each area.

