


 Inglês (pdf)
 Artigo em XML
 Referências do artigo
 Enviar este artigo por email
 Citado por SciELO
  Citado por Google
  Similares em
SciELO
Similares em
SciELO  Similares em Google
 Permalink
INTRODUCTION
Evolutionary strategies belong to nature-based models for stochastic optimization, namely Evolutionary Computation (EC). EC is an effective method for solving many difficult optimization problems. However, when handling with large scale and complex tasks computation time can be considerable. EC generally entails large computational costs because it usually evaluates all solution candidates in a population for every generation 1.
Nature-inspired operations, such as selection, reproduction, and replacement, are used to explore a specific solution space to evolve the population toward the best solu tion automatically (2). The nature of EC algorithms, such as ES, is inherently parallel since population members are typically subjected to the same operations. But parallel computing facilities were not widely available and affordable in the past, so the major ity of existing EC-based solutions were designed and implemented in a sequential way.
Since during the past two decades hardware availability was limited, parallel processing such as cluster computing was applied in order to reduce overall comput ing time in EC models. One of the main focuses of research in parallel evolutionary computation is the parallelization of one or more of the typical steps of an EC solution, such as the design of a parallel fitness function, parallel estimation of individual fitness function, and individual generation in parallel. A parallel fitness function evaluator reduces computing time because the calculation of fitness function is the most time consuming part of EC solutions. To parallelize the fitness function estimation between individuals is possible because computation for each individual is independent from the others. In a similar way, the crossover, mutation, and selection schemes can be ap plied in a parallel way to an initial set of individuals in order to process a generation.
In 3, three methods are described for the parallel implementation of a specific model of EC, namely Genetic Algorithms (GA). Since the main difference between GA and es is related to individual encoding, the three methods can be extended to ES; these are the master slave model, the coarse grained model and the fine grained model, where individuals run on different processors at the same time, which allows for a fast calculation of the fitness function, but requires specialized hardware with many cores to efficiently take advantage of the model. The great level of parallelism of this model made it suitable for SIMD (single instruction, multiple data) systems 4 like CUDA 5. Additionally, hybrid models can be used to maximize the parallel facilities for problem solving.
CUDA is the hardware and software architecture that enables NVIDIA GPUS to execute program calls in parallel kernels. The natural parallelism of computation on GPUs is expressed by a few compiler directives added to the C programming lan guage 6 University of Tennessee and Oak Ridge National Laboratory CUDA is a computing architecture designed to facilitate the development of parallel programs. In conjunction with a comprehensive software platform, the CUDA Architecture enables programmers to draw on the immense power of graphics processing units (GPUs. An important consideration in software development on the CUDA architecture is related to the correct use of multiple memory levels in order to reduce latency on data ac cess. Specific hardware capabilities must also be considered, since each device type has different configurations like sm quantity, amount of memory, maximum thread number by sp, maximum grid and block dimension capability, threads grouping for execution or wraps, and control divergence 6)-(7 that must be taken into account for correct algorithm execution.
Some research in the EC parallel model design using CUDA is presented in 8; where CUDA was used on a G80 GPU to efficiently interpret several gp programs in parallel obtaining speedups ranging from 8x to 80x. Many techniques have been proposed in different knowledge areas like medical image processing 9. We are interested in the area for diabetic retinopathy detection.
Diabetic retinopathy is a progressive disease, its diagnosis is based on some clinical abnormalities which are difficult to detect because it is asymptomatic until advanced stages of disease development 10. Without adequate treatment, it can evolve into a more complicated condition called Macular Edema 11. Typically, the procedures used for retinal analysis include the identification of ocular physiology elements, like blood vessels, optic disc, and fovea 12)-(13. These parts must be identified so that they are not taken into account by the algorithms designed to detect the presence of disease signs such as aneurisms, bleeding or exudates.
We designed an ES-based search method to determine the coordinates of the optic disk (od) in retinal images. The search process is guided through a fitness function that joins the two most representative physiological characteristics of the od region: high brightness areas and high presence of blood vessels.
In this paper we present the design of a GPU implementation of ES addressing optical disk detection and segmentation using CUDA technology in order to speed up program execution to address the computational limitations of a previously reported sequential design 14.
1. METHODOLOGY
1.1 Optic disk detection using evolution strategy
Localization methods are based on two physiological characteristics of the optic disk. First, due to its organic composition, the region in which the od is located corresponds to the brightest components 15. However, a major limitation related to this fact is the absence of standardization of technical characteristics for retinal image acquisition. As a result of uncontrolled camera parameter variations, the od region is not necessarily the brightest area of the image.
Another physiological characteristic is that all vessels and sanguine branches originate in the optic disk. It is known that these branches follow parabolic trajectories that converge to the od. These characteristics have been used to design techniques for optic disk detection 16. Other works, such as 17, apply a preprocessing approach for initial treatment in order to enhance contrast by using the HSI (Hue, Saturation, and Intensity) channel; optic disk localization is achieved through intensity variance inside the od. Variance is caused by bright pixels and dark pixels from vessels. Another example of vessel guidance for od localization is a technique called fuzzy convergence 18, which consists in finding the point of convergence of the blood vessels.
Optic disc localization in retinal images is not a trivial procedure due to color space variations caused by the ethnicity of the individual, features of the acquisition device, and optical disturbances introduced by the presence of clinical abnormalities. For all of the above, selecting the brightest region of a retinal image is not a guaranteed method for detecting the location of the optical disk.
The evolution strategy employed was ES (μ + λ), where a set of μ parents are used to create a _ offspring in each generation. In this strategy, the μ parents and _ offspring constitute a whole individual set called population. After each iteration, the best μ individuals are selected by means of a fitness function, which is a user-defined function based on a specific heuristic in the problem’s context. Subsequently, crossover and mutation operators are applied to these individuals generating _ offspring in order to form a new individual set to apply the whole process again.
From a general point of view, search techniques using evolutionary strategies fol low a workflow based on selecting and generating individuals through validation of a fitness function, similarly to Genetic Algorithms (GA). One of the main differences between Evolution Strategies and Genetic Algorithms is that the latter require the definition of functions for encoding and decoding the internal structures of individu als. Due to the circular nature of the target pattern to be detected, each individual is represented through a circle. Each circle represents an individual of radius r locatedat coordinates (x, y) (Figure 1).
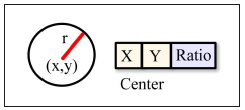
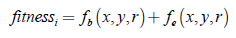
The objective is to determine the circle of radius r which maximizes the number of bright pixels and contains the largest number of edges of the blood vessel network. Thus, the fitness function is defined as:
 ()1
()1
where, fb (x, y, r) constitutes a percentage measure of the amount of bright pixels within the circle represented by (x, y, r). This measure is estimated in relation to the total number of bright pixels and calculated using the 10 % brightest pixel set. Similarly, fe (x, y, r) is a percentage measure of the number of edges inside the circle in relation to the total number of pixels obtained from an edge image.
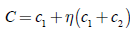
The crossing pattern used corresponds to the general recombination scheme in which the offspring values are estimated as the sum of the values of parents, thus:
 ()2
()2
where c1 and c2 are the values of the parent’s characteristics and ç is a random number normally distributed.
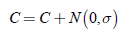
The mutation operator is applied altering each individual value by adding a quan tity, which is based on normally distributed random numbers:
 ()3
()3
where C represents each feature referred to the center of the circle.
1.2 CUDA model implementation
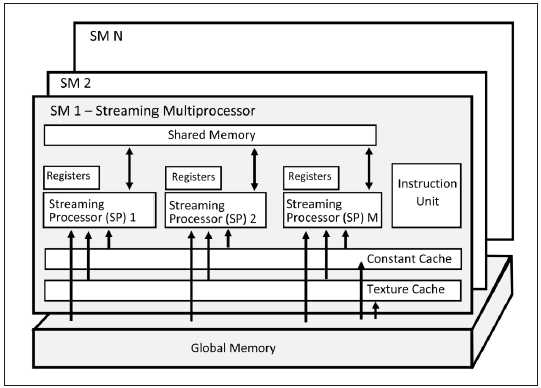
In CUDA, parallel threads run in an organized structure defined by the compiler pro cess, and determined by the programmer. This structure is made of thread blocks and a grid of thread blocks. A thread block is a set of threads running concurrently, shar ing memory and synchronization facilities, while a grid is an array of thread blocks executing the same subprogram called kernel. Figure 2 shows the general architecture scheme of a CUDA device. It has multiple streaming multiprocessors (SM) and each has multiple streaming processors (sp) 5.
Each thread has its Local Memory space, while threads in a block can share data using a common Shared Memory space and each thread block group in a grid can ac cess data using a Global Memory space (Figure 3).
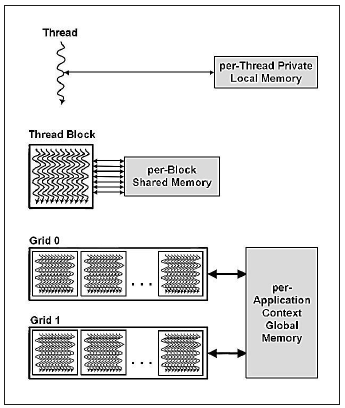
The three memory levels exist inside GPU devices; however, since parallel execu tion of a program consists of one or more phases executed on CPU and others on GPU, a general level of memory is the CPU memory 19. Thus, memory considerations include the data transfer between CPU and global memory on GPU 7.
Different schemes for GA parallelization have been proposed: Master/Slave, Syn chronous Island, Asynchronous Island and Cellular scheme 20, we extended these to the Evolution Strategy. A unique solution to design an optimal parallel GA does not exist, it depends on specific characteristics of the problem in question.
In the Master/Slave model the tasks are divided between CPU and GPU execution; thus, the whole population of a GA is centralized on CPU memory. In the Island model, the population is divided into several sub populations, called islands, which evolve independently from each other; therefore, all typical steps of GA execution are carried out for each island, with one additional step being added to the algorithm, i.e. migration. Migration consists of transferring the information of the best individual after some iterations so that the whole algorithm evolves to the global optimum. Specifically, the way migration takes place differentiates between the synchronous and asynchronous island models. In the synchronous model, migration takes place after a specific number of generations for all islands; this means that all islands must be synchronized for the global process to continue. By contrast, in the asynchronous model each island does the migration after a fixed number of generations, regardless of whether the other islands have reached the same number of generations. Both the synchronous and asynchronous island models are adequate for GA execution in a multicore architecture. Finally, in the cellular scheme for ga implementation, individual evolution is executed on separate devices. Thus, each computing device is viewed as a node of a connected topology, and each node processes a different individual. To apply the crossover and mutation operators connected, neighbors are taken into account. This scheme is called a fine grained scheme while the other models are called coarse grained schemes.
2. RESULTS
Experiments were conducted on a pc equipped with an Intel 2.2 GHz CPU and a NVidia GeForce gtx 550 Ti gpu with 1024 MB gddr5 of global memory and 192 CUDA cores. The software was cuda driver and sdk with version 5.0 using C++ language. The set of retinal images used was composed of 491 images taken from the DIARETDB (Diabetic Retinopathy Database and Evaluation Protocol) public repositories 21.
2.1 Time consuming analysis and selection of execution model
In order to select a parallel model, we analyzed the computational cost of sequential implementation of es described in the previous section in terms of its time consumption. Figure 4 shows the perceptual average of time spent in crossover, mutation, evalua tion and selection stages for a set of 200 algorithm executions. The evaluation stage takes about 46 % of the total execution time because algorithms must operate on two distinct images: fb (x, y, r) is estimated from a normalized intensity image and fe (x, y ,r) is estimated from a border image in order to count the number of border pixels which represent blood vessel presence.
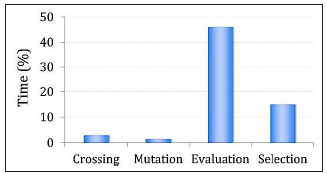
Figure 4 Perceptual time consuming cost of sequential execution of the main stages of the proposed ES.
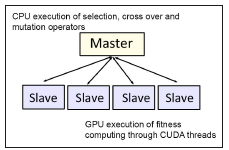
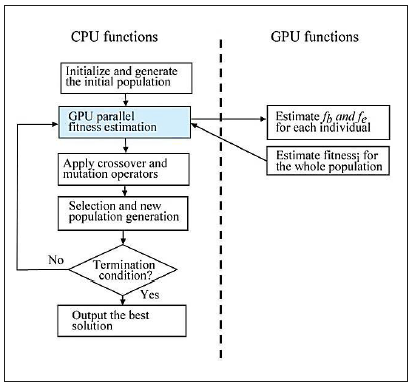
The second major cost was found in the selection stage. This includes the sorting operation to select the best λ individual in each generation. Consequently, we decided to optimize the execution time in the most time consuming stage. Thus, the parallel es was based on the Master/Slave scheme, in which the master process runs on a cpu where selection, crossover and mutation operations are applied. The Slave processes run on the cuda cores and only perform the fitness value estimation in parallel (see Figure 5).
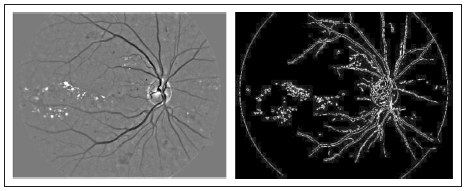
For the GPU based estimation of the fitness function values, we loaded the infor mation of the two images in the global memory space on the device. These are the normalized image and border image representations. The normalized image was used to estimate the fb factor, which was obtained from the original retinal image by apply ing a median filter using a window size of 3 % of the original image. The final pixel value was obtained by adding the green and red channel values in a 70 % and 30 % proportion respectively. This allowed us to increase the contrast of the bright regions while red zones were maintained. The border image was estimated by applying the classic Canny edge detection algorithm which has shown better results than other operators (22). The fe value is estimated from this image. Figure 6 shows examples of normalized and border images.
Additionally, the population information was also loaded to the device because it is necessary for the circle estimation used for counting bright and border pixels. Each CUDA thread is used to estimate one fitness value; thus, each thread reads one set of (x, y, z, r) values and estimates the fb and fe values.
Initially, on the CPU side, the total bright and border pixels are estimated and passed to CUDA threads for perceptual estimation. On the GPU side, in order to speed up the bright and border pixel count process inside the circles, each i individual generates a set of k random position 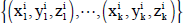 from the center, and lying inside the circle of its’ radius length. This process is straightforward because it can be done by generating random numbers smaller than the length of the radius and adding to or subtracting from the coordinates of the center. The random number generation pro cess is relevant for good performance of all types of EC algorithms, and in the parallel context, random number generation is not a trivial procedure due to the intrinsic se quential nature of the typical Linear Congruential Generators (LCG). This problem has been addressed in works such as 23. CUDA 3.2 included a library for gpu accelerated random number generation routines, supporting Sobol quasi random and XORWOW pseudo random routines 5. The whole scheme of ES execution is illustrated in Figure 7.
2.2 Optic disk detection
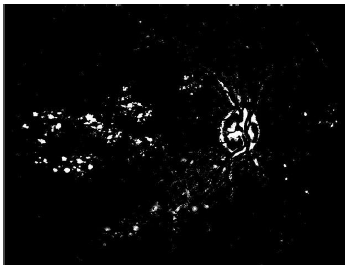
Experimentally, we found that the bright pixels forming the optic disk were in the range of 15 % to 20 % of the brightest pixel set in the whole image. Figure 8 shows an example of thisinitial pixel selection.
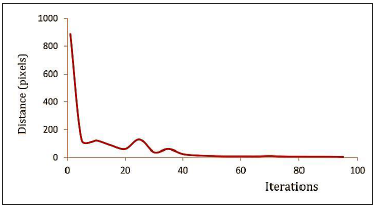
Other initial tests were designed to determine the ES operating parameters. We analyzed the convergence of ES by estimating the distance from the center of the cir cumference of the best individual to a predefined and manually set point pr located in the center of the OD.
Figure 9 shows the average behavior, for a set of twenty runs, of the average dis tance between pr and the ES solution. After 60 iterations the average stabilized; the distance decreased after about 80 iterations.
The initial radius size of the circumferences was experimentally set based on the fact that an average healthy optical disk can be represented by a circle of a 100 pixel radius in an image of 1,500 x 1,152 pixels. The EE parameterization was made accord ing to Table 1.
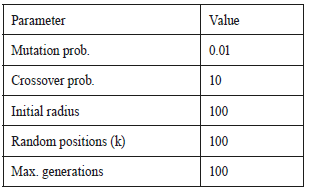
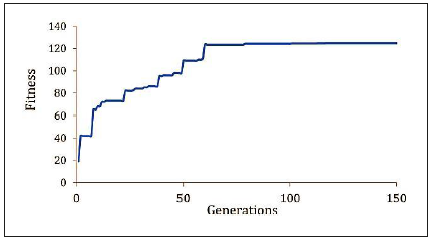
Figure 10 shows the typical fitness behavior of the best individual through 150 iterations. The fitness value tends to increase until 80 iterations. From then on the fit ness value seems to reduce the improvement rate to just over 110 iterations.
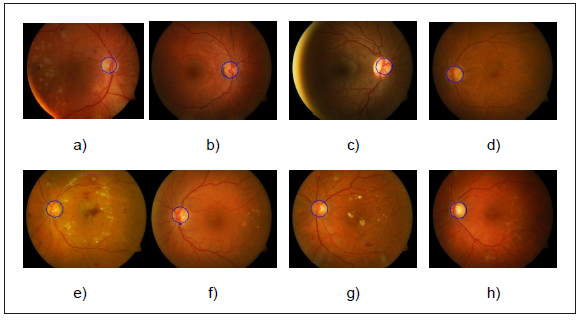
Graphical results can be seen in Figure 11. The method was applied to a 491 image set including images from healthy and diseased individuals. The main diseases found in the images are hard and soft exudates. The results were 469 images with correct optic disk localization and 22 with misplaced optic disk localization. We consider an acceptable optic disk localization as one that contains 60 % or more pixels of the real optic disk region.
In general, we did not expect an improvement in the accuracy of optic disk local ization with regard to the sequential model. Consequently, an accuracy comparison is irrelevant. The greatest effects are found on computation time when varying the parameter values of the algorithm.
In view of the searching nature of es algorithms, a way to enhance the final re sult is to expand the population size, which permits to have more possible solutions and enlarge the search space. Figure 12a shows the average computation time used by the cpu and gpu executions when varying the population size from 100 to 1,000individuals. The gpu model is able to reduce the time used in a factor of 5xto 7x for some specific population values.

Figure 12 a) CPU and GPU computation time (ms) according to population size variations and b) GPU speedup behavior according to population size variations
The speedup obtained is shown in Figure 12b. In the 100 to 200 individual range the algorithm achieved a speedup of 7x approximately, and it decreased to 5x for a population size of 100 individuals.
3. DISCUSSION
The proposed model reduces the average computation time 6.5 times when compared to the sequential method. The largest increases were achieved when the population size was smaller. This is because of the hardware on which the algorithm was executed. The cuda technology uses the blocks of threads concept. Such blocks are assigned to each Streaming Multiprocessor (SM). Inside blocks, the threads are divided into warps or 32 thread sets, which are executed simultaneously. Therefore, if the population size can be exactly mapped to warps and SM, the fitness computation of the whole population is carried out in parallel. However, when the population size grows and the subdivision is not exact, other factors impact the required computational time. One of the most important factors is divergence control.
Divergence control takes place in the presence of conditionals causing different paths for threads inside warps. The different control paths taken by threads in a warp are traversed one at a time until there are no more paths. Avoiding divergence control is a programmer’s task and it is specific of domain problem features. This is a factor that may generate speedup variations when a whole population is processed, as shown in Figure 12b.
4. CONCLUSION
Es based on bright and vessel border pixels for optic disk localization showed an ac curacy of 96 %. Computational time decreased when using a gpu based execution model. The proposed model reaches a speedup of 6 x compared to a sequential model.
GPU inclusion in medical image processing constitutes an alternative in order to reduce the high computational costs associated with image processing techniques.
The main limitation found when processing retinal images for optic disk localiza tion is related to bright pixels when the disease is at an advanced stage because high presence of exudates, common at such stages, increases the proportion of bright pixels. Moreover, retinal images with low contrast make correct localization more difficult. As future work, we plan to expand the proposed method to decrease the effect of large exudate regions on localization accuracy.

