


 English (pdf)
 Article in xml format
 Article references
 Send this article by e-mail
 Cited by SciELO
  Cited by Google
  Similars in
SciELO
Similars in
SciELO  Similars in Google
 Permalink
INTRODUCTION
Colombia is the fifth largest producer of red tilapia in the world. In 2015, Huila produced 10,162 tons of red tilapia, which corresponds to 60 % of the national tilapia production. In the last 5 years, Colombia increased production of red tilapia by 50 %, Huila had an increase of 30 % [1]. In Neiva 20 tons of tilapia are produced diary, that represents approximately 0.6 tons of fish scales per day [2].
Chitin (C8H13O5N)n is a polysaccharide with N-acetylglucosamine monomer and it is found in cell walls of sponge and fungi [3], seawood filaments [4], silkworm chrysalides [5], exoskeletons of arthropods such as crustaceans [6] and insects, and in fish scales [7]. Chitin has low toxicity and it is biodegradable. Chitin has been used to prepare affinity chromatography [8], immobilize enzymes [9], in food [10] and in biosensors [11].
In this research, three different treatments were used to obtain chitin from red tilapia scales. In the first treatment, HCl was used, sodium hydroxide in the second and in the third method EDTA was used to obtained chitin from scales. Chitin was characterized by infrared spectroscopy, thermogravimetric and calorimetric analysis, scanning electron microscopy and Matrix-Assisted Laser Desorption/Ionization-Time-of-flight (Maldi-tof).
1. EXPERIMENTAL PROCEDURE
1.1 Materials
The fish scales were obtained from Betania’s reservoir in Yaguará, Huila (Colombia). All reagents used in this study were analytical grade.
1.2 Chitin from fish scales
The flakes were dried in an oven at 110 °C for two hours and then grounded to get powder. The treatment was realized as described below:
i) A portion of powder was treated with 1.25 N HCl (1:5 w/w) at 35 °C for 8 h and the resulting mixture was filtered and deproteinized with 1N NaOH (1:0.5 w/w) at 80°C for 4 h to finally obtain Ch1.
ii) The second method consisted in treating the powder with 0,5 N NaOH (1:0.5 w/w) at 80 °C for 8 h and the resulting mixture was filtered and demineralized with 1.25 N HCl (1:0.5 w/w) to 35 °C for 8 h to obtain Ch2.
ii) In the third flake powder was treated with 13N EDTA (ethylenediaminetetraacetic acid) (1:5 w/w) at 80 °C for 4 h and then it was filtered and deproteinized with 0.5 N NaOH (1:0.5) to 80 °C for 4 h. All samples were filtered in a vacuum and dried in an oven before they were characterized.
1.3 Characterization of chitin
Probes of solubility of chitin in n-butanol, water, propanol and in acids and bases of different concentrations such us (1-4 M) H2SO4, (1-4 M) CH3COOH, (1-4 M) HF and (1-4 M) NaOH were realized to temperature at 30°C and 80 °C.
The FTIR spectra of three samples of chitin were obtained on anis50 FT-IR Nicolet Thermo Scientific spectrometer. All data were recorded at 20 °C, in the 4,000 - 400 cm-1 range by accumulating 32 scans. Secondary electron (SE) imaging and EDS analysis of garnet were performed in a Fei quanta 650 field emission gum environmental scanning electron microscope (FEG ESEM) under the following analytical conditions: magnification = 200x, WD = 9.2-9.8 mm, HFW = 1.49 mm, HV = 20 kV, signal = BS in Z CONT mode, detector = BSED, EDS Detector Edax Apolo X with resolution of 126.1 eV (in. Mn Kα). ESEM images were used to determine the morphology of chitin and the chemical elements were detected using EDS in the points of interest. Thermogravimetric analysis of the samples were done in a thermogravimetric balance series discovery TA Instruments brand, which has as a thermoanalytical operating principle to measure the change in weight of one sample according to temperature with controlled atmosphere. The equipment has an autosampler for 25 samples and some basket accessories enabling experiments from room temperature until 1,200 °C.
The system includes a gas inlet which can use air in the atmosphere, argon, helium, nitrogen and oxygen. Differential thermal analysis (DTA) of chitin was done with differential scanning calorimeter series Discovery TA Instruments brand, which has as operating principle, one analytical technique where heat difference between a sample and reference is measured as a function of temperature. This equipment has a holder for fifty samples and five references and an automatic sampler. The equipment allows cooling conduct experiments from -90 to 550 °C. The system includes a gas inlet which can be used with air in the atmosphere, argon, helium, nitrogen and oxygen. Mass spectra of chitin were obtained using a Mass Spectrometer Ultraflextreme Maldi tof/tof (Bruker daltonics brand), operating in positive linear mode, in the mass range 700-3500 m/z. A powder of chitin and sodium chloride (used as a cationizing agent) was mixed with water. 1 μL of mixture was deposited in the stainless steel target and dried at room atmosphere. Data analysis was possible using 3.4 Fexanalysis and 1.15 Polytools (Bruker daltonics) software.
2. RESULT AND DISCUSSION
2.1 Elemental analysis
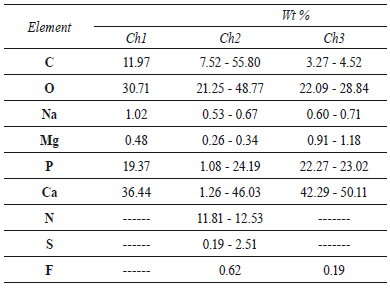
The samples Ch1, Ch2 and Ch3 were white and insoluble in all solvents, acids and bases used in this study. The temperature increase did not change the results of chitin solubility. EDS elemental analysis of chitin is shown in table 1. All samples of chitin showed different percentages of P, Ca, K, Mg, which indicate hydroxylapatite as a residual component. The quantity of ore found was different in such sample, i.e the amount of hydroxylapatite in Ch1 was higher. In all cases, carbon (3.27-55.80 %) and oxygen (2.09-42.51 %) were found in the elemental analysis. Nitrogen (11.61-11.81 %) was reported only in the Ch2 in the selected EDS analysis points. The chemical composition estimated by EDS analysis shows that Ca/P molar ratios in the three samples of chitin is in good agreement with theoretical values.
2.2 FT-IR infrared spectroscopy
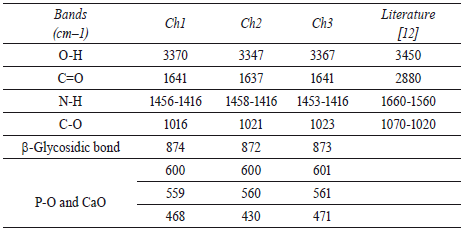
Characteristic bands of IR spectra of Ch1, Ch2 and Ch3 are shown in table 2. These IR bands are similar to each other and with those reported in literature for chitin [12]. 3,340-3,380 cm-1 bands relate to hydroxyl group of glucosamine-based polymer, 1,415- 1,456 cm-1 peaks correspond to characteristic N-H bond of amide functional group, 1,637-1,641 cm-1 peaks represent the linear elongation of C=O bond and 1,016-1,023 peaks describe the vibration of C-O neighbor bond of hydroxyl group. Bands below 600 cm-1 can correspond to characteristic bonds of hydroxylapatite, such as P-O and Ca-O bonds.
2.3 SEM scanning electron microscopy
SEM images of the samples Ch1, Ch2 and Ch3 (500x) are shown in figure 1. The images evidence different size of particles between 0,1 μm to 30 μm, those correspond to hydroxylapatite and chitin. The amorphicity of the sample and generated impurities make it impossible to atribute a structural character to each grain. However, the elemental analysis helped to attribute an organic character to some grain, such as shown in figure 1 for Ch2, grains below 5 μm have an even character, without porositivity, very similar to those reported in literature [13]. SEM miccrograph of chitin/hydroxylapatite confirm the formation of a single phase as shown in figure 1, demostrating the presence of well-defined particles, mainly formed by a regular block of rectangular shapes which were about 0.1 μm in length and 0.2 μm in width, principally. Agglomeration of particles was observed, probably due to the presence of chitin in hydroxylapatite structure.
2.4 Thermal gravimetric analysis
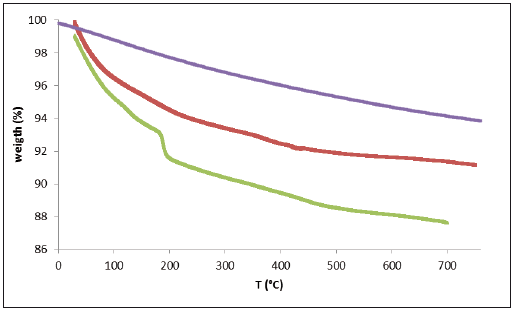
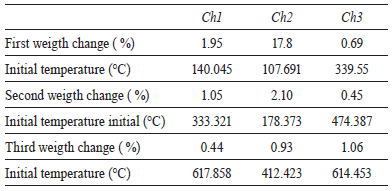
The results of the probes of thermal gravimetric analysis of three samples are shown in table 1. The differences of those correspond to water loss in the three samples and are very similar; such as the possible loss of carbon monoxide. An analysis with more details of each sample is shown in figure 2. Absence of the first peak on the TGA curves of three samples confirm degradation of chitin during chemical treatment [14]. Moreover, the stability of chitin shown in figure 2 can be due to the presence of hydroxylapatite. Two decomposition stages could be observed in the thermogram of chitin. According to table 3 for Ch1, Ch2 and Ch3, the first decomposition stage is in the range of approximately 107 - 339 °C, and the second decomposition stage is in the range of approximately 178 - 474 °C. The first decomposition stage in the thermogram of chitin could be attributed to water evaporation and the second decomposition stage could be attributed to degradation of the polysaccharide molecule structure (including the dehydratation of polysaccharide rings) and the polymerization and decomposition of the acetyled and deacetylated units of chitin [15].
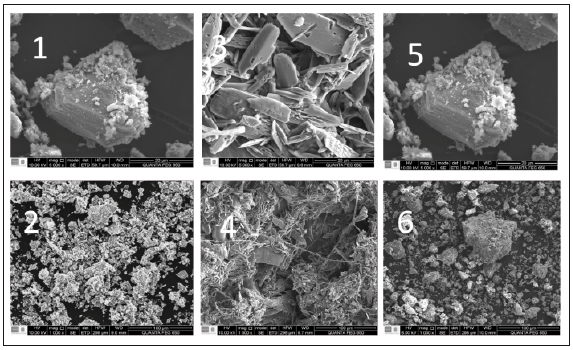
Source: the Authors
Figure 1 SEM images of the polymeric structure of (1)-(2) Ch1, (3)-(4) Ch2 and (5)-(6) Ch3. Scale 20 - 100μm.
2.5 Differential thermal analysis
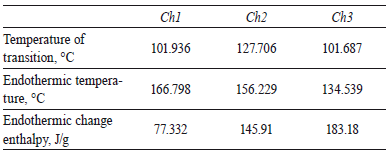
The values of transition and endothermic temperature and the transition changes are summarized in table 4. The transition temperature of three samples was little in comparison to values reported in literature [16-17] and the temperatures of Ch1 and Ch2 were similar between themselves. However, transition temperature of chitin increased 25-26 °C with the second treatment. This may be due to the decomposition of the grafted chitin with hydroxylapatite in a crosslinked network structure. The endothermic temperature was 134.539-166.798 °C and according to endothermic change enthalpy, it can deduced that polymer could be degradable in some step of its extraction by these three methods.
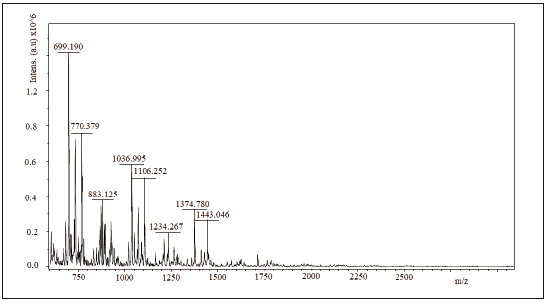
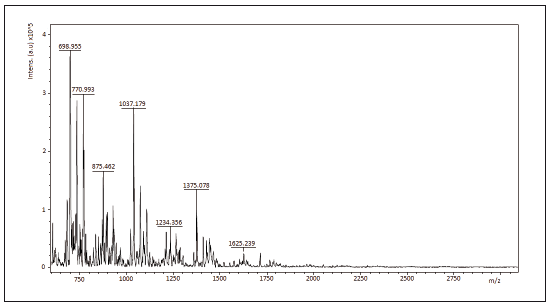
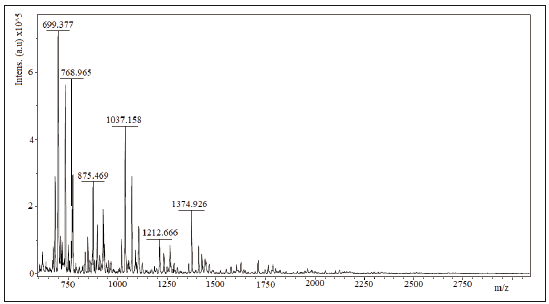
2.6 Maldi tof/tof
spectra mass assisted Maldi tof/tof of the samples Ch1, Ch2 and Ch3 are shown in figures 3 to 5. 1064.28 Da, 1064.56 Da and 728.939 Da were the molecular mass, Mw, for Ch1, Ch2 and Ch3, respectively and 1.00074; 1.00075 and 1.00179 were the polidispersivity index (Mw/Mn) of the samples for each case. One group of the Maldi lines in ranges 200 - 1800 m/z was detected in the Maldi spectra of Ch1, Ch2 and Ch3. The intervals between lines were found to be of different values (72, 112 y 153 Da) that correspond to several losses of molecular mass of one structure unit in oligosaccharide of chitin. All Maldi spectra of Ch1, Ch2 and Ch3 were similar to those in literature [18, 19]. Most significant line with 700 m/z corresponds to the dehydrated dimeric ion [M-H2O+Na] and lines with 1379 m/z relate to the deacetylated trimeric ion [M-CH3CO].
3. CONCLUSIONS
Physico-chemical analysis demostrated that chitin could be obtained by three different chemical treatments from red tilapia scales. Thermal propierties, size of the grain, polydispersivity, the quantity of residual hydroxylapatite and number of oligasaccharide units in chitin can be modified according to the method applied. Chitin obtained from aquaculture products can be an opportunity for the commercial use of these materials in a simple way.

