


 Inglés (pdf)
 Articulo en XML
 Referencias del artículo
 Enviar articulo por email
 Citado por SciELO
  Citado por Google
  Similares en
SciELO
Similares en
SciELO  Similares en Google
 Permalink
INTRODUCTION
Colombia is a rich country in raw materials, and enjoys tropical conditions to carry out agricultural practices: These conditions allow that all kinds of products grow. According to this context, studies are executed from engineering to achieve solutions that improve the production and quality of the products, which are aimed towards precision agriculture (PA), itself based on the development of excellent agricultural practices to optimize farming techniques. Precision farming has evolved over the last 10 years up to implement technological advances such as geographic information systems (GIS), global positioning systems (GPS), satellite or terrestrial sensors, software tools, and data processing, among others; these methods help the farmer to know crop conditions in detail, and to carry out actions of containment, prevention and sustenance [1] [2]. One important phase in precision agriculture is information processing, which is the basis for crop characterization, and it is basically the knowledge of their physical and physiological properties.
Among the relevant methods for crop characterization is aerial photogrammetry, which includes georeferenced mosaics, digital terrain and surface models, and vegetation indexes that correspond to mathematical combinations between the different spectral levels found in a photography [1]. Generally, photogrammetric analysis is performed on satellite images [2]; however, this technology involves high implementation costs and low resolution. This difficulty generates interest in evaluating other alternatives such as the use of unmanned aerial vehicles (UAV). A UAV has the advantage of carrying high- resolution sensors such as lasers, heat sensors, infrared cameras, multispectral cameras, RGB (visible spectrum) cameras and ultraviolet cameras, outstanding among which are cameras of visible and infrared spectrum for their price and availability. Using cameras in the visible and infrared spectrum, fundamental vegetation indexes are calculated such as NVDI (normalized difference vegetation index), which can be useful to determine the vegetative state of the plants [3]. With a correct agricultural crop characterization, it is possible to interpret the data acquired in the practices of precision agriculture, thus optimizing fertilizers application and an effective control in time and space. A correct interpretation translates into economic benefits due to fertilizers savings and a reduction of the treatments performed in the influenced areas.
The direct observation of the plants does not allow to know their state in an objective way. Due to that, it is necessary to use a system capable of recognizing different bands of the electromagnetic spectrum that reveal the crop health, and allow to monitor plant growing. These requirements can be met by performing an agricultural crop characterization using photographs in the visible and infrared spectrum. Although technologies dedicated to this task do exist in the market, their high cost does not allow them to be easily accessible to farmers. These situations motivate the development of low-cost technology that could give benefits to the farmer, and promote agricultural activities [8] [9].
The present proposal is based on works by Bendig Juliane et al. [2], who studied the biomass in an agricultural crop from the vegetation indexes NDVI, SAVI, MSAVI, OSAVI, GnyLi, GRVI, MGRVI, and RGB VI, that are calculated through images in the visible and near infrared spectrum obtained from an octacopter UAV. The objective is to find relations between the physical factors of the crops and the captured images. The work developed in [4] is based on results comparisons taking into account the size of the pixels; it is sought to evaluate the accuracy of the NDVI, GNDIV, NGRDI, and TGI vegetation indexes obtained from images in the visible spectrum, and near infrared.
The method is based on free software, with the disadvantage that increasing the number of images and the size of the crop, increases exponentially the effort and work required to obtain the results. Wei, Wang et al. [5] used the vegetation indexes SAVI and RVI to evaluate nitrogen concentration in leaves of wheat and rice plants; the efforts made are based on analyzing the behavior of the different spectral bands. It is concluded that vegetation indexes are appropriate to determine the nitrogen absorption in the leaves. Li, Wang et al. [6] desire to find the height of the canopy, as well as the area of biomass within a maize crop using images obtained from a low-cost unmanned aircraft. The location is 84 km north of Beijing, China, 30 m above sea level. A flight was made at a height of 150 meters and at a temperature of 9.1° C, capturing RGB images with 80% longitudinal overlap and a 40% lateral overlap, and vegetation indexes found in the range of the visible spectrum were used. Information on canopy height and biomass were presented in a georeferenced map obtained from vegetation indexes.
The work in [7] describes algorithms for the detection of the plant fraction in a crop from multispectral images captured at different times to measure the spectral reflectance during plant growth, using the vegetation indexes NDVI, GNDVI, and VARI to later relate them with the existing vegetal fraction. The results are presented as graphs of percentage of vegetal fraction related to each one of the indexes of vegetation studied.
In the review, most of the software tools used for image processing, and subsequent obtaining of vegetation indexes, are privative products. It can also be evidenced that most of the projects found are focused on the calculation of the vegetation indexes by multispectral cameras of high cost, therefore, the use of an accessible commercial camera is proposed. Throughout this work, free-use processing tools are accessible to any farmer in the region. All the process is controlled by a software prototype that is composed of a mobile application and a web application, in order to facilitate the collection and processing of information. One of the most important approaches is obtaining a reliable NDVI from a commercial camera through the approximation of the resulting bands and the use of suppressive filters of visible light allowing to obtain information of infrared radiation, which is useful to determine the vegetative state of plants.
The section 1 of this paper presents a brief introduction regarding vegetation indexes. Later, on section 2, the tools used are presented; sections 3 and 4 describe the processing stage, accompanied by the results, and conclusions are presented in section 5.
1. BACKGROUND
For a better interpretation of this paper, the concepts used in this research are described below.
1.1 NDVI Calculation
The visible and infrared bands of the electromagnetic spectrum are directly related to different physiological factors on plants, such as the process of photosynthesis, humidity, chlorophyll, etc. [27]. Normally, the spectral reflectance in a plant varies according to the wavelength and its physiological state. Therefore, it is possible to make mathematical combinations between these spectral bands to highlight the vegetation of its surroundings. The result of this process is called Index of Vegetation, and it becomes useful to have an idea of the physiological processes of plants [3]. According to [10] [11], the NDVI is suitable to carry out a process of crops monitoring in order to determine the quality of the growth of the plants; thus, it is possible to determine affectations by pests or diseases, or if there is a problem of water stress in the plants. In [12] [13] [14], it is found that it is possible to approximate the values of NDVI using a commercial camera by removing the infrared cutting filter and adding a filter that is capable of filtering the red band or the blue band of the visible spectrum, taking advantage of this space to form an image in false color. The relationship involved for NDVI, in this case, is represented in equation (1).
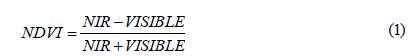
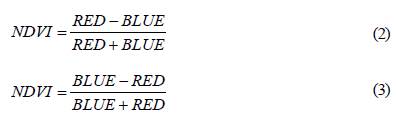
Where the band corresponding to the NIR represents the one that removes the special filter used, and the visible band corresponds to the remaining band. In particular, NDVI with the red band blocker filter is calculated with equation (2), and the blue band with equation (3).
2. TECHNOLOGY AND METHOD
The aircraft used was the DJI Phantom 3 Standard quadcopter, which has an approximate operating range of 500 meters and an autonomy of approximately 25 minutes, operated by an application called Litchi from a mobile device. This application allows to manually create missions from the "Waypoints" function, and to deploy them in the aircraft according to the desired configuration. The Raspberry Pi camera has a resolution of 5 Megapixels. It has two band-blocking filters: Roscolux # 19, and Roscolux # 2007. A web and mobile prototype was developed: It was responsible for the loading, processing, and subsequent deployment of results.
This article presents some experiences and considerations for precision agriculture applications using UAV platforms, low cost cameras, and free license processing tools. The experiments are focused on achieving a reliable NDVI from a commercial camera that captures infrared light. In particular, the proposed method focuses on the flight planning and image capturing by a commercial camera carried by an UAV; stitching of obtained images; loading, processing and deployment of results to obtain a reliable NDVI; and analysis and testing over time to monitor crops in a real environment.
2.1 Flight Planning and Image Capturing
Flight planning and image capturing are the processes by which photographic information is collected in the field; they are important to obtain quality results. The flight planning considers the prior phases to obtaining information in the field, among which there is the analysis of aspects such as target area, height, possible obstacles, and others. This project considers calculations such as maximum flying speed, distance between flight lines, and distance between captures, in order to optimize resources and improve outcomes [15] [16] [17]. The capture process is carried out by considering the information obtained in the planning process. In this work, the Mission Planner software is used, which will help to establish the routes for autonomous flights. Finally, in the camera module, repetitive captures are implemented with a certain configuration from time to time.
2.2 Stitching of obtained images
After the capture step, it is important to process the images obtained. The software used to do this was Image Composite Editor, which is freely used for non-commercial purposes. This process consists of forming a single image from the individual images captured at different points in the field, and preferably at the same height.
2.3 Loading, Processing, and Deployment of Results to Obtain a Reliable NDVI
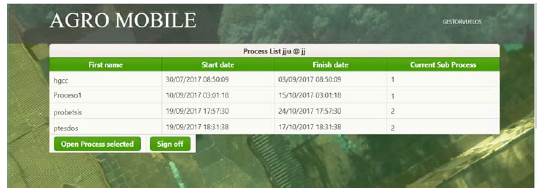
The prototype developed considers the farmer as a business actor, whose business use case is to monitor crops. For the business use case to be fulfilled, different functional requirements were established.
2.4 Functional Requirements
According to the above, it is defined that the prototype must allow authentication by user name and password, allow the storage of aircraft and cameras with their respective parameters within the system, allow control of the image capture system, and provide a method for the storage of images to later process them and show the results.
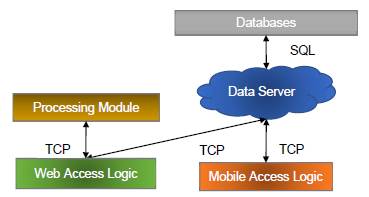
2.4.1 Architecture
The architecture can be seen in Figure 1, above. It is composed of a database server, a web-mobile prototype, and a processing module. The web-mobile prototype controls the display of results and the upload of information, and the information processing module receives the NGB image and generates the NDVI map.
2.5 Implementation Prototype
2.5.1.2 New Process View
This view allows the user to insert new processes to the server. It consists of three steps: Basic information entry, camera choice, and aircraft choice. In step 1, the user types the name of the process, the number of weeks of the test, and the number of tasks (limited between 1 to 3). Step 2 allows to insert new aircrafts and select one, and step 3 allows to insert new cameras and select one.

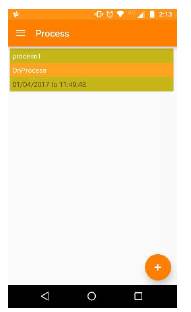
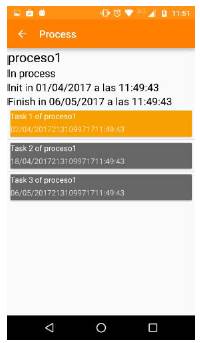
2.5.1.3 Process View
This view summarizes the detailed information of the information gathering process. if the user taps on a task, the system shows its current status.
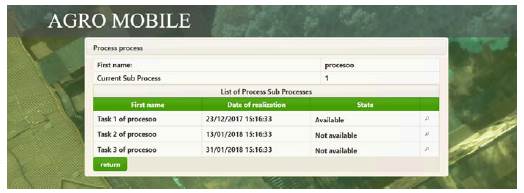
2.5.2.2 Process View
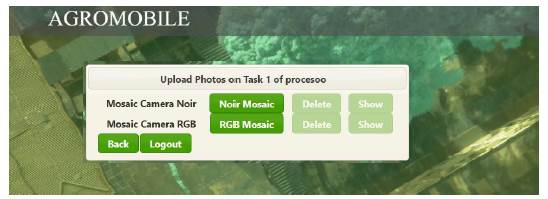
This view shows the detail of a single selected process. The server enables the option to upload photographs if the task date is in the allowed range.
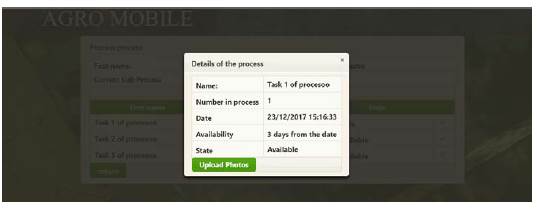
2.5.2.3 Load Information View
The information load view allows to establish the information of each task in the process. It receives two photographs as a reference to carry out the information processing. After uploading the photographs, they are automatically processed and referenced.
2.5.3 Processing Information Module-logic
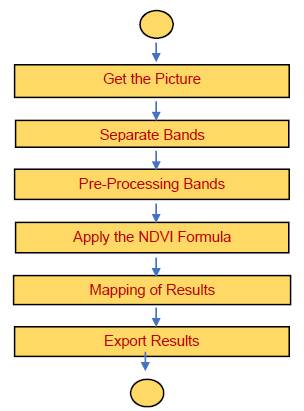
Figure 9 shows the proposed diagram to obtain NDVI values. Python language was used due to its versatility, and all implementations were made using the Linux operating system. The proposed method allows to obtain as output a NDVI map which corresponds to a representation of the NDVI index in graphic form.
2.5.4 Approximation of Visible Spectrum Bands
In this work, a normal RGB camera identical to the Raspberry Pi NoIR camera is used, with the only difference being that it has the IR filter. The following tests are performed in a controlled environment to compare the bands such as the response of what should look like pure red, pure blue, and pure green. The following tests were performed on coffee plants: On the one hand, a verification and comparison of the resulting bands from the two cameras; and on the other, an approximation of the resulting visible spectrum bands in the two cameras.
2.5.4.1 Verification and Comparison of the Resulting Bands of the two Cameras
The objective of this test is to establish similarities and differences between the visible band used to calculate the NDVI with the NoIR camera, and the visible band of the RGB camera.
Figure 11 presents the behavior of the plants around the visible spectrum. It can be seen that in red and blue, these do not have a high reflectance. These results allow having a reference to obtain the bands that correspond to the visible spectrum when using the NoIR camera. The first step is a decomposition of the images obtained with the NoIR camera using both filters, that can be seen below.
Figure 13 and Figure 15 show that the bands used to store the information of the visible spectrum are not similar to the bands originated by the RGB image, which leads to analyze the processing of the bands to bring those results closer.
2.5.4.1 Approximation of the Visible Spectrum Resulting Bands in the Two Cameras
As it can be seen, there are notable differences between the visible bands resulting from the RGB camera, and visible bands resulting from the NoIR camera dependent on the filter to be used. This is due to any used filters these bands are contaminated by infrared information, which causes this difference. Considering this information, a mathematical process is carried out to achieve an approximation between the visible bands resulting from the Noir camera and RGB camera. In order to approximate the bands, a mathematical manipulation of the visible bands resulting from the capture with the NoIR camera is made, based on those obtained with the RGB camera under the same conditions.
It is known that the visible band information is affected by infrared information that cannot be filtered, and from this fact it is proposed to remove that information by subtracting the pure infrared band, obtained by using the filter, to the visible band of the same photography. Specifically, the proposed equation is:

Where VISresul is resultant visible band, VISobtaining is visible band captured, INFRAREDObtaining is Captured infrared band, and A, B and C are multiplying decimal constants.
To determine the values of A, B and C, the resulting visible band must be compared with the visible band obtained from the RGB camera. This comparison process is performed by the linear correlation index that defines the correlation between two random variables -in this case, two images-. The values of this index range from -1 to 1, of which the value of least similarity is 0, which means that the two images have nothing in common. This index can be calculated using the OpenCV functions that are already predefined in the library [18].
In general, the design of an algorithm that allows to modify those values in a determined range until obtaining a value for each one of them, that allows to calculate the maximum of possible correlation and to verify the results, is proposed. The flow diagram that was used is presented in Figure 16.
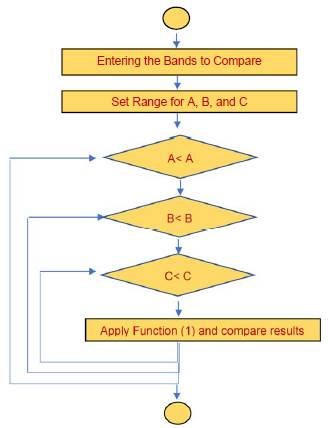
The correlation index obtained allows to define values for A, B and C suitable for each of the filter configuration used in the photographs aligned in the test of the combined bands. The process is performed with three different white balance settings.
3. RESULTS
3.1 Nomenclature
One of the most important sources of radiation is the sun: The surfaces absorb or reflect this radiation, and that depends on its wavelengths or the characteristics of such surfaces as their composition or roughness [19] [20]. Healthy vegetation, for example, absorbs almost all the wavelengths that make up the visible spectrum; this is because of photosynthesis, but due to the molecular structure of the leaves, it completely reflects the wavelengths in the near-infrared band. Pure water reflects low energy at all wavelengths, different from ice and snow, which have a high reflectance in all bands. In the case of soil, reflected energy depends on the presence of organic matter, texture, and roughness, among others [20] [21].
The interpretation of the results shown is centered in describing the meaning of the colors that compose the resulting maps. According to [22] [23] [24] [25], NDVI is a normalized index, which means that it has infinite values between -1 and 1, in which the vigorous plants with good health reflect all the energy of the sun in the band of the near infrared, they whereas absorb about 90% in the red and blue bands for the process of photosynthesis, reflecting part of the green band, due to the fact that the human eye perceives them in that color. That leads to have a high NDVI, greater than 0.5, whereas plants with some type of anomaly or problem reflect energy equally in all the bands described, the visible spectrum being comparable with the near infrared; this means that they have a lower NDVI, between 0.1 and 0.3 [24] [25]. For this reason, in Figure 17 the continuous NDVI map is established where the NDVI values are mapped, with the blue color on the left end representing -1 and the red color on the right end representing 1.
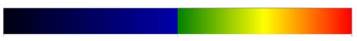
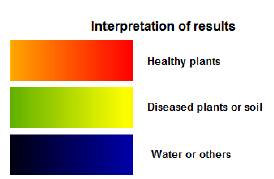
Figure 18 shows the classification that was made to achieve an interpretation of the results shown, according to the defined nomenclature.
3.2 Captures
In order to test the proposed method, captures were made in a coffee crop in the municipality of Timbío, Department of Cauca, at 1,782 meters above sea level [26], delimiting an area of 1 hectare of flat terrain without obstacles higher than 50 meters. The objective of these studies is to demonstrate the capacity of the proposed method for calculating the NDVI that allows to carry out a monitoring of crops in a time lapse of three weeks.
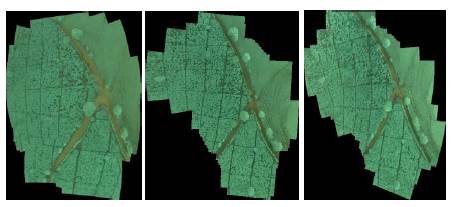
The testing process begins by collecting the images in the crop, considering that to make the samples comparable, it is necessary to keep the initial configuration as much as possible. After collecting the images, the stitching process of pictures is executed, and the tool to be used is Image Composite Editor. The mosaics shown in the Figure. 19 were made using the process described in [27]. In Figure. 19, Figure. 20, and Figure. 21, three configurations established for the camera are presented using the visible band eliminator filters, whose characteristic curve can be found in. In total, three captures were made, with one week of time difference between them.
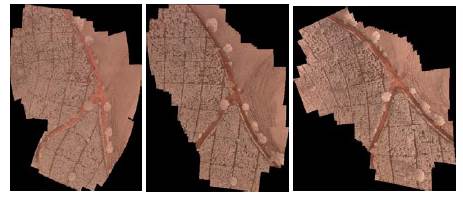
3.2.1 Filter # 19 AWB 0.54,1
This configuration allows to capture images for the NDVI calculation using the filter # 2007.
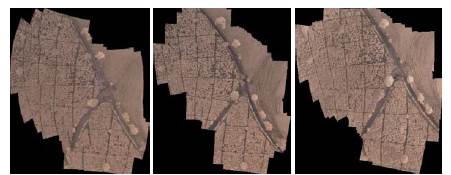
3.2.2 Filter # 19 AWB 1,1
This configuration is an alternative to using filter # 19, with which NDVI calculations are also performed. The process to be executed was the same as in the previous configuration.
3.2.3.1 NDVI with #19 filter AWB 1,1 configuration
In Figure 22, the NDVI generated in the three corresponding tests are presented with the configuration of the filter # 19 AWB 1,1. These tests correspond to the results of each of the images captured in each of the tasks when the process is finished, and they are generated automatically.
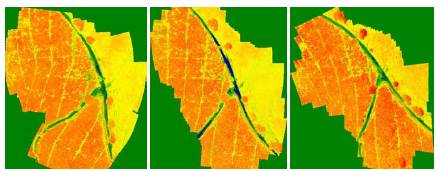
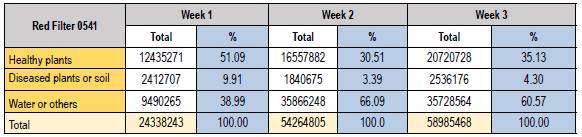
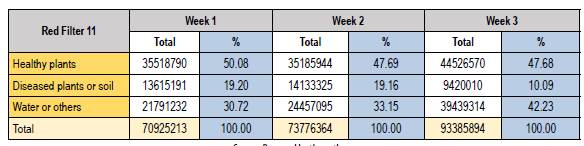
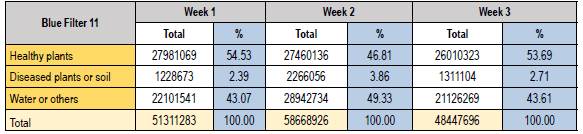
From the results presented in figures 22, 23 and 24, and in the tables 1, 2 and 3, it can be said that although there are differences between them, all three keep the above characteristics. However, the one that best represents the expected information is the one in Figure 22: With this configuration, a suitable representation is obtained for the values corresponding to the soil and the vegetation, achieving a good contrast between the different NDVI values. It is important to emphasize the temporal variation between the three consecutive captures at different times. Although in general terms the crop condition remained constant, a slight variation can be observed between them that may belong to changes in the physiology of the plants.
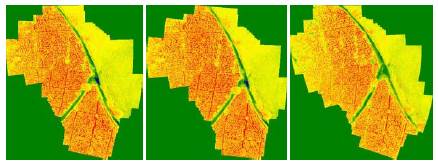
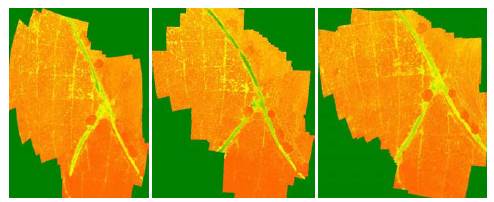
Considering the nomenclature and the analysis above, it can be affirmed that in the three defined configurations of the camera there is a relation between what is obtained and what is expected according to the literature. This mainly refers to the fact that for vegetation there are high values of NDVI that approach 1, and they are classified as healthy or vigorous plants. Furthermore, it can be appreciated that for the areas that do not correspond to the vegetation, there are low NDVI values of around 0.3 or even negative ones. As the tests were performed with one week of difference in each and the environmental conditions were constant, a great difference in time between the results is not appreciated. However, it can be seen that Figure 22, which belongs to the capture with a white balance of 1,1, represents the camera configuration that presents a superior performance compared to the others. This configuration maintains a differentiated contrast in comparison to the other captures, thus allowing to establish it as the configuration for future works.
4. CONCLUSIONS
In this article, a method for the characterization of crops using a multirotor air vehicle is proposed. The analysis shows that it is possible to obtain a reliable NDVI to determine and monitor the health of plants in any type of crop, regardless of their age. The proposed method for the monitoring of crops is economically convenient, since the hardware and software processing tools used for processing are free to use, and it is possible to monitor crops over a given time interval using the proposed method for monitoring crops. It is necessary to maintain environmental conditions to obtain valid results. The NDVI map obtaining is based on the infrared information from crops, and it is necessary for the analysis of the evolution of plants individually an experimented farmer as future work. The calculated NDVI demonstrates, among other things, the relationship between plants' health and spectral reflectance: that is why the NDVI is theoretically useful to detect plants' health at any stage of the crop. This paper is a basis for future work focusing on low cost solutions.

