


 English (pdf)
 Article in xml format
 Article references
 Send this article by e-mail
 Cited by SciELO
  Cited by Google
  Similars in
SciELO
Similars in
SciELO  Similars in Google
 Permalink
INTRODUCTION
The Massive Open Online Courses (MOOC) are a proposal to universalize education, to offer it in a freeway and with quality to people in any place in the world [1, 2].
On the Open edX platform xMOOCs are offered. The platform has a static structure and it publishes the learning material developed to a large extent by the teacher(s) in charge of the course. In the xMOOCs there are students who navigate freely without necessarily following what is suggested by the content creators or the structure of the platform; there are other students who prefer to navigate as imposed by a teacher or the online learning environment. Student navigations generate a set of navigations that create navigation patterns, which are recorded in a text file called tracking.log for the Open edX platform [3-6].
The xMOOCs offered by different universities in the world have led to a growth in the participation of students in the courses [7], generating an increase in the navigation patterns registered in the tracking.log file. So far there is no study that identifies the navigation patterns according to the weighting of the relative frequency of an event (EF-ISF) [3-4, 8]. For this reason, this article proposes the use of the LexRak with Threshold algorithm to identify the EF-ISF navigation patterns registered in the tracking.log file of the xMOOC of the Open edX platform.
This article is structured as follows: section 1 describes in a general way the structure of the tracking.log file; section 2 is a representation of students with the vector space model and the EF-ISF; section 3 describes the LexRank with Threshold algorithm; section 4 constitutes an example for identification of EF-ISF navigation patterns; and section 5 comprises the conclusions and future work.
1. TRACKING.LOG OF THE OPEN EDX PLATFORM
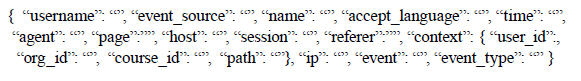
The tracking.log is a JavaScript Object Notation (JSON) file that saves a record each time an activity or event is performed by the student(s) in the xMOOC course of the Open edX platform. The file has a structure general for all events, which is shown in figure 1 [3-4, 6].
2. STUDENT REPRESENTATION
This article uses the Vector Space Model, allowing to find the relation of the navigation events of the students in an xMOOC course, registered in the tracking.log file of the Open edX platform. In order to give a value to the navigation events, the weighting based on the relative frequency of an event (EF-ISF) is used, where  represents the weight of the event ith of the student
  ,as can be seen in equation (1) [3-4, 9, 10].
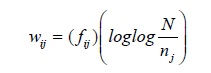 (1)
(1)
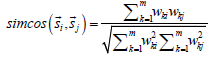
The calculation of similarity between the students  and is performed with the similarity of cosines, as shown in equation (2) [3, 9, 10].
 (2)
(2)
The representation in the multidimensional space of the set of student vectors is made with the Matrix of Events by Students ( Matrix EF ISFmxn ) and the similarity of the same ones is made with the Matrix of similarity of Cosines (MatrixOfSimilaritynxn); the elements ij of the Matrixes ∈ R [3, 10].
3. LEXRANK WITH THRESHOLD ALGORITHM
The LexRank with Threshold algorithm is used to automatically generate summaries of one or multiple documents [3, 10]. This article proposes the use of the Algorithm for the identification of EF-ISF navigation patterns.
The LexRank with Threshold is based on the concept of prestige in social networks. A social network is a map of relationships between entities (students, organizations) that interact. Social networks are commonly represented in the form of graphs, where the nodes represent the entities and the links represent the relationships between the nodes [3, 10-11].
A set of students can be seen as a network of related students; some are more similar to each other, while others may share little information with the rest of the students. If a student is very similar to the other students, this can be considered as the most central or representative. That is why there are two key points to support this definition of centrality; first, how to define the similarity between two students and second, how to calculate the global centrality of a student given his similarity with other students [3, 10-11].
To define similarity the set of students is initially represented in the vector space model and the weighing of events EF-ISF from equation (1) is used. The similarity between two students is defined by the cosine similarity shown in equation (2); then the set of students is represented as a graph through an adjacency matrix (MatrixOf- Similarity); each value of the matrix corresponds to the cosine similarity between the students [3, 10-11].
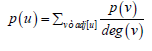
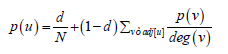
Subsequently, for grade centrality, the student node must take into account the votes of each node and where those votes come from. This can be considered if each node has a centrality value distributed between the node itself and its neighbors; as shown in equation (3) [ 3, 10-11].
 (3)
(3)
Where p(u) is the centrality of the u node, adj[u] is the set of nodes that are adjacent to u, and deg (v) is the degree of the v node. This equation can be written in matrix notation as follows, see equation (4) [ 3, 10-11].
 (4)
(4)
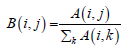
Where matrix B is obtained from the adjacency matrix of the similarity graph by dividing each element by the sum of the corresponding row, see equation (5) [ 3, 10-11].
 (5)
(5)
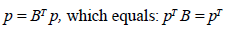
The sum of a row is equal to the degree of the corresponding node and each student is at least similar to himself, for this reason, the sums of the rows are different from zero. The equation (4) establishes that pᵀ is the own left vector of the matrix B with the own value corresponding to 1, to guarantee the existence of an own vector that can be identified and calculated in a unique way, the following needs to be taken into account [ 3, 10-11].
A stochastic matrix X is the transition matrix of a Markov chain; an element X (i, j) specifies the probability of transition from a state i to a state j. By probability axioms, all rows of a stochastic matrix must add 1.  (i, j), is the probability of state i to reach state j in n transitions. A Markov string with stochastic matrix X converges to a stationary distribution [ 3, 10-11].
 (6)
(6)
Where 1 = (1, 1, ... , 1), and the vector r is called the stationary distribution of the Markov chain; each element of the vector r gives the asymptotic probability of ending in the corresponding long-term state, regardless of the starting state. A Markov string is irreducible if any state is accessible from any other state, that is, for all i, j there is an n such that Xn (i, j) ≠ 0. A Markov string is aperiodic if for all i, gcd gcd {n∶ Xn (i, i) > 0} = 1. By Perron-Frobenius theorem, an irreducible and aperiodic Markov chain converges to a single stationary distribution [ 3, 10-11].
Since the similarity matrix B in equation (4) satisfies the properties of a stochastic matrix; it can be treated as a Markov chain. The centrality vector P corresponds to the stationary distribution of B. However, it must be ensured that the similarity matrix is irreducible and aperiodic. To solve this, a low probability is saved for jumping to any node in the graph, which makes the graph irreducible and aperiodic. If you assign an uniform probability to jump to any node in the graph, you get the following modified version of equation (3), which is known as the LexRank with Threshold algorithm, see equation (7) [ 3, 10-11].
 (7)
(7)
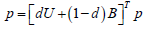
Where N is the total number of nodes in the graph and d is a “damping factor”, which is usually chosen in the range [0.1, 0.2]. Equation (7) can be written in matrix form as shown in equation (8) [ 3, 10-11].
 (8)
(8)
Where U is a square matrix of NxN with all elements equal to 1/N. The transition kernel [dU + (1 - d)B] of the resulting Markov chain is a mixture of two U and B kernels. A random walker in this Markov chain chooses one of the adjacent states of the current state with probability 1 - d, or jumps to any state in the graph, including the current state, with probability d[ 3, 10-11].
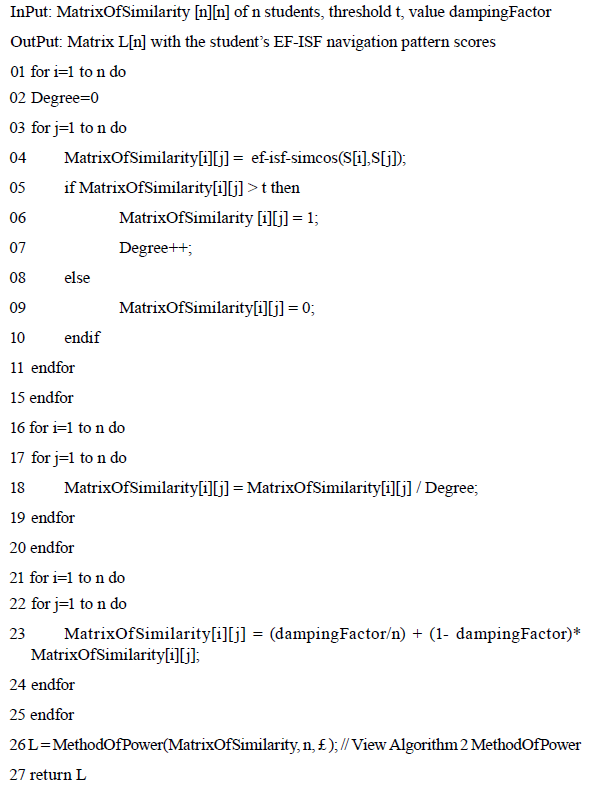
Below is the pseudocode of the LexRank with Threshold algorithm for the identification of EF-ISF navigation patterns in a set of students, as described in Algorithm 1 [ 3, 10-11].
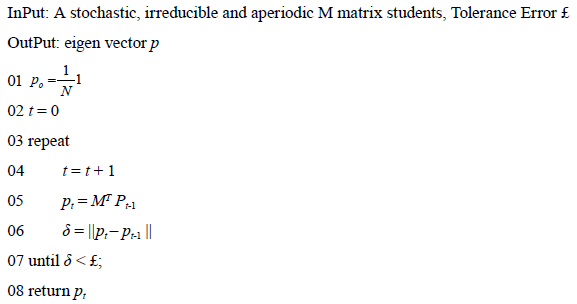
The Power Method describes how to calculate the Stationary Matrix of a Markov Chain, this is shown in Algorithm 2.
4. IDENTIFICATION OF EF-ISF NAVIGATION PATTERNS WITH THE LEXRANK WITH THRESHOLD ALGORITHM
This section shows an example of the process of identifying EF-ISF navigation patterns with the LexRank with Threshold algorithm. For this we use two events generated by a student of the course of Everyday Astronomy of Group B, from the year 2017 first academic period of the University of Cauca [4].
For the example the following parameters are used: two events of a student, threshold = 0.9, damping factor = 0.15 and tolerance error = 1.
The events are obtained from the tracking.log file of the Selene platform; some fields will be taken from them and the student will be called anonymous; this is shown in table 1.
Table 1 Parts of the tracking.log file of two events of a student
| First event |
| username: anónimo |
| name: pause_video |
| time: 2017-05-19T03:23:26.966429+00:00 |
| referer: http://selene.unicauca.edu.co/courses/course-v1:Unicauca+AstronomiaCotidianaGrupoB+2017-I/courseware/9ee2d4e6ba4f4c8cb5a1aea3b66220a8/83d11edf15c446a5be18be0014144fcb/event: |
| Second event |
| username: anónimo |
| name: load_video |
| time: 2017-05-19T03:21:00.319791+00:00 |
| referer: http://selene.unicauca.edu.co/courses/course-v1:Unicauca+AstronomiaCotidianaGrupoB+2017-I/-Vcourseware/9ee2d4e6ba4f4c8cb5a1aea3b66220a8/83d11edf15c446a5be18be0014144fcb/event: |
Source: [4].
Seven fields are taken from the fragments of the record and they will be called events, as shown in table 2 [4].
Table 2 Log events
| event1 = pause_video, |
| event2 = AstronomiaCotidianaGrupoB |
| event3 = 9ee2d4e6ba4f4c8cb5a1aea3b66220a8 |
| event4 = 83d11edf15c446a5be18be0014144fcb |
| event5 = 0xIv1RoSXNk |
| event6 = load_video |
| event7 = P2uUPX2y8Ks |
Source: [4].
Applying equation (1), the following EF-ISF Matrix is obtained, see Matrix 1 [4].
With the EF-ISF Matrix and the equation (2), the Cosine similarity Matrix is calculated; applying the threshold = 0.9 and distributing the centrality of the student, the following Stochastic Matrix is created, see Matrix 2.

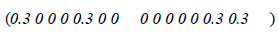
The Stochastic Matrix is transformed into the Matrix X, which is irreducible and aperiodic with damping factor = 0.15, see Matrix 3.
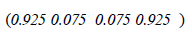
Then calculate the Stationary Matrix with tolerance error = 1, this is shown in Matrix 4.

Based on the results of the Stationary Matrix, it is evident that the student’s two EF-ISF navigation patterns have the same value, from which one can conclude that both have equal importance. The EF-ISF navigation patterns are now shown and they were determined with the LexRank with Threshold algorithm, see table 3.
Table 3 EF-ISF navigation patterns of the anonymous student
| EF-ISF Navigation1 Patterns AstronomiaCotidianaGrupoB - |
|---|
| >9ee2d4e6ba4f4c8cb5a1aea3b66220a8 -> 83d11edf15c446a5be18be0014144fcb ->pause_video - >0xIv1RoSXNk |
| EF-ISF Navigation2 Patterns |
| AstronomiaCotidianaGrupoB - >9ee2d4e6ba4f4c8cb5a1aea3b66220a8 -> 83d11edf15c446a5be18be0014144fcb ->load_video - >P2uUPX2y8Ks |
Source: own elaboration.
5. CONCLUSIONS AND FUTURE WORK
With the LexRank with Threshold Algorithm you can determine the EF-ISF navigation patterns of the set of student navigation patterns recorded in the xMOOC tracking.log file of the Open edX platform.
The largest number ∈R in the Stationary Matrix identifies a single EF-ISF navigation pattern, which represents the set of EF-ISF navigation patterns from the set of student navigation patterns recorded in the xMOOC tracking.log file of the Open edX platform.
In the Stationary Matrix, the EF-ISF navigation patterns are represented with a value of ∈R This value indicates the importance of each EF-ISF navigation pattern in the set of EF-ISF navigation patterns.
As future work, we proposed the implementation of LexRank with Threshold Algorithm for the identification of navigation patterns EF-ISF, the set of navigation patterns of students recorded in the xMOOC tracking.log file of the Open edX platform.

