


 English (pdf)
 Article in xml format
 Article references
 Send this article by e-mail
 Cited by SciELO
  Cited by Google
  Similars in
SciELO
Similars in
SciELO  Similars in Google
 Permalink
INTRODUCTION
Currently, various analyses to determine the happiness index can be found, although according to the United Nations (UN), the happiness index could be associated with the human development index (HDI) [1]. Nonetheless, there are almost no references on these happiness indices measured in the university context through artificial intelligence techniques, specifically data mining techniques. The objective of this research is to determine the happiness index (quality of university life) through an objective method and through the use of data mining techniques . This happiness index is associated to the university context of an undergraduate student. Specifically, this index is analyzed in a Colombian public university located in the central region of Colombia. Although some previous studies have calculated this happiness index in other universities, and have even established its relationship to the student's academic performance, it is highlighted that, in the literary reviews carried out, there are no referenced studies where these indices and their relations are calculated through data mining techniques in an objective way.
In Datu et al. [2] a study is carried out in order to determine the happiness index along with the academic performance of a student. In Ramírez and Fuentes [3] a measurement is established between the subjective happiness and the indicators of academic performance and selection in the commercial engineering undergraduate program, using a model of structural equations and minimum square techniques, finding a direct relationship between happiness, academic performance and selection. In a similar sense, in Habibzadeh and Allahvirdiyani [4], a study is developed through correlation coefficients and parametric tests, in order to determine the influence of economic factors on the happiness of elementary school teachers and university profes sors. Similarly, authors such as Kamthan et al. [5] measure happiness among second-grade medical students, through statistical analysis and Chi-square tests, finding as a result that most of these students were happy, and did not smoke or consume drugs or alcohol. It was also found that the percentage of happy men was higher compared to the percentage of happy women.
Additionally, just as the previous authors, there are authors such as Talebzadeh and Samkan [6] where a conceptual model is proposed in order to create happiness in a children's school, based on physical, socio-emotional, individual and instructional factors, finding that positive attitudes of happiness lead to higher academic achieve ment and to be more active citizens. Likewise, Chan et al. [7] quantify the happiness determinants of university students. The study concludes that happiness is associated with a series of factors such as: grades obtained, friendships developed, school facilities, opportunities to participate in extracurricular activities and quality of the class. Similarly, there is another series of influencing factors such as: school work, time management and the relationships formed in the university. In Vigneswaran et al. [8], a measurement of happiness in a university environment is established through the national happiness index with the aim of developing a happiness indicator with the purpose of allowing the calculation of the percentage of people who are happy and to identify key areas where staff and students are unhappy.
In Aziz et al., [9] the relationship between personality and happiness in the academic community is established by investigating the well-being of this community through a survey to measure the affectivity and cognitive state in their life. Placing the community at an intermediate level of happiness. In Oztürk and Mutlu [10] the relationship between desire, well-being, happiness and anxiety among university students is analyzed. This analysis is carried out using a scanning model, and the data is analyzed through the SPSS statistical analysis software. As a result, a positive correlation between well-being and happiness is found, as well as a negative correlation between well-being and anxiety. In the area of education, the human development index has had great importance, influence and significance, and has been applied to all educational levels from elementary school to university levels of education such as: undergraduate, graduate, etc. The aforementioned can be seen in the various references that are related throughout this research work.
In a more general context, in Moeinaddini et al. [11] a new method is proposed to measure the happiness index. A questionnaire and methodology are developed using struc tural equations. In addition, the contribution of each of the individual items is evaluated, in order to establish the association between them as well as the happiness, an aspect that allows the proposal of a new happiness index. Similarly, in Mangaraj and Apa- rajita [12], a study is established in a similar sense to the previous one. Likewise, in Karagiannis and Karagiannis [13] a weighting scheme is proposed in order to construct composite indicators based on Shannon's entropy. Through this methodology, a new estimate of the Human Development Index is established. In Pinar et al., [14] a stochastic analysis is carried out, using an efficiency methodology, in order to study the implicit weights in the dimensions of human development, finding that it is not practical to put the same weight on each index and dimension. In general, the human development index has had great significance and importance.
The human development index is of great importance in many aspects and in various areas, this is how it has been found that this index is related to almost all areas: Pollution (Chen et al., [15]), childhood diseases (Riahi et al., [16], electricity, policies and income (Sarkodie and Adams [17]), mortality in cancer rates (Martínez- Mesa et al., [18]; Veisani, and Jenabi et al., [19]), studies of lead levels in blood (Hwang et al., [20]), renewable energy consumption and economic growth (Wang et al., [21]), strategic planning (Martínez-Guido, et al., [22]), suicides in almost a hundred countries in the world ( Khazaei et al., [23]), sustainability evaluations (Long et al., [24]), pro ductivity and growth factors (Yue et al., [25]), sustainable development index (Hickel [26]), integration of environment and freedom (Biggeri and Mauro [27]). Oppositely, authors such as Zhang and Luo [28] analyze the psychological factors of education from the point of view of data mining. Similarly, in Rong [29] a remote teaching model based on data mining is studied. Likewise, in Lemay et al., [30] a comparison is made between analytical learning and data mining in education. Other related works, where the human development index has been applied, can be found in: Omrani et al., [31], among other authors.
Based on previous existing studies, the incident variables in university happiness and the human development index, a dependent variable called quality of university life (QUL) as well as 10 independent variables are established to measure happiness in university students: Academic load (AL), economic resources (ER), relationship with classmates (RWC), relationship with professors (RWP), curriculum (C), extracurricular activities (EA), current housing (CH), family relationship (FR), emotional state (ES), university environment (UE). It is concluded through a decision tree classification algorithm (J48), which is executed under the automatic learning and data mining platform called Weka with an accuracy higher than 80 %, that the most influential variables in the quality of university life are: University Environment (UE), current housing (CH), emotional state (ES), relationship with professors (RWP). Finding that, many times, the quality of university life can also depend on variables external to the university itself, such as: current housing and emotional state.
Finally, for its presentation, this article contains the following parts: methodology used, subsequently a results section is proposed, where the main causes that establish the quality of life of a university student are established. In the discussion of results, a comparison of this study is made with other similar works referenced in the literature. Finally, the conclusions derived from the results are presented and a list of the main references used is presented.
1. MATERIALS AND METHODS
The methodological development is carried out using the decision tree classification algorithm J48, which is run in the automatic learning and data mining platform, called Weka [32], in order to establish the behavior of the Dependent variable called quality of university life (QUL), based on the 10 independent variables that were measured: Academic load (AL), economic resources (ER), relationship with classmates (RWC), relationship with professors (RWP), curriculum (C), extracurricular activities (EA), current housing (CH), family relationship (FR), emotional state (ES), university environment (UE).
Following the methodology developed in Castrillón et al. [33], this section is structured with the following steps: (1) Definition of the sample size; (2) Design of the survey and collection of information; (3) Construction of the database; (4) Correlation of the variables; (5) Weka platform processing; (6) Prediction of the quality of university life.
Step 1. Definition of the simple size
According to the studies defined in Valdivieso et al. [34], through simple random sampling, the sample size n is defined based on equation 1:
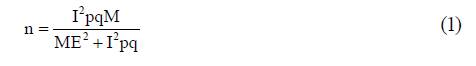
Where: n: Sample size; I: Confidence interval, for an inverted standard normal distribution; p and q: represent the success and failure variations, respectively; M: Student population; E: Sample error.
Step 2. Design of the survey and collection of information
Based on the 10 independent variables and the dependent variable, object of analysis, the survey illustrated in Table 1 is structured. This survey was applied to the population size established as n, defined in equation 1. It is important to highlight that, although n is a statistically valid value, a small number of data is sufficient, when working with Bayesian models (Valencia et al. [35]).
Table 1 Satisfaction level survey. 1 = Excellent, 5 = Terrible
| Variable | 5 | 4 | 3 | 2 | 1 |
|---|---|---|---|---|---|
| Academic load (AL) Economic resources (ER) Relationship with classmates (RWC) Relationship with professors (RWP) Curriculum (C) Extracurricular activities (EA) Current housing (CH) Family relationship (FR) Emotional state (ES) University environment (UE) Quality of univesity life (QUL) |
Source: own elaboration.
Step 3. Construction of the database
The results of the survey defined in Table 1 will allow to define and structure the database illustrated in Table 2.
Step 4. Correlation of the variables
Since it is necessary to discard the independent variables that have a very low or null incidence compared to the dependent variable, as well as the independent variables with a very high incidence, at this point the correlation of each of the independent variables will be calculated against the dependent variable. This process will allow to select those variables with a moderate correlation.
Step 5. Weka platform processing
Based on the data defined in Table 2, the header and body of the .arff fileare structured. They will be analyzed by a decision tree classification algorithm (J48), executed under the automatic learning and data mining platform called Weka.
Step 6. Prediction of the quality of university life
Through a decision tree classification algorithm (J48), the structured file is interpreted in step 5, in order to generate the respective decision tree. This decision tree allows the identification of each of the main causes that influence the quality of university life of an undergraduate student.
2. RESULTS
Step 1. Definition of sample size
The execution of Equation 1 establishes the obtained sample size n = 121. This result is obtained under the following parameters: M = 460; I = 1.2815, confidence interval, obtained with the Excel function for inverted standard normal distribution (0.9); p = 0.5; q = 0.5; E = 0.05 (5 % sampling error, with a 90 % interval).
Step 2. Design of the survey and collection of information
As a result of this process, the survey defined in Table 1 is structured. This survey is applied to a population of 127 students, according to the sample size n defined by Equation 1. The surveyed students were between the ages of 18 and 25, located between the third and tenth semester of the undergraduate degree in Industrial Engineering in a public university located in the central region of Colombia.
Step 3. Construction of the database.
The development of this process is based on the information that was recollected in Step 2, where the database for this information is defined, see Table 3:
Step 4. Correlation of the variables
Using the Excel program, the correlation between each of the independent variables and the dependent variable was calculated as illustrated in Table 4.
Table 4 Correlations in respect to the dependent variable.
| AL | ER | RWC | RWP | C | EA | CH | FR | ES | UE | |
|---|---|---|---|---|---|---|---|---|---|---|
| CVU | 0.49 | 0.53 | 0.58 | 0.54 | 0.39 | 0.33 | 0.65 | 0.62 | 0.64 | 0.69 |
Source: own elaboration.
Table 4, shows that all the independent variables have a moderate correlation with the dependent variable, which explains why the 10 variables are selected to continue with the analysis in this research.
Step 5. Weka platform processing.
The development of this step allows the generation of the respective classification .arff file to be interpreted through the J48 decision tree classification algorithm, from the automatic learning and data mining platform called Weka. Tables 5 and 6 illustrate the header and body of this file respectively.
Table 5 header of the Weka file
| @attribute | AL | numeric |
| @attribute | ER | numeric |
| @attribute | RWC | numeric |
| @attribute | RWP | numeric |
| @attribute | C | numeric |
| @attribute | EA | numeric |
| @attribute | CH | numeric |
| @attribute | FR | numeric |
| @attribute | ES | numeric |
| @attribute | UE | numeric |
| @attribute QUL {“1”,” | 2”,”3”,”4 | ”,”5”} |
Source: own elaboration.
Step 6. Prediction of the quality of university life
The previous interpretation done through the decision tree classification algorithm J48, under the data mining platform called Weka, allows the following decision tree to be generated, which is illustrated in Figure 1. This algorithm is runned with a training distribution - validation of 90 % - 10 % respectively.
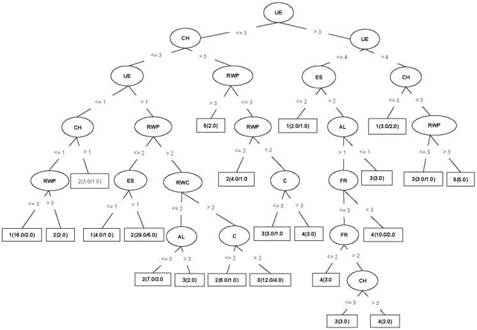
Source: own elaboration.
Figure 1 Decision tree. In all the variables of this tree 1 is Excellent and 5 is Terrible.
Figure 1 shows that a good quality of university life can be found in the following branches of this tree: University_Environment (UE)> 4^ current housing (CH) < = 3^ 1 or University_Environment (UE) = 4^Emotional State (ES) = 1^ 1 or Universi- ty_Environment (UE) = 1 ^Current Housing = 1 (CH) ^Relationship with Professors (RWP) <= 3 ^1 or University_Environment (UE) = 2 or 3 Current Housing <= 3 (CH) Relationship with professors (RWP) <= 2 Emotional State = 1^ 1.
The decision tree illustrated in Figure 1. Allows the prediction of the quality of uni versity life with over an 80 % effectiveness [Table 7]. In addition to this, it is possible to identify in this tree the main influencing variables to the quality of university life: Uni versity environment, current housing, emotional state and relationship with professors.
Table 7 Correct classification percentage
| Correctly Classified Instances | 102 | 80.32 % |
| Incorrectly Classified Instances | 25 | 19.69 % |
| Kappa statistic | 0.74 | |
| Mean absolute error | 0.14 | |
| Root mean squared error | 0.24 | |
| Relative absolute error | 38.91 % | |
| Root relative squared error | 62.46 % | |
| Total Number of Instances | 127 |
Source: own elaboration.
Finally, it is highlighted at this point how it is possible to obtain very good results with the J48 algorithm, in comparison to other similar algorithms, which is why this algo rithm was preferred. This is observed when the training tests are expanded [Table 8]:
Table 8 Comparison with other similar algorithms.
| Technique | Success | Description |
|---|---|---|
| BayesNet | 57 % | https://weka.sourceforge.io/doc.dev/weka/classifiers/bayes/BayesNet.html |
| NaiveBayes | 62 % | https://weka.sourceforge.io/doc.dev/weka/classifiers/bayes/NaiveBayes.html |
| J48 | 81 % | https://weka.sourceforge.io/doc.dev/weka/classifiers/trees/J48.html |
3. DISCUSSION
While 4 main variables are identified as influential for the quality of university life: Uni versity environment, current housing, emotional state, and relationship with professors, when analyzing some branches of the tree illustrated in Figure 1, it is found that sometimes a good quality of university life can depend on variables external to the university itself. For example, the branch University_Environment (UE)> 4 current housing (CH) <= 3 1, indicates that although the university environment is bad UE> 4, if the home where the student lives is good CH <= 3, there is a good quality of university life. In a similar sense, the following branch of the tree can be interpreted: University_Environment (UE) 4 Emotional State (ES) = 1 1. In this case it is observed that although the university environment is bad UE = 4, an excellent emotional state ES = 1, leads to a good quality of university life. It is highlighted that, in the different literary reviews that were carried out, there is no article that illustrates this aspect. Most of the articles associate the happiness of a student with aspects related to the same university.
On the other hand, there are other branches, in the tree illustrated in figure 1, which according to their values lead to a good quality of university life: University_environ- ment (UE) = 1 Current Housing = 1 (CH) Relationship with professors (RWP) <= 3 ^1. In this case, there is a good quality of university life, as expected, since the student has everything to their favor: Excellent university environment UE = 1, excellent home CH = 1, good relationship with professors RWP <= 3. Likewise, when the last branch of the tree, illustrated in the results, is analyzed, a similar analysis is reached: University Environment (UE) = 2 or 3 Current Housing <= 3 (CH) Relationship with professors (RWP) <= 2 Emotional State = 1 1.
4. CONCLUSION
After this research, it is possible to: a) Identify with over an 80 % effectiveness the main influencing causes in the quality of university life: University environment, current housing, emotional state and relationship with professors; b) show that there are influen tial variables in the quality of university life, which are not directly associated to the university: current housing and emotional state; c) design a new methodology, through data mining techniques, for the prediction of university life; use an easy-to-replicate methodology, according to the steps described in it, which allows the transformation of a subjective method into an objective method and d) lay the foundations for a design of new university policies.

