


 English (pdf)
 Article in xml format
 Article references
 Send this article by e-mail
 Cited by SciELO
  Cited by Google
  Similars in
SciELO
Similars in
SciELO  Similars in Google
 Permalink
INTRODUCTION
The effects of salt concentration in soils severely affect crop productivity and produce significant economic losses in the agricultural sector [1]. According to [2], the sali nization process can be caused by natural or anthropic factors or by a mixture of the two. When the anthropic factor is associated with the process, it is called "secondary salinization" [3].
The increase in salt concentration in the soluble phase of the soil makes it difficult for the roots to absorb water and therefore for the crops to develop [4], and alters the dynamics of soil microorganisms [5-6] and animal life [2].
According to [6], approximately 50 % of the world's irrigated areas are affected by secondary salinization. The main factors linked to this process from the point of view of the vulnerability of the soil as an exposed element are: efficiency in the application of irrigation water [7-8]), lack or in of the subsurface drainage systems [9], inappropriate use of fertilizers [10]; climatic factors, especially the precipitation/evapotranspiration ratio [11- 12] and [13], soil texture [14], slope of the terrain [10] and [14], depth of the water level [8-15), and the distribution pattern of irrigation water in the soil [16-17]. Other authors mention factors such as soil cover, proximity to irrigation or drainage channels, and population density [15].
According to [18], at least 12.3 % of Colombia's territory has some level of soil salinization; the most affected areas are located in the Caribbean region and in the inter-Andean valleys of the Magdalena and Cauca rivers, precisely where the medium and large irrigation districts are located [19]. In addition, [18] they noted that 45 % of the territory is susceptible to soil salinization processes. This is a problem that is advancing silently, given that many of the factors associated with the development of soil salinization processes converge in these territories.
The literature presents several models that estimate the risk of soil salinization ([7], [13], [15], irrigation is absolutely essential for obtaining reliable crop yields, particularly under predicted global warming conditions. A simple methodology for assessing the salinisation risk for any water management situation and under predicted global warming conditions is presented. The methodology is illustrated by the assessment of irrigation effects on soil salinity at San Antonio del Sur Valley, in the southeast of Cuba. Irrigation from a new dam will support agriculture in the Valley, but at the same time soil salinity is expected to increase. Soil electrical conductivity at several depths and topographical altitudes were used to create raster layers in a Geographic Information System (GIS [20], [21], [22] and [23]electrical conductivity, and consequently leaching requirements, were higher for surface water than for groundwater. A relative crop yield of 90 % can be achieved in 23 % of the area irrigated with surface water, meanwhile with groundwater a 90 % of relative yield can be achieved in 36.7 % of the irrigated area with leaching fraction (LF). The particularity of the models consulted is that they do not separate the elements of risk, hazard and vulnerability. In other words, these models carry out a joint analysis of these elements. Several authors have indicated that risk management requires the clear identification and delimitation of hazard and vulnerability [24]. This differentiation will allow for the comprehensive and effective planning of prevention, mitigation and recovery actions.
In accordance with the provisions of Law 1523 of 2012, which established risk management as the basis for planning in Colombia, and with the Sustainable Soil Management Policy [25], which has a specific strategic line for “Strengthening ins truments for environmental and sectoral planning”, the objective of this paper was to propose a tool for assessing the vulnerability of soils to salinization in irrigation districts in Colombia, as a complement to the tool for assessing the hazard of soil salinization proposed by [26], which focuses on irrigation water quality.
1. MATERIALS AND METHODS
Given the characteristics of the problem addressed, the integration of two world- renowned tools was proposed: Multicriteria Analysis and Geographic Information Systems [27]. This integration of methods allowed the use and spatial distribution of qualitative and quantitative parameters. The methodological phases developed are described below.
Identification of vulnerability parameters: This phase was carried out by reviewing the literature on the factors that trigger soil salinization processes in irrigated areas. This analysis was limited to flat and slightly undulating areas of Colombia.
Categorization and normalization of vulnerability parameters: Vulnerability categories were proposed according to the relationship of each parameter and the vul nerability. A value between 0 and 1 was assigned to each category. The categories that represent the condition of greatest vulnerability in each parameter received values close to one. Otherwise, they received values close to zero.
Assignment of weights or degrees of importance to vulnerability parameters: The specific method used was the Analytic Hierarchy Process [28]. The process of assigning weights was carried out in consultation with eighteen professionals related to the subject. Each expert made a paired rating of the previously defined vulnerability parameters. The values scale used is presented in Table 1.
Table 1 Values scale for paired comparison
| Numerical scale | [30]Definition |
|---|---|
| 1 | [33]Equal importance of one element over the other |
| 3 | [36]Moderate importance of one element over the other |
| 5 | [39]Strong importance of one element over the other |
| 7 | [42]Very strong importance of one element over the other |
| 9 | [45]Extreme importance of one element over the other |
Source: [29].
The consistency ratio of the group vector was estimated as proposed by Jaiswal et al. [30], and 10 % was established as the maximum permissible value.
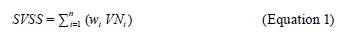
SVSS estimation and spatial distribution: The Simple Additive Weighting method [31] adapted to perform the spatial distribution of the results was used for the cons truction of the SVSS. The general expression applied is presented in Equation 1 [32].
Where,
SVSS: Soil Salinization Vulnerability Index
W: Weight of vulnerability parameter i
VN: Normalized value of vulnerability parameter i
The vulnerability categories were mapped generating three SVSS ranges. Low category for SVSS values between 0-0.33; Medium for SVSS values between 0.33-0.66 and High for SVSS values greater than 0.66.
Application in case study: The model was applied to the Land Adjustment District of the municipalities of Roldanillo, La Unión and Toro (RUT). This district is the largest in southwestern Colombia (10300 ha). [33] reports indicated that this zone has areas with medium to high salinity indicators. Recently [18] presented figures of medium to high susceptibility in the geographic valley of the Cauca River. On the other hand, [26] found medium levels of soil salinization hazard in the soluble phase due to the quality of the irrigation water.
The estimation and mapping of the SVSS was carried out using the “Raster Calculator” tool of the ArcGIS software. This tool allowed the application of the para metric equation resulting from the assignment of weights or degrees of importance of the parameters for each pixel or minimum unit of analysis.
2. RESULTS
Parameters identified: According to the literature review, the parameters applicable to the Colombian context were selected and are described below:
Soil texture: To the extent that the same soil allows the movement of water to deeper strata or to drainage infrastructure, in the event of precipitation, or an extra layer of salt wash, the effect will be satisfactory. In this sense, and according to [34], soil texture is directly related to vulnerability, since it is directly linked to the movement and storage of water.
Depth of the water level: If subsurface drainage is available, the depth of the water level may be lowered; if there is no underground drainage, the natural capacity of the soil to percolate may be interrupted or prevented by the water level [14].
P/ETo ratio: The natural water balance (inputs and outputs) in a specific area defines in part the level of vulnerability of the soil to salinization processes in the soluble phase. If, in a study zone, precipitation exceeds the potential evapotranspiration rate, the concentration of salts decreases due to the increase of water in the soil profile. On the other hand, if potential evapotranspiration is greater than precipitation, there will be a higher concentration of salts in the soil, since the amount of water in the soil decreases and the salts are conserved [13].
Slope of the land: The slope of the land where irrigation water is applied is directly related to the natural drainage capacity and influences the accumulation of salts in the liquid phase of a productive soil. Thus, the steeper the slope, the less vulnerable it is to salinization processes [10].
Drainage infrastructure: The infrastructure available to evacuate water (from rain or washing) at the surface and subsurface levels is closely related to the susceptibility of an irrigated soil to the accumulation of salts in its productive horizon. Thus, not having this infrastructure increases the vulnerability of an irrigated area to salinization [9].
Distribution pattern of irrigation water in the soil: This parameter takes into account the distribution of salts in the soil, as a result of the distribution of water in it. Some irrigation methods favor the concentration of salts in specific areas, such as drip irrigation, which due to its characteristics concentrates the salts in the wetting zone (wet bulb) that generally coincide with the effective roots of the plants. These methods represent high vulnerability to salinization. Irrigation methods such as sprinkler and micro-sprinkler, distribute with greater uniformity the water applied, and also the salts contained in the irrigation water, representing low vulnerability from this analysis parameter. Finally, surface irrigation methods generate salt concentration in larger areas than those of drip irrigation, which is why it is classified as medium vulnerability [16-35].
Irrigation water application efficiency: Irrigation water application efficiency is directly related to the application method and this, in turn, to the volume of water applied in each irrigation. The greater the volume of water applied, the greater the amount of salt applied to the soil [7-8], and [36].
Fertilization practices: As mentioned above, most fertilization products contain salts, which are required by the plants for their development, but if applied in quantities exceeding that need, they will encourage the accumulation of salts in the soluble phase of the soil and possibly in the exchange phase [3], [10]. The way in which fertilization is carried out indicates the level of vulnerability of a soil to salinization processes.
Categories and standardisation: Table 2 presents the categorization and normalized values (VN) of each identified vulnerability parameter.
Table 2 Categorization and normalization of vulnerability factors
| Factor | [72]Category | [73]VN | [74]References |
|---|---|---|---|
| [77] | Coarse | [78]0 | [79]|
| Soil texture | [82]Medium | [83]0,5 | [84][37] |
| [87] | Fine | [88]1 | [89]|
| [92] | >1 | [93]0 | [94][11], [12], [21] |
| [97] | 0,85 - 1 | [98]0,2 | [99]|
| [102] | 0,75 - 0,85 | [103]0,4 | [104]|
| Ratio (P/ETo) | [107]0,5 - 0,75 | [108]0,6 | [109]|
| [112] | 0,2 - 0,5 | [113]0,8 | [114]|
| [117] | <0,2 | [118]1 | [119]|
| [122] | >12 | [123]0,25 | [124]|
| [127] | 7-12 | [128]0,5 | [129][10], [14] |
| Slope of the land (%) | [132]3-7 | [133]0,75 | [134]|
| [137] | 0-3 | [138]1 | [139]|
| [142] | Surface and subsurface drainage | [143]0 | [144][9] |
| Drainage infrastructure | [147]Surface Drainage | [148]0,5 | [149]|
| [152] | No drainage | [153]1 | [154]|
| [157] | 3-10 | [158]0 | [159]|
| [162] | 1,5-3 | [163]0,33 | [164][8], [15] |
| Depth of water level (m) | [167]0,5-1,5 | [168]0,66 | [169]|
| [172] | 0-0,5 | [173]1 | [174]|
| [177] | No irrigation | [178]0 | [179]|
| [182] | Sprinkling | [183]0,25 | [184]|
| Distribution pattern of irrigation water in the soil | [187]Surface area | [188]0,5 | [189][16] |
| [192] | Surface drip | [193]0,75 | [194]|
| [197] | Underground drip | [198]1 | [199]|
| [202] | Very suitable | [203]0,2 | [204]|
| [207] | Suitable | [208]0,4 | [209][38] |
| Fertilization practices | [212]Moderately suitable | [213]0,6 | [214]|
| [217] | Unsuitable | [218]0,8 | [219]|
| [222] | Very unsuitable | [223]1 | [224]|
| [227] | No Irrigation | [228]0 | [229]|
| [232] | Underground Drip | [233]0,25 | [234]|
| Irrigation water application efficiency | [237]Surface drip | [238]0,5 | [239][16] |
| [242] | Sprinkling | [243]0,75 | [244]|
| [247] | Surface | [248]1 | [249]
Source: own elaboration.
Weighting:Table 3 presents the weights obtained in the expert consultation process for the vulnerability parameters. The group consistency ratio obtained was 2.52 %.
Table 3 Weights obtained for the parameters
| PARAMETER | [257]WEIGHTS |
|---|---|
| Aridity Index (IA) | [260]19.76 % |
| Soil texture (T) | [263]18,24 % |
| Fertilization practices (F) | [266]15.34 % |
| Drainage infrastructure (D) | [269]11.93 % |
| Depth of water level (NF) | [272]11.75 % |
| Water application efficiency (Ea) | [275]7.99 % |
| Water distribution pattern (Pd) | [278]7.77 % |
| Slope of the land (P) | [281]7.21 % |
| Total | [284]100.00 % |
| Maximum | [287]19.76 % |
| Minimum | [290]7.21 % |
| STANDARD DEVIATION | [293]4.86 % |
Source: own elaboration.
The specific expression resulting from this analysis for the calculation of SVSS on any one pixel is presented in equation 2.

Where,
IAN: Normalized value of the aridity index
TN: Normalized value of soil texture
PFN: Standardized value of fertilization practices
IDN: Normalized value of drainage infrastructure
NFN: Normalized depth of water level
EaN: Standardized value of water application efficiency
PdN: Normalized value of the irrigation water distribution pattern
PN: Normalized value of the land slope
Case study: The mapping of the vulnerability parameters of the case study (RUT District) was carried out through analysis of primary and secondary information. Table 4 briefly presents the procedure followed in each case.
Table 4 Mapping methods
| PARAMETER | [312]MAPPING METHOD |
|---|---|
| Soil texture | [315]It was obtained by recoding information from the semi-detailed study of soils from the Geo graphic Valley of the Cauca River [33] and the semi-detailed study of hillside soils [39]. |
| P/ETo ratio | [318]Deterministic interpolations were made from official IDEAM precipitation and evaporation data [40]. ETo was estimated using the evaporimeter tank method [41]especially when drought oc curs. The evaporation rates measured in buried tanks (20 m2 evaporimeters. |
| Slope of the land | [321]A slope raster was generated with the ArcGis 10.7.1 software Slope tool. The input was a digital elevation model provided by CVC (Pixel size 2.5m x 2.5m) |
| Drainage Infrastructure | [324]The district's infrastructure plans were consulted. Verification was carried out through field visits. |
| Depth of Water Level | [327]Raster layers were generated (Ordinary Kriging Interpolation) from interpolation of measured data (3 periods) in artisanal cisterns [42]. |
| Irrigation Water Application Efficiency and Distribution Pattern | [330]A property irrigation method map was generated from information provided by ASORUT. |
| Fertilization practices | [333]One hundred surveys were applied to farmers. Fertilization practices were classified accord ing to Salinity Index of products applied, method of application, number of doses per growing season and criteria used to define application rates. |
Source: own elaboration.
Figure 1 shows the spatial distribution of the normalized values of the vul nerability parameters. Figure 2 presents the spatial distribution of the established vulnerability categories.


3. DISCUSSION
The weights obtained range from 7.21 to 19.76 %. The factors rated with the first three scores include one internal or intrinsic (Texture) and two external (Aridity Index and Fertilization Practices). Viewed differently, the first three scores have two biophysical factors (Soil Texture and Aridity Index) and one anthropic factor (Fertilization Practices).
It should be noted that, the factors related to irrigation and drainage were qualified with weights below the average (Drainage Infrastructure, Water Application Efficiency and Irrigation Water Distribution Pattern).
In the models reviewed, the Aridity Index was found to be one of most important among the three [13], [15], [21]. With the parameters “Soil texture” and “Depth of Water Level” a similar situation is presented [7], [13], [15]. The parameter associated to the fertilizer supply presents a minor degree of importance in the model presented by [15].
The factors Irrigation Water Application Efficiency and Slope of the land are considered by authors like [15], [20], [22] and Triantafilis [43] but with weights lower than 5 %.
As for the SVSS values obtained, Figure 1 indicates that the parameters with the highest normalized values are Soil texture, Application efficiency and Slope. Of these three, the one with the highest weight in the index equation is texture, the others have weights below the average.
The Fertilization Practices parameter has medium to high normalized values. The weight of this parameter in the SVSS equation is high. The Aridity Index (P/ETo) has low normalized values in the central zone and medium values to the south and north. This is the parameter with the greatest weight in the SVSS equation.
The parameters Water level and Irrigation water distribution pattern have medium and low values in most of the territory and small areas with high values (greater than 0.66). The Drainage Infrastructure parameter has medium values (0.5) in the entire area studied.
On the other hand, in Figure 2 it was identified that 0.3 % of the study area presents low vulnerability. The following characteristics converge in these areas: Medium textures, High slope and average values of the Aridity Index. These areas are located at the foot of the Western Cordillera of Colombia and on the strip parallel to the Cauca River in the east of the district.
The zone classified as having medium vulnerability represents 71.8 % of the study area. These zones have characteristics such as: medium to high values of Ea, medium adequate fertilization practices, Freatic levels between 1.5 and 3.0 meters and medium values of IA. In addition to the above, these areas have slopes of less than 3 % and heavy textures.
27.9 % of the district presents high vulnerability. These areas are located mainly in the southern and northern zones. In the central zone there are two focal points with this category. The characteristics of these areas are: Slope less than 3 %, heavy textures, inadequate fertilization practices, low irrigation water application efficiencies and medium to high values of Aridity Index.
4. CONCLUSIONS
The model generated allows the identification and zoning of categories of soil vul nerability to soluble phase salinity in irrigated areas and complements the model for identifying the soil salinization hazard by water quality proposed by [26].
The proposed model considers parameters of analysis specific to the natural and anthropic zones under irrigation in Colombia, which allows for a comprehensi ve assessment of vulnerability to the processes of salinization of soils in the soluble phase.
The weights or degrees of importance of the vulnerability parameters that admit some type of management add up to 74.54 % (Aridity Index, Drainage Infrastructure, Fertilization Practices, Irrigation Efficiency, Soil Water Distribution Pattern and Depth of the Water Level) indicating the important possibility of reducing vulnerability through investments and management actions.
The results obtained for the case study allow us to conclude that the parameters that present an opportunity to diminish the Medium Vulnerability at a lower cost are the adequate irrigation programming (associated to the Aridity Index), optimiza tion of Fertilization Practices and increase of irrigation water application efficiency. Drainage Infrastructure would contribute significantly (11.93 %) but requires high investments.

