


 English (pdf)
 Article in xml format
 Article references
 Send this article by e-mail
 Cited by SciELO
  Cited by Google
  Similars in
SciELO
Similars in
SciELO  Similars in Google
 Permalink
INTRODUCTION
Carbon steel is a material commonly used for the manufacturing of structural compo nents in marine environments [1]. Low carbon steels are used for general applications due to their weldability and low cost [2]. It possesses exceptional mechanical pro perties that make it preferable as a construction material compared to other types; however, the exposure to high humidity, chloride rich salty environments and tempe rature variations can accelerate its degradation [3]-[5]. Marine corrosion is hostile, mainly because of the seawater high chloride concentration and low electrical resis tivity. Surface coating is a surface engineering process used to achieve the desired properties of a material only on the surface without altering the core. Nowadays, the most advantageous surface protection treatment employed for carbon steel is the coating process with corrosion resistant materials [6]. Recently, ceramic coatings have been applied on the surface of the steel to improve corrosion resistance under aggressive environments such as the marine. Likewise, other options such as meta llic and organic coatings have been applied, yet, they cannot be compared with the ceramic coating performance under aggressive conditions, especially at elevated temperatures [5]-[7]-[8]. Different techniques or processes such as the chemical va por deposition (CVD), physical vapor deposition (PVD) and sol-gel are used for the application of ceramic coatings on metallic alloys [9]-[11].
On the other hand, thermal spraying consists of a group of coating manufacturing processes in which finely divided metallic or non-metallic materials are deposited in a molten or semi-molten condition to form a coating. Flame spraying is one of the thermal spraying techniques most widely used for thick coating because of its low cost. In this process, the feedstock material is sprayed in the flame produced at the nozzle of a spray torch oxidation of a combustible gas. The flame simultaneously heats the feedstock material to the partial or total melting and is spreaded towards the substrate, where the particle deforms to generate a splat. The stacking of multiple splats forms the coating [12]-[13]. The corrosion resistance and mechanical properties of flame spraying ceramic coatings depend primarily on the microstructural features [7],
. The microstructures of the coatings applied through the flame spraying technique are usually inhomogeneous. This non-homogeneity is due to different defects (pores, cracks, unmelted particles, among others) generated during the manufacturing process. These defects provide a way for aggressive ions to diffuse through the coating and reach the substrate, impairing the coating performance [7]-[8]. Chromium oxide (Cr2O3) coatings have been evaluated as possible protective ceramic coatings for different substrates and these have been found to enhance their corrosion and wear properties [15]. Furthermore, Cr2O3 coatings exhibit an excellent protective capacity on metal exposed to acid and high chloride concentration environments [16]. Generally, these are used in marine industries as corrosion resistant materials on different components [14]. Given that the melting temperature of chromium oxide, which is around 2435 °C, plasma spray has been the most utilized thermal spray process to deposit these coatings, however, it is expensive due to the procedure parameters. In recent years, ceramic coatings with a high melting point such as carbides and oxides have been produced by flame spraying, with promising protective results against aggressive environments, high temperatures, and wear conditions [17]-[20].
In this paper, chromium oxide coatings were obtained through the flame spraying technique by using two different flames on carbon steel substrates. Moreover, the protective capacity of these coatings was assessed by electrochemical techniques in chloride solutions under various exposure times at room temperature. The results of different coatings were correlated with the microstructural characteristics such as po rosity, microcracks and interfacial defects to evaluate whether the proposed chromium coatings could be used in structural components exposed to marine environments.
1. MATERIALS AND METHODS
MEC 707TM (Metallizing Equipment Co.) was used to fabricate the coatings through flame spraying. This powder is composed of chromium oxide (Cr2O3). The phases, particle size distribution and morphology of the feedstock powder were determined by X-Ray Diffraction (XRD), Laser Diffraction and Scanning Electron Microscopy (SEM). The XRD pattern was recorded with a D8 ADVANCE BRUKER diffractometer operating in DaVinci geometry. Master Sizer 2000 equipment and QUANTA FEG 650 microscope were used to evaluate the particle size distribution and the morphology of the powder, respectively.
AISI-SAE 1020 steel bars of 25.4 mm in diameter and 8 mm thickness were used as the substrates. These were blasted with corundum jet particles to eliminate oxides and other impurities, in addition to providing an arithmetic average roughness (Ra) higher than 5 pm. This roughness is required to ensure the sprayed particles good adhesion when they reach the substrate. The average particle size for corundum was 610pm. Subsequently, the substrates were cleaned with ethanol in an ultrasonic bath to remove the residues from the surface preparation. Optical Emission Spectrometry (OES) using a Bruker Magellan Q8 was used to verify the chemical composition of the substrate.
Chromium oxide coatings were manufactured by oxy-fuel thermal spraying with a neutral (almost stoichiometric) and an oxidizing flame, using a MEC POWDER FLAME SPRAY system integrated with a POWDERJET-86-II gun, a PF-700 powder feeder, and XY Gun manipulator to control the torch movement. A mixture of 22 L/min of acetylene and 37 L/min of oxygen was used to manufacture the coatings with a neutral flame, while 22 L/min of acetylene was mixed with 70 L/min of oxygen to produce the oxidizing flame. In all cases, the acetylene and oxygen pressures were 0.10 and 0.34 MPa, respectively. Feedstock powders were injected into the flame at a rate of 21 g/min, using 15 L/min of nitrogen as the carrier gas with the pressure of 0.13 MPa. The substrates were located 90 mm in front of the torch. While the surface of the substrates was preheated at 300 °C employing two (2) passes with the torch, the powders were sprayed for three (3) passes, all of that using a torch speed of 50 mm/s. Additionally, an air jet at a pressure of 0.13 MPa was applied with the flame to accelerate melted or semi-molten particles toward the substrate. Accordingly, the codes assigned to the samples were (N1) to the neutral and (O1) to the oxidizing flame.
The thickness of the coatings was assessed along with their cross-section was assessed by analyzing the images obtained through scanning electron microscopy (QUANTA FEG 650). The ASTM E2109 standard was used to determine the coating porosity [21]. Finally, the surface roughness of the coating was determined using a commercial rugometer.
The protective capacity of the coatings was studied in a 3.5 %wt NaCl aqueous electrolyte using a GAMRY Interface 1000™ Potentiostat/Galvanostat. The potentiostat was connected to three electrochemical cell electrodes. Saturated calomel electrode (SCE), platinum wire and the coated samples were used as the reference, counter and working electrodes, respectively. The electrochemical measurements were made by exposing 1 cm2 of the coated surface sample to brine. Electrochemical Impedance Spectroscopy (EIS) tests were carried out according to the ASTM G106-89 standard [22]. An alternating current (AC) signal amplitude of 10 mV was applied with a frequency range between 10 kHz and 0.001 Hz. The tests were completed at the corrosion potential while exposing the coated surfaces to salt water during 24, 168, 336, 504, and 672 h. The EC-LAB™ soft ware was used for data analysis. The samples were polarized from -300 mV to +300 mV versus open circuit potential (OCP), with a scan rate of 0.167 mV/s. The parameters needed to calculate corrosion rates were determined with the Tafel Extrapolation Method. The experiments were performed in triplicate. Additionally, the surface interaction of the coatings to a saline solution was evaluated through the measuring of the contact angle. The system for measuring the contact angle was based on the Dataphysics OCA 15 EC video, where a 3.5 wt% NaCl solution with a drop rate of 0.10 pL/s was used as the liquid.
2. RESULTS AND DISCUSSION
2.1 Material characterization
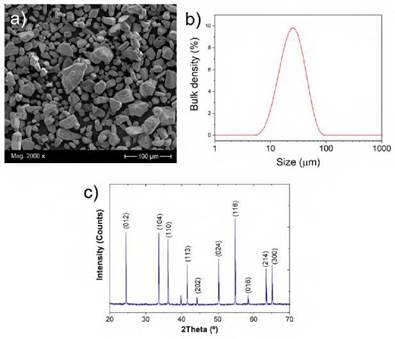
The chemical composition of the substrate was determined by Optical Emission Spec trometry (OES). The results indicated that the material used in this study corresponds to a low carbon steel with 0.21 %wt. C, 0.56 %Mn, 0.002 %S, 0.21% Si 0.009 %P and iron. On the other hand, the powder used for the fabrication of the coatings on the carbon steel was characterized, as seen in Figure 1. SEM image of the Cr2O3 powders exhibited an irregular shape particle, with some fracture marks and without agglome ration as shown in Figure 1a. The XRD powder phase analysis revealed a crystalline phase of Cr2O3 (Eskolaite), Figure 1c. The irregular shape particles with rounded edges are owned to the manufacturing process by fracture and wear caused between them, which is characteristic of the autogenous milling process [23]. Figure 1b shows the particle size distribution of the feedstock powder used with parameters of d10=13.6 ^m, d50= 26.7 ^m and d90=51.8 ^m. Particle size plays a crucial role on their melting in the flame, then on the homogeneity and corrosion resistance of the coating [24].
2.2 Microstructure of coatings
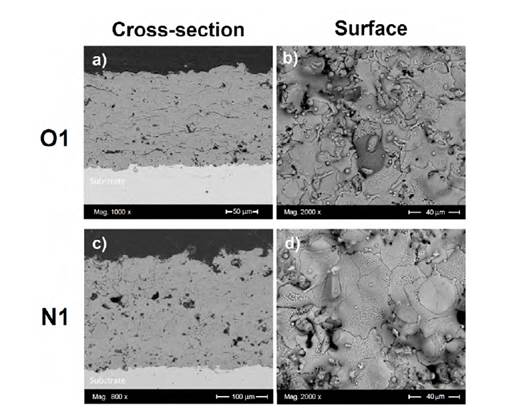
Figure 2 presents typical cross-sectional and surface morphologies of coatings elaborated by thermal spraying. The cross-sectional morphology is characterized by microcracks (included at the inner boundaries), pores, and lamellas (Figu re 2a and 2c). The cross-sectional analysis of the Cr2O3 coating obtained under oxidizing conditions (sample O1, Figure 2a) shows that it is relatively denser than the coating elaborated under neutral conditions (sample N1, Figure 2c). Moreover, the thickness values obtained in the samples O1 and N1 were close to 114 and 214 ^m, respectively, as presented in Figures 2a and 2c. These figures clearly show that the thickness of the coating in sample N1 is greater in contrast to sample O1. In sample N1, the neutral flame reaches the highest temperature with a primary zone of shorter length, which has the hottest zone in the flame, and is not able to melt a large number of particles. On the contrary, the oxidizing flame has a larger primary zone which allows a longer travel or residence time of the particles within the flame, making them able to melt in a greater particle quantity, generating flattened lamellas in the sample O1 [25]. This is the main reason sample O1 thickness is less compared to sample N1, resulting in a denser structure. This is also reflected in the porosity measurement where the O1 coating (2.5 ± 1 %) presented a smaller porosity percentage than the N1 coating (4.5 ± 0.4 %), making sample O1 slightly denser than the N1 sample.
On the other hand, Figures 2b and 2d show the surface of the O1 and N1 coatings, respectively. The “splats” are a typical structure on the surface of the coating which can present internal microcracks as shown in Figures 2b and 2d. Those splats are the output of the rapid solidification of the molten or semi-molten droplets which impinge on a substrate. The coating is built up by successive impingement and inter-bonding among the “splats” [26]. It is important to note that the sample N1 surface has a greater number of cracks within the splats compared to sample O1, and this can affect the behavior of the coating to the permeation of an aggressive solution leading to an increase in the substrate degradation rate.
2.3 Electrochemical corrosion tests
2.3.1 EIS analysis at different times
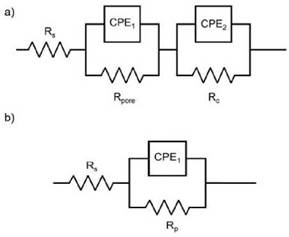
The EIS results obtained from Cr2O3 samples in the electrolyte 3.5 %NaCl solution at room temperature, are presented as Nyquist and Bode plots in Figures 3 and 4, respecti vely. The experiments were conducted after 24, 168, 336, 504, and 672 hours of exposure. The EIS coating plots were simulated by the equivalent circuit models shown in Figure 5. Figure 5a shows the equivalent circuit model has been previously used in different studies to fit the EIS data of ceramic coatings deposited by thermal spray and tested in chloride solutions [7]-[15]-[27]. The model consists of the solution resis tance (Rsol), the pore resistance (Rpore), the charge transfer resistance (Rc) and constant phase elements (CPE1 and CPE2). The polarization resistance (Rp) parameter was defined as the sum between the Rpore and Rc. This parameter is proportional to the protective capacity of the coatings. CPE1 and CPE2 are described as an imperfect capacitor and depict the electrolyte-coating and coating-substrate interface, respectively [15]-[28]. Equally, simple equivalent circuits were fitted to the carbon steel (CS) experimental data to achieve the polarization resistance (RP), as shown in Figure 5b.
The CPE impedance is expressed by Equation 1:
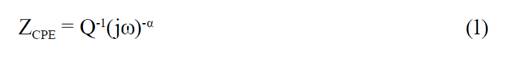
Where j is the imaginary unit, Q is the CPE constant, o is the angular frequency (rad/s) and a is the CPE exponent index [15]-[28]-[29]. This equation can describe the impedance of a pure capacitor C for a Q=C condition and exponent a =1. For the case where a =0, the equation describes the impedance response of an ideal resistor with Q=R [15]-[30]. If a =0.5, it is indicative of a diffusion controlled process that is feasible to find in coatings with high porosity [31]. Many authors have used CPE for the deviations of an ideal resistor and capacitor in response to different physical phenomena, such as inhomogeneity and surface roughness, which are commonly present in the microstructure of ceramic coatings [7]-[8]-[15]-[27]-[28]-[32]-[33].
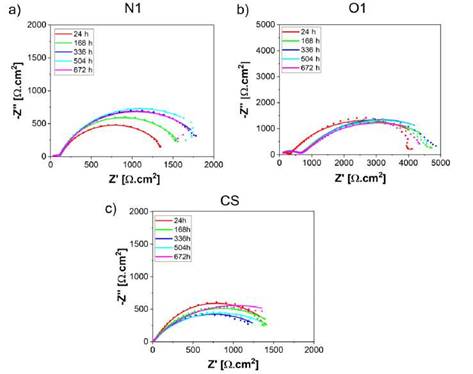
Figure 3a, 3b and 3c shows the influence of the exposure time on the electroche mical impedance response of the Cr2O3 coatings and carbon steel (uncoated) evaluated in sodium chloride solutions. A short capacitive loop appears in the high frequencies zone of the coated samples followed by a large one at low frequencies. The semi-circle loop at the higher frequency is caused mainly by solution resistance while at lower frequency by capacitance. A Nyquist spectra trend was found showing an increase in the Rp values over time. This parameter (Rp) is proportional to the corrosion resistance and is represented by a semicircle in the section of impedance at low frequencies. However, a slight decrease in Rp with the exposure time was evidenced for the O1 and N1 specimens after meeting the maximum values 5857.9 ± 121 Qcm2 at 336 h and 2059.4 ± 159 Qcm2 at 504 h of exposure time respectively, indicative of corrosion resistance loss of the coatings, which could have resulted due to the detachment from corrosion products of the coating surfaces. The differences of polarization resistance values between O1 and N1 samples are mainly attributed to the degree of permeability in the coatings by the type of flame employed. Likewise, it is important to underline that carbon steel (CS) exhibited a similar behavior to the N1 coatings at 672h of exposure.
Source: own elaboration
Figure 3: Nyquist plots of samples evaluated in 3.5 %wt NaCl at different immersion periods: (a) O1 (b) N1.
The corrosion parameters obtained from fitting the data to the equivalent circuit are shown in Table 1.
Table 1: Properties of coatings and electrochemical measurements in 3.5 wt %NaCl solutions at different immersion periods.
| Sample | [58]Thickness (pm) | [59]Porosity (%) | [60]Time (h) | [61]Rs (Q.cm2) | [62]Rpore (Q.cm2) | [63]Rc (Q.cm2) | [64]Rp (Q.cm2) |
|---|---|---|---|---|---|---|---|
| [67] | [68] | [69] | 24 | [70]20.36 | [71]325.80 | [72]4685 | [73]5010.8 |
| [76] | [77] | [78] | 168 | [79]70.31 | [80]708.40 | [81]4498 | [82]5206.4 |
| O1 | [85]114 | [86]2.5 | [87]336 | [88]71.46 | [89]769.90 | [90]5088 | [91]5857.9 |
| [94] | [95] | [96] | 504 | [97]72.30 | [98]790.40 | [99]4846 | [100]5636.4 |
| [103] | [104] | [105] | 672 | [106]71.50 | [107]771.10 | [108]4678 | [109]5449.1 |
| [112] | [113] | [114] | 24 | [115]27.02 | [116]102.80 | [117]1313 | [118]1415.8 |
| [121] | [122] | [123] | 168 | [124]26.13 | [125]98.56 | [126]1547 | [127]1645.6 |
| N1 | [130]214 | [131]4.5 | [132]336 | [133]26.04 | [134]98.00 | [135]1786 | [136]1884.0 |
| [139] | [140] | [141] | 504 | [142]26.60 | [143]100.40 | [144]1959 | [145]2059.4 |
| [148] | [149] | [150] | 672 | [151]27.27 | [152]103.60 | [153]1843 | [154]1946.6 |
| [157] | [158] | [159] | 24 | [160]7.27 | [161]- | [162]- | [163]1870.3 |
| [166] | [167] | [168] | 168 | [169]6.76 | [170]- | [171]- | [172]1592.4 |
| CS | [175]- | [176]- | [177]336 | [178]6.13 | [179]- | [180]- | [181]1525.1 |
| [184] | [185] | [186] | 504 | [187]4.84 | [188]- | [189]- | [190]1686.4 |
| [193] | [194] | [195] | 672 | [196]4.18 | [197]- | [198]- | [199]2076.2 |
Source: own elaboration
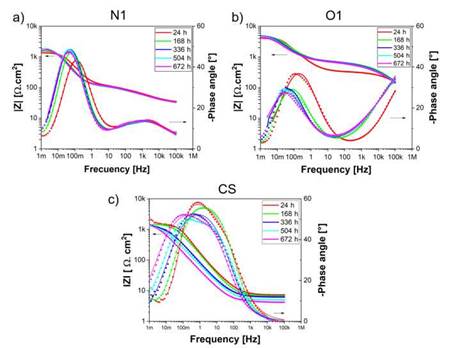
An alternative method for impedance data representation is the Bode plot where, log |Z| is plotted vs log o. Figure 4 shows the Bode plots of the coatings and carbon steel for different exposure times. Z' represents the real part and Z” means the virtual part. The impedance modulus is defined as [34]:

At a low frequency, the maximum impedance modulus |Z| of the N1 coatings is 1912 ± 42 Qcm2 at 504 h and the minimum value is 1420 ± 38 Qcm2 at 24 hours of exposure in the brine solution. Similarly, for the O1 coatings values of |Z| around 4863 ± 56 Qcm2 and 4021 ± 65 Qcm2 at exposure times of 336 and 24 hours were found, respectively. Finally, the carbon steel exhibited values of maximum |Z| near of 2311 ± 73 Qcm2 at 24 hours and the minimum |Z| around 1269± 38 Qcm2 at 504 hours of exposure. Previous results validate the information found in relation to the Nyquist diagrams and the simulations conducted for the determination of the different electrochemical parameters as shown in Table 1. Otherwise, the coating microstructure is crucial in the perfor mance of protection capacity due to the compacting and porosity percentage, which is directly controlled by the flame and spraying distance used. Likewise, the quantity and diffusion mechanism of the corrosion products formed as a consequence of ag gressive ions is another phenomenon responsible for increasing the impedance value, as reported by López-Ortega et al. [3].
In addition, another method for plotting impedance data includes the phase angle
The variations of phase angles are directly related to the coating behavior in terms of the capacitance and resistance and may indicate the performance of the coatings [35]. Figure 4a shows the phase angle as a function of the frequency for the N1 coatings. A semicircular loop of 5Hz and 1mHz, with a maximum phase angle S of (-48°) was found for the N1 coatings under exposure times of 168, 336, 504 and 672 hours. However, for a time of 24 hours, the semicircular loop exhibited a small shifting at higher frequencies with a maximum phase angle of (-42 °).
Conversely, the phase angle obtained for the O1 coatings after exposure to the electrolyte at different times is presented in Figure 4b. Two-time constants can be observed at different frequency ranges. Whereas the first constant at the high frequency is attributed to the solution resistance (Rsol) and may indicate the coating performance in a later state, the second constant at the lower frequency is associated with the coating ca pacitance [35]-[36]. The maximum phase angle was found at 24 hours with a value about (-36 °) and a frequency range between 100 Hz and 1 mHz. For longer exposure times, S had a stationary value of (-29 °) and a frequency range between 10 Hz and 1 mHz. This shifting and decrease in the phase angle in the direction of the lower frequency is related to the active corrosion process at the coating/solution interface and the accumulation of corrosion products, serving as a barrier for the passage of the chlo ride ions towards the carbon steel [36]. It is pertinent to highlight that the carbon steel exhibited the maximum phase angle S at 672 h of exposure, owing to the increase of the corrosion products on the surface, resulting in a rise of the protective capacity of the generated layer.
While comparing the Nyquist and Bode results for the samples N1 and O1, the existence of differences in the protective mechanisms and the electrochemical behavior of the coatings can be observed, situation that, could be associated with the penetration of chloride ions, oxygen and water molecules, which lead to the formation of defects or inhomogeneities (pores, microcracks, unmelted particles, etc.) [37]. Particularly, the N1 coatings presented a more capacitive behavior, contrary to what happened with O1 coatings which showed a more resistive tendency.
Source: own elaboration
Figure 4: Bode plots of samples evaluated in 3.5 % wt NaCl at different immersion periods: (a) O1 (b) N1.
Source: own elaboration
Figure 5: Equivalent circuits for metals coated by flame spraying tested in chloride solution: (a) Equivalent circuit model with two- time constants (b) Simple equivalent circuit with one time constant.
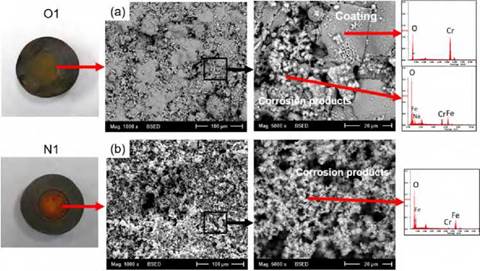
Figure 6 shows the corrosion products generated on the surface of the O1 and N1 coatings after 672 h of immersion. The presence of corrosion products in the O1 coatings was lower compared to the N1 coatings samples, as proved in the SEM results. The EDS analysis of the corrosion products evinced mostly the presence of iron and oxygen. Sodium is shown in the EDS spectra since the coatings were exposed to NaCl solutions; however, the presence of chloride ions on the surface of the coatings was not confirmed. As for the O1 coatings, corrosion products formed on the coating surface were quite protective and surface-adhered, as seen in Figure 6a. Nevertheless, the same phenomenon did not occur for the N1 coatings, as seen in Figure 6b. The main reason for this difference in the protective capacity is because of the quantity and size of the defects present in the coatings, which are the means of transportation for the aggressive ions to reach the substrate.
2.3.2 Tafel extrapolation method
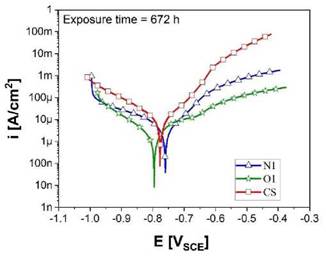
The results obtained by potentiodynamic polarization tests after 672 h of exposure to 3.5 % wt NaCl solution for the O1 and N1 coatings, as well as CS are presented in the Tafel curves, Figure 7. Kinetic parameters such as the corrosion current density (icorr) and corrosion rates (CR) were determined and listed in Table 2. The Stern-Geary relationship [38] was used to calculate the icorr, as shown in Equation (4):
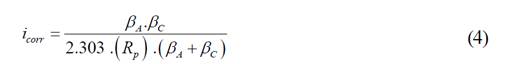
Where PA and PC (in mV dec-1) are the anodic and cathodic Tafel slope, respectively, determined with the Tafel extrapolation method, and Rp (Q.cm2) is the polarization resistance determined from EIS. High Pc was determined, indicating that the cathodic curves were controlled by mass transfer [34]. Based on the results, the corrosion current density (icorr) of the O1 specimens showed the lowest icorr after 672 h of exposure, in contrast to those observed for the N1 samples, meaning that the former protects more efficiently the carbon steel substrate from the different stages of the corrosive process.
By means of Faraday's Law [39] and in accordance with the ASTM G-102-89 [40] standard, the corrosion rate (mmpy) was calculated as:
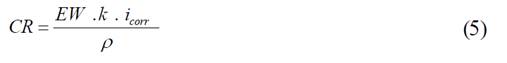
Where EW is the equivalent weight =27.94 g/eq, (k) is the faradaic constant with a value of 3.27 x 10⁻³ mm g/^A cm year, icorr is the corrosion current density and p the carbon steel density (7.87 g/cm3).
Source: own elaboration
Figure 7: Potentiodynamic curves obtained for Cr2O3 coatings and carbon steel after 672 h of exposure in 3.5 %wt NaCl.
The lowest corrosion rate was obtained for the O1 samples with a value of 0.05 mm/year which was almost four times lower compared to the N1 samples (CR = 0.18 mm/year). Likewise, this corrosion rate value for the O1 specimens is much alike to those reported in the literature for hard chromium coatings exposed to saline solutions [7]-[41]. The highest corrosion rates for the N1 coatings are primarily attributed to the number of interconnected pores in the microstructure. However, these values are similar in comparison with the corrosion rate values determined for non-coated carbon steel.
Table 2: Parameters obtained by the Tafel extrapolation method of coated specimens in 3.5 %wt NaCl solutions
| Sample | [252]Pa (mV/dec) | [253]P C (mV/dec) | [254]icorr (pA/ cm2) | [255]CR (mm/year) |
|---|---|---|---|---|
| O1 | [258]99.40 | [259]106.50 | [260]4.10 | [261]0.05 |
| N1 | [264]68.14 | [265]170.12 | [266]10.85 | [267]0.12 |
| CS | [270]89.86 | [271]133.14 | [272]11.22 | [273]0.13 |
Source: own elaboration
2.4 Contact angle measurement
The results of the contact angle measurement are shown in Figure 8, where Figure 8(a) and (b) present samples N1 and O1, respectively. Contact angle measurement appears to be a functional approach to understand the effect of chemical compositions of solid surfaces on wettability [42]. Accordingly, the contact angle of the samples N1 and O1 was less than 90 °, demonstrating that both surfaces have a hydrophilic behavior indicative of a partial wetting [43]. In general, coatings with larger angles are typically more protective against metal corrosion [44]. Comparing both samples, the sample O1 exhibited a higher angle value (64.8 °) than sample N1 (35 °). Likewise, roughness values were obtained for coatings O1 (15.13 ^m) and N1 (17.57 ^m) specimens, respectively. This property can be associated with the type of morphology and roughness of the surface of the coatings, which correlates to the type of flame (neutral and oxidizing) used to elaborate the coatings. Noticeably, the interaction between the saline solution and the surface generates a greater contact angle in the sample O1, which can be explained due to the presence of well-fused splats with a high degree of flatness resulting in a lower surface roughness. In contrast, the splats with a low melting degree in the coating were mainly presented in the specimen elaborated by the neutral flame (sample N1), producing a low contact angle. Moreover, the effect of this greater contact angle between sample O1 with respect to sample N1, can be compared in the same way with the better corrosion resistance presented in sample O1. One approach to understand this behavior is that considering there was less contact between the surface of the coating (sample O1) and the saline solution, this reduced the permeation of chloride ions through the coating. For that reason, the better corrosion resistance of sample O1 can be influenced by the interaction between its surface and the saline solution, since this sample showed a higher contact angle.

3. CONCLUSIONS
Oxidizing and neutral flames were used to elaborate two Cr2O3 coating types through oxyacetylene flame spraying. The oxidizing flame generated more compact coatings with an average thickness of 114 gm and porosity percentages of 2.5 %. This behavior is due to the higher thermal energy provided to the particles from the oxidizing flame owing to longer flight time within the flame, which results in greater fusion. At the same time, the lowest viscosity achieved in the more molten particles produces flatter and then thinner lamellar structures together with a more compact surface arrangement.
The coating with the better behavior and protective capacity was obtained with the oxidizing flame, reaching corrosion rates of 0.05 mmpy, approximately three times lower than those elaborated with the neutral flame. This accomplishment is acquired since its structure is more compact and has less number of pores and microcracks, which produced a layer of higher resistance to the initiation of corrosion processes from the transport of chloride ions into the microstructure of the coating.
Finally, the microstructure obtained through the oxidizing flame coating showed a measured contact angle average of 64.8 °, being higher than those made with the neutral flame (35 °). Consequently, this coating could achieve a lower contact between the solution and the surface due to its microstructure, a fact that was demonstrated in its better corrosion resistance.

