


 English (pdf)
 Article in xml format
 Article references
 Send this article by e-mail
 Cited by SciELO
  Cited by Google
  Similars in
SciELO
Similars in
SciELO  Similars in Google
 Permalink
INTRODUCTION
Monitoring livestock behavior can be a useful tool to improve farm animal management and to detect individual health events (Riaboff et al., 2019). The use of automated systems that predict daily behaviors from accelerometer data is widely used in cattle. Feeding time (Reynolds et al., 2019), rumination (Benaissa et al., 2019a; Rodrigues et al., 2019), lying time, predict calving (Krieger et al., 2019), welfare assessment traits (e.g. body condition score, udder/ leg hygiene score) temperament traits (e.g. aggressiveness) (Jaeger et al., 2019, Chapa et al., 2020) or lameness detection (O'Leary et al., 2020) can be recorded with accelerometers in collars, pedometers o ear tags.
Commercial accelerometer-based systems, used to record cattle activity, has three main components: the first is a device containing the accelerometer (Werner et al., 2019; Giovanetti et al., 2020). This device is mounted on the cow's leg, in a collar around the neck, or a tag on the ear. These devices use radiofrequency technology for wirelessly transfer data (Landaluce et al., 2020). The second part is an antenna that reads information transmitted from the activity device. The third part is a computer or other device that interprets the data and presents reports to the farmer. In simple terms, this monitoring framework is based on the interpretation of the accelerometer values as animal activity (e.g. eating, resting, or rumination). Although these systems are very useful tools in large-scale livestock management, their use on small farms or for educational or research purposes is unsustainable.
As an alternative, a similar approach with electronic devices containing accelerometers (e.g. Smartphones) can be used for cattle activity recognition (Andriamandroso et al., 2017). This alternative is based on the Human Activities Recognition (HAR) approach (Meng et al., 2021; Tarafdar et al., 2021). Although there are many types of sensors that can be used for the HAR (i.e. Gyroscope, Magnetometer, Electromyography, Electrocardiography), accelerometers are most widely used. An accelerometer is a device used to measure acceleration, on one or various parts of a body. Acceleration is the rate of change of the velocity of an object. The measuring unit is meters per second squared (m/s2) (Chen et al., 2021). To analyze accelerometer data Machine Learning (ML) techniques like decision trees, K-nearest neighbours, support vector machines, hidden Markov models, and artificial neural networks (ANN) have been used (Jobanputra et al., 2019).
One of the most popular methods to interpret accelerometer data as an activity are the ANN (Irvine et al., 2020). For instance, Convolutional Neural Networks (CNNs). CNN is a type of deep neural network that was developed for use with image data (e.g. such as handwriting recognition). However, now this kind of model can be considered universal, meaning that it can be used to approximate any continuous function to an arbitrary accuracy when the depth of the neural network is large enough (Zhou 2020). The first important work using CNNs to the HAR was by Ming et al. (2014). In the paper, the authors develop a simple CNNs model for accelerometer data, where each axis of the accelerometer data is fed into separate convolutional layers, pooling layers, then concatenated before being interpreted by hidden fully connected layers.
Taking into account the challenges of implementing commercial automated monitoring systems and that the HAR is a technique used with success and can be extrapolated to animals. It is possible to consider that the HAR approach can be used in the analysis of cattle behavior. Hence, the objective of this work was to develop an application for Android devices that allow monitoring of the activity of grazing cattle.
METHODS
Four main steps were followed to develop an Android app for Cattle Activities Recognition: a) data acquisition for model training, b) model training, and c) app deploy, and d) app utilization. Data acquisition and app utilization were made in Universidad de Antioquia (Antioquia, Colombia) dairy farm. This farm is located at an altitude of 2.480 m, with 16 oC average temperature and coordinates 6o27’N, and 75o32’W.
Data acquisition for model training
Traditionally, video analysis or direct observation are used to establish which activity corresponds with the accelerometer's values. In our work, we developed a system in which three components were used: two smartphones with internet access and a Google Firebase account for data storage. In this system, one phone is used by the human observer to record the actual cattle activity (eating, resting, or ruminating) into Firebase. The second phone, placed on the backside of the cattle's head, records the triaxial accelerometer values and the actual activity registered in Firebase for the observer. The phone on the animal records the information into a text file every 100 milliseconds (Figure 1).
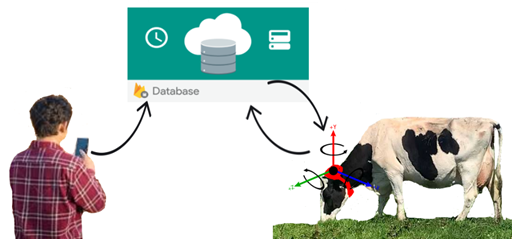
During 30 days, 20 grazing dairy cows were used for data acquisition. In this process, the observer looks at the cow’s activity, then the observer sends the label of current activity to a Real-time Online Database (Firebase), and at the same time, the cell phone on the cow requests the database for the current activity labeling.
Model training
The generated database was used to train a Recurrent Neural Network (RNN) with Long-Short-Term Memory units (LSTM). Training details can be found in the codes shared by Valkov (2017). All the training process was made on Google Colab (Bisong et al., 2019) using the Tensorflow Library (Shukla and Fricklas 2018) and Python. 80 % of the total data was randomly selected for model training and the other 20 % was used to test the training. The confusion matrix was used to evaluate the trained model accuracy. Valkov (2017) proposes a RNN containing two fully connected and two LSTM layers (stacked on each other) with 64 units each. The model training was performed with 100 Epoch numbers.
App deploy
During training, the learned parameters (history, predictions, and checkpoint) were stored. The Tensorflow API (version: 1.13.1) and the learned parameters were used to freeze and save the graph weights into a single protobuf file, which is used by the Android app to make predictions. The Android Studio Software (Smyth, 2019) was used to build the final app. Details about the freeze graph process and the Android app template can be found in the codes shared by Valkov (2017). The IntentService Java class, which provides a straightforward structure for running an operation on a single background thread was used to ensure that the application continues to function even if the cell phone screen is turned off (Song et al., 2019). Running the app as background services guarantee data collection at least 24 h.
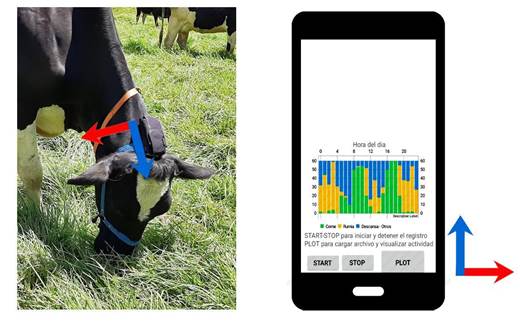
Our Android project has two Java scripts called: Main.java and BackgroundService.java. The Main.java script contains the code necessary to initialize the graphic elements in the app’s screen (i.e. buttons, messages and a chart). Figure 2 (right) shows that the app has three buttons called “Start”, “Stop” and “Plot”. The buttons “Start” and “Stop” initialize and stop the app’s Background Service, respectively. The button “Plot” opens a menu to select one of the text files created during the activity monitoring and generates a chart with the activity patterns of grazing, rumination and resting. The “BackgroundService.java” script contains the code necessary to run the app in background, which means that the app can run even if the phone’s screen is turned-off. This is a very important feature, because it reduces the battery usage. Each second, the “BackgroundService.java'' script collects the data of the phone’s three-axis accelerometer sensor, analyzes this data with the model, and stores the predicted activities in a text file. The app is freely available here: Cattle Activity Recognition.
App utilization
Three smartphones (LG gm730) were used to record the activity of six Holstein cows (3 lactating and 3 non-lactating). The lactating cows (multiparous) were 170 days in milk (SD = 87 d), had a milk yield of 28 kg (SD = 1,3 kg), and a body weight of 593 kg (SD = 47,8 kg), and the non-lactating (1 primiparous and 2 multiparous) were 268 days of pregnancy (SD = 18 days), and body weight of 561 kg (SD = 75 kg) at the beginning of the experiment. The phones were attached to the back of the cows' heads using a harness (Figure 2) and were removed two days later. Direct and non-systematic observations of the animals were made to contrast the activities recorded by the device. Additionally, the battery life was determined.
RESULTS
Data acquisition
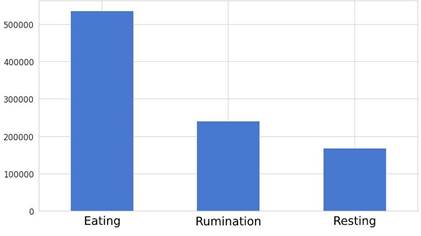
The dataset was 945415 rows and 4 columns. The first three columns in the dataset correspond to the three-axis accelerometer values and the fourth column corresponds to the cattle activities (Eating, Resting, or Rumination). The percentage of each activity in the database was 57, 25, and 18 %, for eating, rumination, and resting, respectively (Figure 3). The size of this database is similar to a famous database called WISDM (Kwapisz et al., 2011) which contains 1098207 rows for six human activities controlled under laboratory conditions.
For the development of databases that contain information on animal activity and their corresponding acceleration data, direct observation and/or video analysis are used (Benaissa et al., 2019b). However, we decided to use an alternative method that allowed us to build the database in an efficient way. Since our system records the animal's activities in real time, it is possible to avoid errors in the concatenation of the acceleration data and the observed activity. And significantly reduces the need to generate laborious information to analyze such as videos.
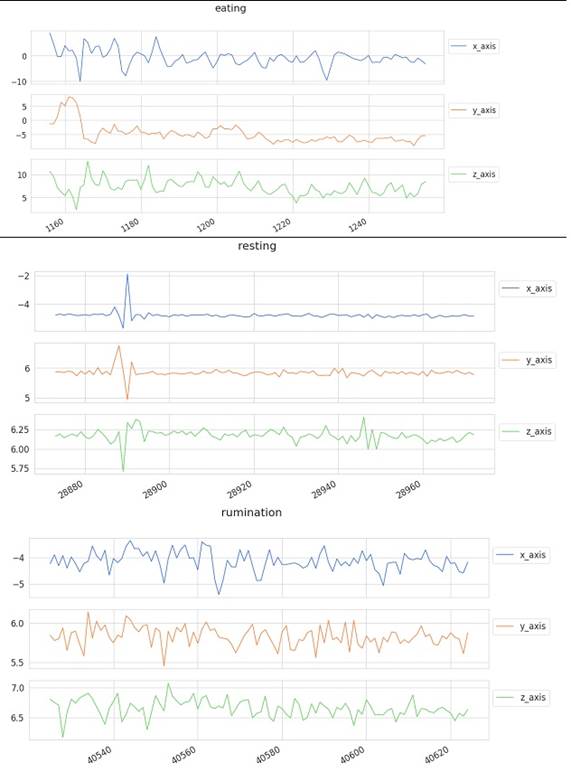
As shown in Figure 4, There are clear differences in the data behavior among the different cow’s activities. Eating is mainly characterized by negative values in the y-axis, resting by low changes in all axes, and rumination by little changes in all axes. To obtain correct prediction results it is necessary that the phone is placed on the animal's head as shown in Figure 2, otherwise the model results will be erroneous, since the model was trained with data obtained in this particular position of the phone.
Model training
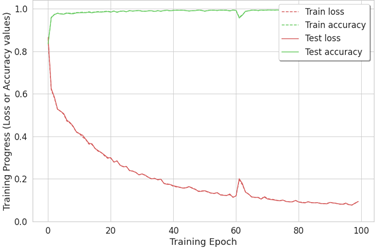
The model seems to learn well with accuracy reaching above 99 % and loss hovering at around 0,01 % (Figure 5).
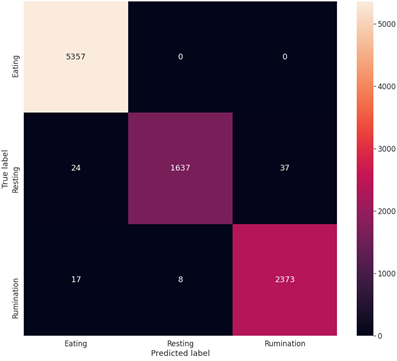
The confusion matrix for the model's predictions (Figure 6) shows that the model’s accuracy on the test data was 100, 99, and 96 % for Eating, Rumination, and Resting, respectively.
App utilization
High consistency was observed between the direct observations and the Eating, Resting, and Rumination activity recorded by the device. In the milking cows, the device was able to identify two peaks of ingestive activity, closely related to the time of milking. In this group, it was observed that ingestive activity decreased at midday and after 18 h. During the night, the milking cows spent equivalent amounts of time for rumination and resting, while the dry cows used the night mainly to rest (Figure 7). The average battery life was higher than 30 h.

Figure 7 Screen results from the Android app. Green, yellow and blue columns correspond to intake, rumination, and resting activity, respectively.
Human activity recognition (HAR) is a process aimed at the classification of human actions in a given period of time based on discrete measurements (acceleration, rotation speed, geographical coordinates, etc.) made by personal digital devices (Straczkiewicz et al., 2021). In recent years, activity recognition with smartphones is a technology widely used in humans, since it allows monitoring elderly people (Voicu et al., 2019), healthcare (Ogbauabor and La, 2018), household activities (Della Mea et al., 2017), transportation modes (Guvensan et al., 2018), and so forth. However, the use of smartphones for activity recognition in animals is very limited.
Traditionally, activity recognition in farm animals is done with complex systems where sensors are placed on the animals' necks or feet. These sensors record data that is processed in a central computer. Although these systems are quite accurate, the high cost represents an obstacle for their implementation on small farms. We developed this work to generate a low-cost tool that allows farmers, researchers or students to monitor animal activity in short periods of time (24 h). For example, this tool allows us to monitor cows in heat, sick animals or animals in the adaptation period, or simply to better understand the activity patterns of grazing animals on the farm.

