


 English (pdf)
 Article in xml format
 Article references
 Send this article by e-mail
 Cited by SciELO
  Cited by Google
  Similars in
SciELO
Similars in
SciELO  Similars in Google
 Permalink
Introduction
In recent years, satisfaction with life (SL) has risen the interest of gerontological research, thus being one of the most used concepts to measure subjective well-being, in addition to being an indicator of successful aging and of quality of life of persons older than 60 years old, due to its relation with physic and psychological health, as well as a predictor of mortality and morbidity 1,7.
Evidence proves that elderly people (EP) who are not satisfied with their own lives have a higher probability of risk of depression and of having suicide attempts 8,9. In this sense, it is common to use LS measurements in general surveys on well-being in different countries 10. For instance, in the United States LS measurements are used as an indicator of the effectiveness of the public health policies in quality of life and well-being by different populations at risk, as it is the case of the EP 11,12.
SL is the cognitive dimension of the subjective well-being that is defined as the assessment of quality of life in general, or of specific domains like job, family, friends, among others 13,15.
Different studies report diverse information on the degree variability and the significance of SL along the life course 3,16. Considering the former, and contrary to expectations, certain researches suggest that SL does not necessarily decreases with age 17. Researches with elderly people in Europe and the United States point out that after the age of 50 years old, a significant SL increase takes place, until approximately the age of 70 or 80 years old, a period of time in which it decreases as a result of the rising dependence, health problems, the loss of close relationships and the approaching of death 1,18,26. This phenomenon is called "the paradox of well-being" and has been studied in different contexts 18,20,27,29. Some studies, on the contrary, have documented a relevant LS fall with the time passing, while other have reported stable SL levels 20,30,31. Recent studies point out that EP present different paces of change relating their LS degrees 32. In respect of the meaning of the SL, a study analyzing the systemic variation of the concept of well-being in relation to age reported that EP define SL as the ability to keep up with the activities that they have always carried out over their entire lives 33.
Together with age, other factors such as gender, educational level, religion, family environment, socioeconomic status and social support are associated with the changes observed in the SL of the EP 6,34. So, some studies indicate that women present higher SL levels than men, other provide evidence that gender is not associated to SL 35,36. Likewise, EP who exhibit low mood present a lower SL, a fact that becomes more chronic if the person lives alone or has no networks of social support and presents serious medical conditions, lacking physical activity and/or isolation 37,40. A study carried out with persons aged between 60 and 89 years old in six European countries showed that unsatisfying social contacts, low self-esteem levels, deficient financial resources and the feeling of having many health problems are risk factors for a low SL 41.
Following Fagerström, Lindwall, Berg and Rennemark, the number of associated factors, as well as variations in the SL levels and significance along the life cycle provide evidence of the complexity and importance of a scientific study for the purpose of promoting and adequately conducting healthcare in human groups with different ages and needs 16. Against this background, it is important to have the LS measurement tools as part of the instruments assessing the impact of the health promotion and prevention actions based on the established changes in the SL of the older persons.
Regarding SL assessment in EP, instruments like the Life Satisfaction Index-Well-Being, the Philadelphia Geriatric Center Morale Scale, the Salomon-Conte Life Satisfaction in the Elderly Scale, or even ad hoc designed surveys have been used 42,45. These instruments are characterized by consisting of 8 to 40 items, as well as by assessing different LS dimensions.
Against this background, instruments providing evidence of validity and reliability of rapid and easy implementation, which produce a good acceptance of the health professionals, and that are tolerated and accepted by the older people, become necessary. Among these, one of the most known instruments is the Diener's Satisfaction with Life Scale (SWLS) that has been used in over 4000 studies 46,47. The SWLS is a brief one-dimensional measure of five items that measures the overall assessment a person makes of his/her own life. It has been carried out in persons of different age groups in various countries 48,49. The SWLS is of public domain and in its website (http://internal.psychology.illinois.edu/~ediener/SWLS.html) information is given on how to apply and interpret it, this information is also available translated into 27 languages.
Currently, different surveys conducted in EP using exploratory and confirmatory analyses point out that the five SWLS items constitute a one-dimensional structure with factorial loads varying between .43 and .93, and adequate reliability estimations with Cronbach's alpha coefficients oscillating between .75 and .92 48,53. Additionally, the SWLS has shown positive correlations with emotional support measures, self-perceived health, perceived control; and negative correlations with depressive symptoms and pain 48,51. Other studies have assessed its cross-cultural measurement invariance 49. These findings provide evidence for considering SWLS a valid and reliable measure of the SL in EP.
Even though studies analyzing SWLS validity and reliability in EP have been conducted in Latin America, a review of the scientific literature do not show any study of this kind with Peruvian EP; hence the question: does the SWLS maintain its adequate psychometric properties with Peruvian EP? 49,51. For this reason, the aim of the present study is to analyze the (construct, convergent, discriminant) validity and reliability evidences of the SWLS for its implementation in EP in Peru. Considering the presented arguments, following hypotheses are formulated: (a) a SWLS one-dimensional structure will be obtained; (b) correlations among items will be moderate, and will therefore not provide redundant information; (c) correlations among SWLS scores, resilience, and humor as a copying mechanism will be positive; (d) the correlation among SWLS scores and depressive symptoms will be negative; (e) the magnitude of the reliability coefficients of the SWLS scores will be moderate.
The study is justified by the need to have a brief SL measurement within the aging process that is of easy implementation and interpretation and has adequate validity and reliability evidences, for the use of health personnel, workers of social work fields and other related professional activities with EP. This is even more important if the increase in Peru of the persons older than 60 years old, who currently represent approximately 7.6 % of the overall Peruvian population and which is estimated to rise up to 15.7 % in 2050 is taken into account 54,55. This reality leads to a range of activities aimed at developing the EP quality of life, where also the use of well-being assessment instruments is required. Additionally, the SWLS can become a very useful instrument in empirical SL assessments at national and transnational levels. This way, information drawn from the implementation of SWLS will help understanding LS from the perspective of the EP, so their needs can be better met.
Materials and methods
Participants
In this study, a total of 236 EP living in the city of Trujillo, Peru, took part, of which 185 were women (78.4 %) and 51 men (21.6 %), with an average age of 72.8 % (ES = 6.90), where statistically significant differences and high effect size among the age average values favoring men (t (234) = 6.340, p = 0.001, d = 1.002 ci 95 % 0.679-1.325) were detected 56. The majority of participants (n = 82; 34.7 %) were spouses; 25.8 % (n = 61) life partners; 22.5 % (n = 53) widowed; 15.7 % (n = 37) divorced/separated; and 1.3 % (n = 3) single. The largest percentage (55.1 °/o) said they had a good quality of life, while only 5.5 °/o perceived their quality of life as bad.
Instruments
All participants responded to following instruments:
Diener's Satisfaction with Life Scale (SWLS) 46. It is a brief self-reporting measure of five items that assesses the overall judgement people make on their own LS. In the present study, the Spanish SWLS version of Atienza, Pons, Balaguer and Garcia-Merita of five Likert response options was used, with answers ranging from "completely disagree = 1" to "completely agree = 5", where the higher scores indicate a higher LS degree 57. This version has been used in EP before 52,53. The SWLS presents a one-dimensional structure, while a meta-analysis of 60 studies that assessed SWLS reliability reported an average of the Cronbach's alpha coefficient of .78, with confidence intervals of 95 °%, ranging from .76 to .80 58.
Single Item of Satisfaction with Life (SISL ). It is a one-dimensional SL measure, designed exclusively for this study, whose contents is "How satisfied are you with your own life in general?" The SISL has five response items ranging from "very dissatisfied = 1" to "very satisfied = 5".
Brief Resielient Coping Scale (BRCS ) 59. This brief measure is designed for assessing the ability to adaptively cope with stress, it is composed of four items with Likert response options varying from "absolutely does not describe me = 1" to "describes me very well = 5". According to the original English version, the BRCS is one-dimensional and presents a Cronbach's alpha coefficient of .69 as a measure of internal consistency. In the present study, the Spanish BRCS version of Caycho-Rodríguez et al 60. In this study, it evidences an adequate reliability by calculating the Cronbach's alpha coefficients (a = .874; ci 95 %: .84 - .90) and Omega (ω = .878).
Geriatric Depression Scale - 5 items (GDS -5) 61. This is the five items version that assesses depressive symptoms in EP in the immediately preceding weeks by means of dichotomous responses (Yes/No). For this study, a reliability coefficient of .76 (ic 95 %: .70 - .81) was obtained.
Data Gathering Process
All patients completed the SL, resilience and depression measures, in addition to providing information about age, gender, family coexistence and marital status. The instruments were distributed collectively in some cases, and individually in other, adhering to ethical and privacy standards, as well as complying with the informed consent and having the permission of the authorities of the Centros del Adulto Mayor -CAM- (Centers for the Elderly) of the Social Security (EsSalud) of the city of Trujillo. The study had the approval of the Committee of Ethics of the Universidad Privada del Norte.
Statistical Analysis
The initial analysis helped calculating descriptive (average, standard deviation) and distribution (asymmetry and kurtosis) measures for each of the five SWLS items. The Mardia's multivariate normality coefficient was calculated, thus contributing to the decision of the most appropriate estimation method 62.
A confirmatory factorial analysis (CFA) was conducted to explore the internal SWLS structure using the polychoric correlation matrix and the maximum likelihood estimation method 63,64. The use of CFA is justified by the existence of previous information on the SWLS factorial structure used in preceding researches 48,50,53. The goodness of fit model was assessed following recommendations of Hancock and Mueller: chi square (χ2), goodness of fit index (GFI), comparative fit index (CFI), normalized fit index (NFI), root mean squared error of approximation (RMSEA), and standard root mean squared residual (SRMR) 65. Although the χ2 is the most widely used method for assessing the goodness of fit, it has the limitation of being very sensitive to the sample size 66. Against this background, the relative squared chi calculation for the model (x2/df) was included, where values between 2 and 3 or up to a difference < 5 indicate a good fit model 64,67,68. On the whole, GFI, CFI and NFI > .95 values, as well as RMSEA and SRMR < .08 values indicate an adequate fit between the hypothetical model and the data 69. It was considered that the standardized factorial loads (λ) are adequate when starting from a value of λ > .50 69. Additionally, in order to obtain internal evidence of convergent validity, the average variance extracted (AVE) from the factor was calculated, where values > .50 are considered satisfactory 70. Internal evidences of discriminant validity are assessed by means of the item-total correlations.
The reliability of the SWLS scores was assessed using the Cronbach's alpha coefficient complemented with confidence intervals by 95 °% (ci) calculated by the MS Excel® ICalfa module, the omega coefficient (ω) with the corresponding ci and the greatest lower bound (GLB) 71,74. The alpha coefficients were compared based on the ci of the difference between two parameters 75.
The SWLS convergent and discriminant validity evidence was estimated through de Pearson's correlation coefficient between the SWLS score and other measures that are theoretically related with the LS (SISL, BRCS and GDS-5), calculating the correlations' effect size (ES) (r; > .20: recommended minimum; > .50: moderate; >.80: strong) and the corresponding ci by the MS Excel® module designed for this case 76.
Ultimately, the descriptive and correlational statistical analyses were conducted with SPSS. 22, while EQS 6.2 was used for the AFC.
Results
Descriptive Analysis of the SWLS Items
Table 1 shows the statistical descriptions of the five SWLS items. The item number 5 ("In most respects, my life is as I want it to be") has the largest average value (M = 3.69), and the item number 4 ("If I could live my life over, I would repeat it just the same way it has been") has the lowest (M = 3.55). All items present adequate asymmetry and kurtosis (±1.5). Likewise, the Mardia's coefficient value of 13.49 lies within the limits considered adequate (<70), thus allowing the assumption of multivariate normality and not affecting the estimations based on the maximum likelihood method 77,78.
Table 1 Mean values, standard deviations, asymmetry, kurtosis and correlation among the Diener's Satisfaction with Life Scale (SWLS) items
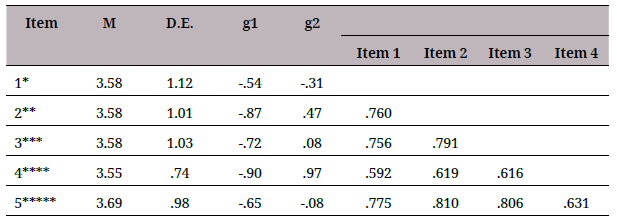
Note: M = Mean; DE = Standard Deviation; gl = Asymmetry; g2 = Kurtosis.
Item 1* = "In most respects, my life is as I want it to be"; Item 2** = "So far I have gotten the important things I want in life"; Item 3*** = "I am satisfied with my life"; Item 4**** = "If I could live my life over, I would repeat it just the same way it has been"; Item 5***** = "The conditions of my life are good".
Evidence of the SWLS Internal Structure
The AFC was used for establishing the goodness of fit of the SWLS one-dimensional model previously identified in the specialized literature. Results show that the one-dimensional model presents a good data fit (χ2 = 10.960, df = 5, p = .05, x2/df = 2.192, GFI = .983, CFI = .994, NFI = .988; RMSEA = .071 [ci 90 % .000, .129]; and SRMR = .013). Standardized factorial loads (λ) for the one-dimensional model (Item 1 = .85; Item 2 = .89; Item 3 = .89; Item 4 = .69; Item 5 = .91) are all statistically significant (p < .05), with the expected direction and with a of .847 above the recommended (λ>.70) 64. The one-dimensional model presents also internal evidences of discriminant validity evidence since they do not show correlations above .90 among the SWLS items (table 1), thus indicating a lack of multicollinearity 79. The AVE = .723 value provides internal evidence of convergent validity for it is superior to .50 70.
Table 2 presents the comparison of the goodness of fit indexes reported in this study that was also pointed out in previous researches. Fit indexes similar to the reported in the international literature are evidenced, although in some cases all the required values needed for establishing a comparison are not available.
Tabla 2 Goodness of fit indexes, reliability coefficients, SWLS factorial loads reported in this and other studies on elderly people
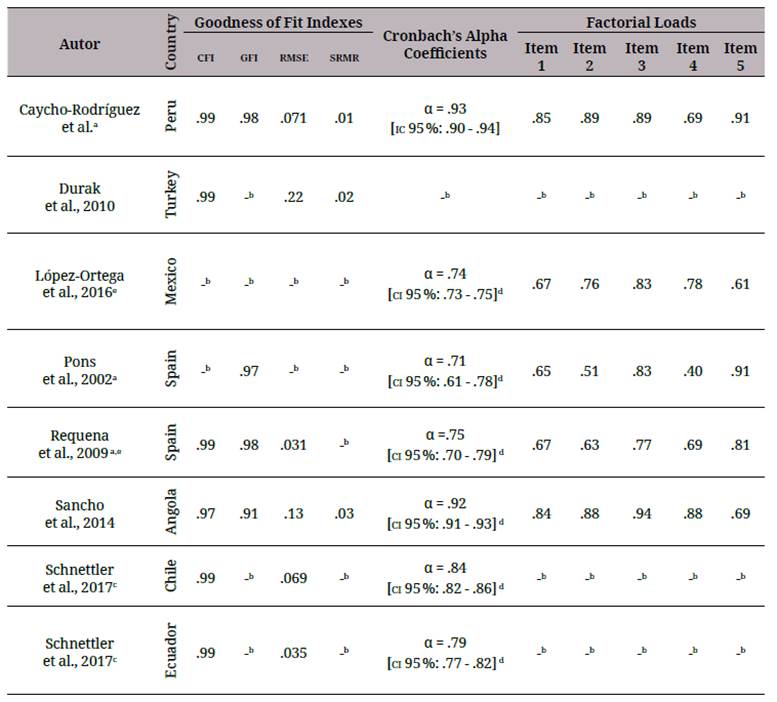
a. The items are taken from the Atienza et al. (2000) version. Item 1 = "In most respects, my life is as I want it to be"; Item 2 = "So far I have gotten the important things I want in life"; Item 3 = "I am satisfied with my life"; Item 4 = "If I could live my life over, I would repeat it just the same way it has been"; Item 5 = "The conditions of my life are good".
b. Hyphens represent that values have not been included in the original article.
c. Fit indexes and reliability coefficients of the compared models in the factorial invariance between the Ecuadorian and Chilean samples were considered.
d. ci 95 % are not reported in the original articles, but have been calculated based on the data found there.
e. Reported factorial loads are drawn from AFE and not from AFC.
Note: CFI = Comparative Fit Index; GFI = Goodness of Fit Index; RMSEA = Root Mean Squared Error of Approximation; SRMR = Standard Root Mean Squared Residual; α = Cronbach's Alpha Coefficient; ci = Confidence Intervals.
Convergent and Discriminant Validity Evidence
In order to assess the convergent and discriminant validity, the correlation among the SWLS scores was calculated with a single item of satisfaction of life scale (SISL), resilience (BRCS) and depression (GDS-5). In this sense, results report that the SWLS score is positively correlated with the SISL (r = .898, p< .01 [ci 95 %: .87, .96]) and the BRCS (r = .992, p< .01 [ci 95 %: .98, .99]); while with the GDS-5 a negative correlation was established (r = -.584, p< .01 [ci 95 %%: -.49, -.79]). All correlations show the expected direction, are statistically significant and present a moderate (r > .50) and strong (r > .80) ES 76.
Reliability Estimate
The reliability of the SWLS one-dimensional model scores were assessed. The results of the calculation of the Cronbach's alfa coefficient (a=.93; ci 95 %: .90 - .94), the omega coefficient (ω = .93; ci 95 %%: .92 - .95), and the GLB = .94 provide evidence of an adequate reliability. Table 2 shows a higher alpha coefficient value compared with the findings of the previous studies. The ω coefficient value was not compared since the preceding studies did not report it.
In order to complete the reliability analysis, the difference between the α coefficients reported in the present study and the other international works on the basis of the data indicated in table 2 was estimated. This procedure aimed at evaluating whether there are statistically significant differences in the estimate of error in the compared samples or not 75. Results point out that only the ci 95 %% of the difference between the alpha values of the present study and the ones of Sancho et al. (ci 95 %%: -.022 to .002) is statistically significant, thus evidencing that the SWLS estimates the error in a similar way in Peruvian and Angolan EP 48. On the contrary, results prove an existing difference in the estimation of error when comparing alpha values of the Peruvian EP sample with Mexican EP (ci 95 %%: .16 to .20), with institutionalized Spanish EP (ci 95 %%: .14 to .32), with Spanish active elderly women (ci 95 %: .13 to .23), with Chilean EP (ci 95 %: .05 to .11), and with Ecuadorian EP (ci 95 %%: .09 to .16).
Discussion
The aim of the study was to determine and analyze the validity and reliability evidences of the SWLS scores in a sample of Peruvian not institutionalized EP. In general, the results show adequate psychometric properties for SWLS, where all items presented high factorial loads, optimal fit indexes of the one-dimensional model, as well as adequate levels of internal consistency.
Considering the construct validity analysis, the present study provides higher evidence of the SWLS one-dimensional structure in EP, which coincides with what previous studies conducted in different cultural contexts report 48,50,53. Similar findings have been reported in samples of adolescents, pregnant and postpartum women, unfertile women, persons performing physical activities, among others 57,80,82. This is an important result since it allows replicating the SWLS one-dimensional structure in spite of the different characteristics of the samples.
In relation to the factorial loads, these oscillated between .69 (Item 4: "If I could live my life over, I would repeat it just the same way it has been") and .91 (Item 5: "The conditions of my life are good"). In this sense, the item "If I could live my life over, I would repeat it just the same way it has been" not only presents the highest factorial loads and explains the lower LS construct variance, but it also shows the weakest inter-item correlations, thus supporting the previous results in EP 48,51,52. This is explained by the temporal orientation towards the past of this item compared with the remaining four that are oriented towards a current perspective, a fact that could indicate that SL in EP relates more to an assessment of life in the present rather than in the past 83. Desmyter and De Raedt provide evidences that support these results pointing out that those EP who present a negative perspective towards the future would be most likely to experiment negative feelings of affection, depressive symptoms, and lower levels of satisfaction with life. The opposite case, in which the items oriented towards the present would have the highest factorial load and would explain a higher SL percentage variance, would indicate that the EP perceive the future as a way of maintaining the positive circumstances of the present.
Convergent and discriminant validity analyses allow, in turn, providing the evidence that relations between the SL, measured through the SWLS, and other SL, resilience and depression measures show the expected theoretical direction. This way, the relation between LS and resilience is compatible with the findings of other studies with EP 60,84. Some authors point out that resilience in the old age plays an important role in developing well-being. In this sense, resilient EP adequately cope with many stressing situations because they put into use personal (v.g. positive emotions) and interpersonal (family support) mechanisms that help them adapt and experiment higher LS levels 84,86.
On the other side, SL is a construct that is directly associated to depression in the EP population 36. This relation is even more important if it is borne in mind that internationally about 10 %% of not institutionalized EP suffer from some kind of depressive condition, a percentage that increases up to approximately 30.5 %% in institutionalized EP 87,88. In Peru, about 81.2 %% of the institutionalized EP have depression, while other authors point out that there are no significant differences considering this in institutionalized and non-institutionalized EP 89,90. The negative relation between depression and SL suggests that an adequate intervention in case of depression or the risk of suffering from it could lead to a better satisfaction with life 91.
The value resulting from the reliability analysis by internal consistency conducted through alpha coefficient calculation (α = .93) is considered to be optimal (> .70) and higher than those registered by previous international studies with EP. Additionally, empiric evidence was provided that leads to consider that the SWLS estimations of the score reliability are the same both in Peruvian and Angolan EP. The reverse is the case when comparing the results of Peruvian, Mexican, Spanish, Chilean and Ecuadorian EP, when significant differences in the reliability estimation are established. This last result would indicate that the SWLS is biased towards the real score estimation of the compared samples due to the different characteristics among the samples, a fact that can lead to bias in the interpretation of the findings of the comparative and predictive transcultural studies 75,92.
As regards criticism of the use of the alpha coefficient found in the literature, it was considered appropriate to calculate as well the ω = .93 and GLB = .94 coefficients that are more adequate for factorial analysis models and suitable for screening measures in massive assessments 93,94.
The study presents certain limitations, such as the low number of elderly participants that came from a single city, this would lead to the recommendation to carry out other SWLS validation studies in bigger samples of other cultural groups in Peru. Likewise, for practical reasons, participants were non-institutionalized EP, mostly living with their families or relatives, it is therefore necessary to analyze the SWLS psychometric evidences in EP who are institutionalized or in clinical settings. On the other hand, this study used a series of self-reporting measures, leading the results to be prone to bias. Ultimately, the test-retest reliability was not assessed in the present study.
The results of the present study support the conclusion of considering SWLS a measure that provides valid and reliable interpretations of LS in Peruvian EP. The results are important in so far as they can be used in the clinic ambit or as part of an EP general assessment system, or, within limits, for research purposes. However, further psychometric studies in EP in different regions in Peru have to be carried out.

