


 English (pdf)
 Article in xml format
 Article references
 Send this article by e-mail
 Cited by SciELO
  Cited by Google
  Similars in
SciELO
Similars in
SciELO  Similars in Google
 Permalink
Introduction
With the implementation of new, better, and more sophisticated technologies, the effort performed by workers has had significant changes 1-4, and now the workers perform to complex tasks demanding combined physical and mental efforts 2. A few years ago, workers performed only physical tasks; in contrast, today it is possible to find jobs where physical effort is practically zero, for example, office work, control room operation, among others.
The work/job/activities/tasks developed by the advanced manufacturing technology (AMT) operators are considered complex 4. One example of complex work is the operation of lathes of computer numerical control (CNC). In this type of work, the operators must develop both, physical (load and unload parts to/from the machine) and mental tasks (change of model, parameter setting, and inspection). Some studies have concluded that the duality of tasks can generate diverse fatigue symptoms 2,4,5.
Because manipulating variables (for example: mental workload, heart rate, handled weight, among others) in industrial environments to get data is complex and practically impossible, the measurement of physiological indices in these conditions has been relatively unexplored. In contrast, it is common to simulate work conditions in lab settings. For example, some authors have developed research in laboratory environments where the effects of physical and mental fatigue have been analyzed in certain circumstances 2,6-9. Although lab experiments have important limitations such as not consider all the stimuli, simulated time is shorter than a working day, and it is difficult to reach the external validity, in ergonomics, lab experiments are a common practice to explore the behavior of variables to explain certain phenomena or constructs. However, simulated tasks in the cited studies are different from those performed by lathes operators.
The general objective of this research is to simulate, in a lab environment, the physical and mental load in two levels (low and high) to know the effects on heart rate (HR), effort perception (EP), physical performance (pp), and mental performance (MP). The specific objectives are as follows:
To quantify heart rate (HR), effort perception (EP), and physical performance (PP) when physical load (low and high) is simulated.
To quantify the heart rate (HR), effort perception (EP), and physical performance (PP) when mental load (low and high) is simulated.
To quantify the heart rate (HR), effort perception (EP), physical performance (PP), and mental performance (MP) when mental load (low and high) and physical load (low and high) are simulated in combination.
Materials and methods
Study Design
In order to quantify the physiological responses of mental and physical load stimulation a quasi-experimental, descriptive, cross-sectional, and correlational study design was performed in lab settings.
Sample
A convenience sample was chosen according to the following inclusion criteria:
Being a student of the Autonomous University of Ciudad Juarez.
Not having heart and respiratory problems, hypertension or injury in the last year prior to the experiment.
Non-smokers.
Having not drunk alcohol two days before the sessions.
During the study, participants could be excluded if they suffer an injury in upper or lower limbs, presenting a mental problem, or miss more than two sessions being unable to reschedule. The subjects wore tennis shoes, jeans, cotton shirt, and cotton socks. At the end of the session, participants received a small gift.
Variables
Independents
Levels of physical and mental load considered the proposal of DiDomenico 2 who stablished values/scores for these two variables. As a result, two independent variables were manipulated, physical load and mental load. For low physical load (LPL) participants manipulated/ handed a 10-lb. weight disc, while for high physical load (HPL) a 20-lb. weight disc was used. For low mental load (LML) participants solved addition and subtraction arithmetic problems, while for high mental load (HML), participants solved multiplication and division arithmetic problems.
Dependents
The values of four dependent variables were recorded. Heart rate (HR) was recorded using the heart rate monitor Suunto software. The physical performance was measured counting the number of times that participants moved the disc. The mental performance was measured as the ratio of the questions answered correctly divided between the number of questions answered. Effort perception was assessed using the 6-20 Borg rating of perceived exertion (RPE) 10. Participants were asked every minute during the test about their perception of global efforts performed to complete the assigned tasks (see table 1).
Table 1 Borg Scale 6-20
| Value | Effort interpretation | Value | Effort interpretation |
| 6 | No exertion at all | 14 | |
| 7 | Extremely light | 15 | Hard (heavy) |
| 8 | 16 | ||
| 9 | Very light | 17 | Very hard |
| 10 | 18 | ||
| 11 | Light | 19 | Extremely hard |
| 12 | 20 | Maximal exertion | |
| 13 | Some light |
*The variables considered in the study are shown in table 2.
Table 2 Variables of the Study
| Independent | Dependent | |||||||
| Name | Levels | Code | Name | Measure unit | Code | |||
| Low Physical Load | 10 lb | LPL | Heart rate | (bpm) | (HR) | |||
| High Physical Load | 20 lb | HPL | Effort perception | 6-20 | (EP) | |||
| Low Mental Load | Addition and subtraction | LML | Mental performance | # correct answers/# questions | (MP) | |||
| High Mental Load | Multiplication and division | HML | Physical performance | # of movements | (PP) | |||
Methods
Once the subjects arrived at the lab, participants read and signed a consent form to accept their voluntary participation. Next, in a private room, the participants set the heart rate band on their chest. To stabilize the heart rate signal, participants remained seated for five minutes. When the heart rate-computer communication was confirmed, the test was ready to start.
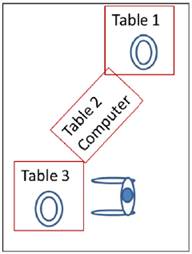
Before starting, a research assistant explained the test activities, and two full series of the cycle were developed. Those data were eliminated from the data analysis. Every minute, participants were asked about their effort perception based on the Borg RPE scale 10. Figure 1 shows the layout developed in the ergonomics lab at the Autonomous University of Ciudad Juarez where the experiment was conducted.
Because the design of the experiment involves testing with single and combined efforts, in four sessions, participants developed single effort tests. In the remaining four sessions, combined efforts tests were performed. To avoid fatigue effects, only one session was programed per day. Hereunder, test conditions are described.
Single Test
The sequence of activities performed in the single effort is shown in table 3. Four different sequences were developed using a Latin square array (see table 4).
Table 3 Activities Developed in Single Effort
| Step | Only physical activities | Only mental activities |
|---|---|---|
| 1 | Place the elbows at 90-degree position, back straight, and using both hands, take the disk in point 1 | Stand in front of point 2 |
| 2 | Walk 2 meters to point 3 | Read the sentence (arithmetic problem) in the screen |
| 3 | Leave the disk in the point | Answer the arithmetic problem using the keyboard |
| 4 | Place the elbows at 90-degree position, back straight, | Read and answer next arithmetic problem |
| and using both hands, take the disc in the point 3 | ||
| 5 | Walk 2 meters to point 1 | Repeat the sequence for 7 minutes |
| 6 | Leave the disk in point 1 | |
| 7 | Repeat the sequence for 7 minutes |
Combined Test
The sequence of activities performed in the combined effort tests is shown in table 5. Four different sequences were developed using a Latin square array (see table 6).
Table 5 Activities Developed in the Combined Efforts Tests
| Step | Activities |
|---|---|
| 1 | Stand in front of point 2 |
| 2 | Read the arithmetic problem on the screen |
| 3 | Answer the arithmetic problems using the keyboard |
| 4 | Walk 1 meter to point 1 |
| 5 | Place the elbows at 90-degree position, back straight |
| and using both hands, take the disc | |
| 6 | Walk 2 meters to point 3 |
| 7 | Leave the disc in point 3 |
| 8 | Walk 1 meters to point 2 |
| 9 | Read the arithmetic problems in the screen |
| 10 | Answer the arithmetic problems using the keyboard |
| 11 | Walk 1 meter to point 3 |
| 12 | Repeat the sequence for 7 minutes |
Table 6 Sequence of the Combined Tests
| Day | Sequence 5 | Sequence 6 | Sequence 7 | Sequence 8 |
|---|---|---|---|---|
| Fifth | LPE - LME (1) | HPE - HME (2) | LME - HPE (3) | HME - LPE (4) |
| Sixth | HPE - HME (2) | LME - HPE (3) | HME - LPE (4) | LPE - LME (1) |
| Seventh | LME - HPE (3) | HME - LPE (4) | LPE - LME (1) | HPE - HME (2) |
| Eighth | HME - LPE (4) | LPE - LME (1) | HPE - HME (2) | LME - HPE (3) |
Data Analysis
Tests of normality of heart rate data were performed using the Anderson Darling test. Paired T-test was used for data comparisons between the sample. The nonparametric comparisons were made using the Wilcoxon Rank test. All data were captured in Excel software and then exported to SPSS v17 software for analysis. A significance level of 0.05 was used for all comparisons and hypothesis testing performed.
Results
Sample
A total of 15 volunteer students (10 men and 5 women) participated in the study. All of them with no apparent health problems. The average age was 23.4 years (± 2.27), the mean weight was 65.8 kg (± 8.81), height 165.3 cm (± 11.07). The 15 participants completed the 8 sessions of the experiment.
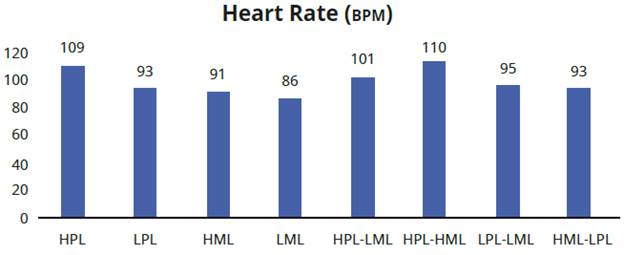
Heart Rate
Single test HPE and the combinations HPE-LME and HPE-HME yielded the highest values of heart rate being significantly higher (p <0.05) than those that do not include HPE. In contrast, the single test LME and the combination HME-LPE got the lowest values of heart rate (see figure 2).
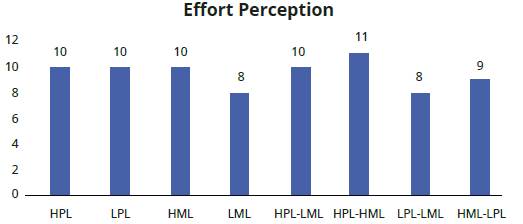
Effort Perception
In general, tests that include HPE got the highest values of effort perception. However, no significant differences among the effort perception were found (p>0.05) in the eight tests (see figure 3).
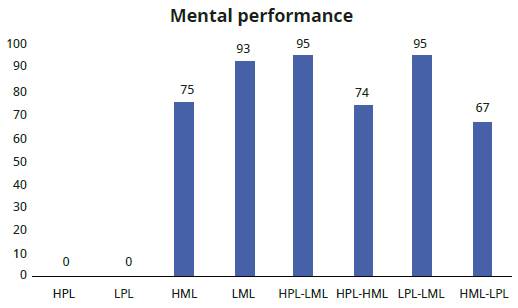
Performance
For mental performance, results for tests without HME are, in average, 20 % higher than tests including this condition. For example, LME, LPE-LME, and HPE-LME scored 93 °%, 95 °%, and 95 °% efficiency, respectively, being significantly higher than the values obtained for the remaining five tests (p <0.05) (see figure 4 and table 7).
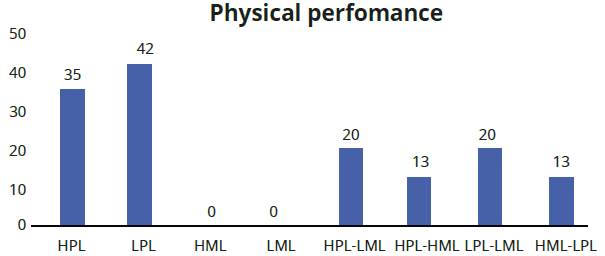
The results of physical performance showed a similar behavior when HME is not present. For example, HPE, LPE, LPE-HPE, LPE-LME scored 35, 42, 20 and 20 moves, respectively, being significantly higher than the values obtained for the remaining tests (p <0.05) (see figure 5 and table 7).
Discussion
According to the results, the presence of levels of load considered as high increases significantly the heart rate. In this case, high physical load was represented by a disk of 20-lb. For example, tests where high physical load was present got at least 14 bpm higher than others.
On the contrary, no significant differences in effort perception for all tests were found. In this case, the most probable cause was the short duration of the test (only 7 min). However, the study of DiDomenico 11 found significant differences in the effects caused by the manipulation of the physical and mental load with only five minutes of simulation. Duration of the experiment is the most relevant limitation of this study. As mentioned above, some lab experiments have been successful with short time of simulation. In this specific case, another variable influencing the outcomes was the rate/speed the participants used to complete the task, that is, they were not asked to complete the study in a determined time, on the contrary, participants performed the tasks at their own pace.
The presence of high mental load decreased significantly the values of mental and physical performance getting scores between 18 and 28 %%. The decrease of the mental performance is mainly due to the level of complexity of the arithmetic tasks where participants solved compounds statements of multiplication and division for high mental load.
For the case of physical performance, reduction in the number of movements is attributable to the time used by the participants to answer the questions of the mental load being higher for the high mental load than low mental load. As a result, high mental load got a significant decrease in the number of movements.
Findings of this study show the importance of the load levels. High load levels physical and/ or mental) have an important effect on physiological indices (i.e. heart rate) and performance. In an effort to improve the productivity, companies should analyze current workload levels, design new tasks, and implement lower levels of workload.

