


 English (pdf)
 Article in xml format
 Article references
 Send this article by e-mail
 Cited by SciELO
  Cited by Google
  Similars in
SciELO
Similars in
SciELO  Similars in Google
 Permalink
INTRODUCTION
Currently, customers do not buy only products and services, but they also buy brand experiences (Ramaseshan & Stein, 2014), receiving a great deal of attention from researchers in conjunction with their increased use by the companies (Palmer, 2010). Customers interact increasingly with companies through various points of contact making the customer experience of more social nature. These changes require that companies integrate multiple business functions and other external partners in the creation and delivery of positive experiences to the customer (Lemon & Verhoef, 2016).
Brand experience can be understood as the sensations, feelings, cognitions, and behavioral responses triggered by stimuli associated with the brand. And increasingly, companies seek to generate positive experiences with their brands to influence the behavior of their customers and generate greater loyalty with their brands (Brakus, Schmitt & Zarantonello, 2009).
The option to search the segment of mobile devices and the experience that the brands of these appliances have caused in their consumers is due, mainly, to the size of this market and the increasing competitiveness of brands in search of greater loyalty of its customers. In the segment of smartphones, in the year 2017, the mark of 47.7 million commercialized appliances was reached (IDC, 2018). Brazil, according to IDC, is currently the 4th country in sales of smartphones in the world, behind only China, the USA, and India.
The growth in the use of cellular telephones has increased the options of choices for customers, making the creation of brand experience an important strategy of differentiation in the market (Ramaseshan & Stein, 2014).
The aim of this work is to measure the influence of the brand experience of users of smartphones and its consequence in relation to brand loyalty through a theoretical model.
In academic terms, this research is justified due to the fact that the management of the customer experience is a new area of study and that despite what has already been researched, there are still many contributions to be made in this theme (Lemon & Verhoef, 2016; Ramaseshan & Stein, 2014), demanding more research efforts (Thuy & Thao, 2017) and that in the last 10 years the theoretical evolution of this theme was small (Andreini, Pedeliento, Zarantonello, Solerio, 2018). In addition, Ramaseshan and Stein (2014), Walter, Cleff and Chu (2013) and Cleff, Dorr, Vicknair & Walter (2013) propose new studies that analyze the experience and brand personality, as well as their effects in the loyalty of customers, reinforcing the significant contribution of this type of research for the theory of interpersonal relationships and the literature of brand relationship with the consumer, in addition to the increase of the number of brands tested.
This work will revalidate empirically the model of Brakus et al. (2009), in different situations and different cultures (Ebrahim, 2013). In addition, the results obtained by Walter et al. (2013) and Cleff et al. (2013), indicate that there are relationships that are not confirmed empirically contradicting the results advocated by Brakus et al. (2009). It should be emphasized that the test of the model Brakus et al. (2009) is unprecedented in Brazil, contributing to the deepening of knowledge about the brand experience in developing countries, which have different aspects related to the culture, economy, social groups, demographics, among others.
Another contribution of this work - and described as a suggestion for further studies by Ramaseshan and Stein (2014) - is to identify which of the four dimensions of brand experience (sensory, affective, behavioral, and intellectual) has a greater influence on the formation of the construct Brand Experience.
LOBBY
According to Libardi (2012), the lobby can be understood as an activity that embeds the influence of practice in the context of political decisions to safeguard or reach certain interests. It is exactly the place where it happens which transformed this meaning of physical space into a persuasive professional activity.
Hall and Deardorff (2006) address lobby as being a legislative subside, for they consider that the lobbyists supply the thinking legislators with high-valued information that is aligned with theirs, carefully selected, in the search of common political objective support. The authors also highlight that it is not necessarily about changing the politicians’ minds, but encouraging them, with this information, to reach their goals.
Mack (2005) discussed the concept of the lobby in the perspectives that are present in the USA laws and in the European parliament and presented it as the act of keeping in touch with politicians or public authorities with the objective of influencing decisions that are pertinent to the interests of a given pressure group. Likewise, he cataloged the strategy and the influence of activity implementation as components that are essential to a decisive lobby.
Rival (2006), on the other hand, defined lobby as an activity done through intervention from those who are interested in influencing, whether directly or indirectly, the development process, the law, the norms and regulations application or interpretation, as well as governmental decisions.
Polère (2007) described the lobby as the act of influencing political decisions through a group of similar interests. The author stated that the lobby’s main objective is to influence the legislative power and that it is about a political activity that is not restricted to the economic group acting, but about both these groups and the public interest, through NGOs and other social classes.
Mayrhofer (2014), however, upon considering that the interest and pressure groups are the main European influencers, expressed that lobby corresponds to the actions of promotion, representation, and specific interests’ defense through the influence in the political decisive process.
In a study that analyzed lobby in the American political scene, Graziano (1994) noticed that the lobbyist activity acts in a set which comes from a range of diversified interests and that, in several situations, specific knowledge about the matter becomes necessary. Thus, he considered it as technical support for the representation of interests, once the lobbyists or pressure groups act as holders of specialised information that can maximize the influence in a political decision. From the author’s point of view, the lobbyist or pressure group he represents comes covered in a technical support function for the legislator or decision-maker.
Rasmussen (2015) adds that the technical knowledge provided by those interested is necessary to allow the legislator to critically evaluate the matters under his appreciation. Lobby, in this meaning, ends up being a mutual support, in which the group interest tends to be granted and the legislators may widen their field of knowledge about the matter and better understand the topic since they are served with specialised information that is difficult to access, that is, privileged information.
For Libardi (2012), the lobby is seen as an activity that intends to interfere or influence the state decisive process to defend specific interests, configuring an essential tool for the democratic entities and for society’s participation upon the making of governmental decisions. The theorist highlights that lobby is valued in the gap of the public man’s knowledge. In short, lobby longs for the decision routing which interests or, somehow, favors a certain society’s group. Thus, it is shown as a convincing activity that is practiced through provision and information exchange and the propositions of a legal matter between the public power and the lobby operator. Therefore, it is a purely convincing act practiced over the decision-maker, highlights the author.
For Farhat (2007), the lobbyist activity is understood as the one practiced within the law and the ethical precepts by special and legitimate interest groups, which aim at being heard by the government with the objective of obtaining benefits and/or conveniences through measures, decisions, and attitudes supported by the deontological principles. Thus, the author defends that the organized interest groups must act in an ethical and legitimate environment with the objective of bearing consistent information to obtain the desired attitudes. However, we should highlight that, according to the related literature, lobby carries a derogatory image linked to its term. Upon trying to deconstruct this malice-associated image, it is advisable to understand that which the word does not represent. With the proposal to defend the practice of legitimate lobby, so it will not go through misrepresentations or meaning inappropriateness, Farhat (2007) catalogs that which the term does not denote, such as money misuse to obtain favors and special treatments, evasive moves and everything else that results from the characterization of corruption.
The practical implications of this study are related to the fact that it is important for managers to measure the impact of different dimensions of the experience of the brand loyalty of consumers, understanding the magnitude of the relationship between brand experience and behavioral responses of customers (Ramaseshan & Stein, 2014), besides the possibility of assessment, planning and tracking results of these interactions (Brakus et al., 2009). The monitoring of experience, the journey of purchases, and the relationship of customers over time with the companies began to be something essential for managers (Lemon & Verhoef, 2016).
THEORETICAL REFERENCE
The theoretical reference presents the content related to the various constructs that form the hypothetical model to be tested in the research.
Brand experience
Consumers are currently not seeking only products for functional benefits, they are increasingly basing their choices in the experiential aspects (Zarantonello & Schmitt, 2010). They want unique and memorable experiences resulting from sensory, affective appeals and other appeals which generate pleasant experiences (Hirschman & Holbrook, 1982), which occur when a company uses intentionally services as stage and goods as props, to engage customers to create a memorable event for them and who would like to repeat and sustain for a longer time (Pine II & Gilmore, 1998).
The brand experience can be conceptualized as the customers' perception in each contact with the brand, the brand images projected in advertisements, in personal contact, or at the level of quality of the treatment received, being understood as subjective responses and internal to the consumer (sensations and cognitions) and behavioral responses stimulated by the brand such as the design and identity, packaging, communications and the environment itself where the brand is exposed (Hirschman & Holbrook, 1982; Jung & Soo, 2012; Keng, Tran & Thi, 2013; Schmitt, 1999; Sahin, Zehir & Kitapçi, 2011; Thuy & Thao, 2017).
The brand experience has cognitive, emotional, behavioral, sensory and social dimensions throughout the customer experience in the process of buying, using and disposing of the brand and by stimuli related to the brand (Brakus et al., 2009; Jung & Soo, 2012; Keng et al., 2013; Lemke, Clark & Wilson, 2011; Lemon & Verhoef, 2016; Schmitt, 2009; Thuy & Thao, 2017; Walls, Okumus, Wang, & Kwun, 2011). Thus, the brand experience considers both the rational and the irrational assumptions of consumer behavior (Ebrahim, 2013), being something very emotional and personal of each consumer (Hirschman & Holbrook, 1982; Carù & Cova, 2003; Pine II & Gilmore, 1998).
The concept of brand experience includes several dimensions, being the sensorial dimension related to visual, auditory, tactile, olfactory and taste stimuli (Zarantonello & Schmitt, 2010; Özer & Köse, 2013), i.e., are the aesthetic and sensory experiences of consumers (Schmitt, 1999; Thuy & Thao, 2017).
The affective dimension is related to the feelings generated by the brand and its emotional influence and creation of bonds with the consumer (Zarantonello & Schmitt, 2010; Özer & Köse, 2013), directed the “felling marketing “ that involves the internal feelings and emotions of the customers (Schmitt, 1999; Thuy & Thao, 2017).
The intellectual dimension refers to the ability of the brand to involve the convergent and divergent thinking of the consumers (Zarantonello & Schmitt, 2010; Özer & Köse, 2013), that is, the “thinking about marketing”, which retains the intellectual attraction by means of cognitive experiences and resolution of problems for customers (Schmitt, 1999; Thuy & Thao, 2017).
The behavioral dimension includes bodily experiences, lifestyles, and interactions with the brand (Zarantonello & Schmitt, 2010; Özer & Köse, 2013), in addition to marketing goals of physical behaviors and interactions (Schmitt, 1999; Thuy & Thao, 2017).
Brand experience is an antecedent of brand personality, i.e., the higher the scale of brand experience, the more associations of personality the consumer will adopt (Brakus et al., 2009; Zarantonello & Schmitt, 2010).
The brand experience has a direct and positive effect on the quality and consumer preference, i.e., the more positive experiences the customers had with the brand, the greater the satisfaction and preference will be by the brand (Brakus et al., 2009; Ebrahim, 2013; Walls et al., 2011). The relationship in the long term of brand experience affects the customers' satisfaction (Sahin et al., 2011; Tsai, Chang & Ho, 2015) and loyalty (Morrison & Grane, 2007; Schmitt, Brakus & Zarantonello, 2014; Sahin et al., 2011; Tsai et al., 2015; Zarantonello & Schmitt, 2010) with the brand.
Hypothesis 1: The brand experience is a second-order construct, formed by the constructs of first-order experience-sensory, affective-experience, behavioral-experience, and intellectual-experience.
Hypothesis 2: The brand experience has a significantly positive effect on brand personality.
Hypothesis 3: The brand experience has a significantly positive effect on satisfaction with the brand.
Hypothesis 4: The brand experience has a significantly positive effect on loyalty to the brand.
Brand personality
The brand personality represents a set of human characteristics associated with a brand (Aaker, 1997). It is a metaphor that refers to the observation of the consumer and the perception of a brand as a person. Consumers tend to assign the brands human physical characteristics (such as beautiful, attractive, etc.), positive and negative personality traits (as charismatics, certain, shy, responsible, etc.), demographic characteristics (sex, age, education, social status, etc.), and even cognitive skills (such as intelligence) (Ebrahim, 2013; Starcevic, 2016), i.e., brand personality is the set of personality traits that are applicable and relevant to the brands (Azoulay & Kapferer, 2003; Starcevic, 2016). This association with traces of human personality occurs by means of learning and experience in contact with the brand (Aaker, 1997; Lin & Sung, 2014; Sung & Kim, 2010).
Brand Personality provides benefits from the identification of related or symbolic values and defines the brand personality as the set of human characteristics associated with a brand (Aaker, 1997). Considering the brand's personality, it is understood that a brand does not act. Instead, a brand has certain physical attributes and performs certain functions, and these factors contribute to the brand personality (Lin & Sung, 2014). In this perspective, the brand personality is not consistent with the notion of human personality, because the human personality is perceived from the individual’s behavior, physical characteristics, attitudes, and beliefs, in addition to the demographic characteristics (Aaker, 1997; Sung & Tinkaham, 2005). It is realized that other factors of such personality may be related to the characteristics of individuals who use the brand to physical or social situations in which the brand is found (Batra, Lehmann & Singh, 1993). The brand can also have a symbolic meaning, either by the prestige afforded by it, or to assist in the identification of an individual as part of a group (Sung & Kim, 2010), creating bonds between the brand and customers (Azoulay & Kapferer, 2003; Machado, 2012; Muniz & Schau, 2005) by facilitating its understanding and communication (Mengarelli, 2008; Zentes, Morschett & Schramm-Klein, 2008).
Aaker (1997) created for a structure of five factors, Big Five model, to the perception of the brands in categories of symbolic products and utilities. These five dimensions are Sincerity, Excitement, Competence, Sophistication, and Ruggedness. Three of these dimensions (Sincerity, Excitement, and Competence) resemble the three dimensions of human personality (Amiability, Extroversion, and Consciousness) that are also present in the model of human personality, while the other two dimensions (Sophistication and Ruggedness) are not consistent with those of the model of five human personalities (Escobar-Farfán & Sanchez, 2016).
Sincerity is regarding aspects such warmth and acceptance, associated to traits such as honesty, truth, and joy (Aaker, 1997) involving mainly the brands that offer guarantees to its consumers and high moral values, in addition to high quality and positive experiences (Maehle, Otnes & Supphellen, 2011).
Excitement is characterized by boldness, animation, and imagination, being associated with aspects such as sociability, energy, and activity (Aaker, 1997) creating exciting experiences for consumers. This induces the affective dimension of consumers (Maehle & Supphellen, 2010; Maehle, Otnes & Supphellen, 2011).
Competence incorporates factors such as accountability, trust, security, and intelligence (Aaker, 1997). In general, associated with brands of high technology with high standards of quality with market-leading products or with tradition (Maehle, Otnes & Supphellen, 2011).
Sophistication is characterized by aspects such as fascinating, pretentious, charming, soft, and romantic. Perceived by the consumer by the high level of exclusivity or cost of acquisition (Aaker, 1997; Maehle, Otnes & Supphellen, 2011; Maehle & Supphellen, 2010).
Ruggedness characterizes a brand as resistant, strong, and austere. Present in brands of cars or motorcycles strongly masculine, in cigarettes and in men’s clothing (Freling, Crosno & Henard, 2011; Maehle & Supphellen, 2010; Freling & Forbes, 2005).
Brand Personality expands the emotional and affective side of a brand as well as the levels of trust and brand loyalty (Brakus et al., 2009; Molinillo, Sandoval, Fernández-Morales & Coca-Stefaniak, 2016; Ramaseshan & Stein, 2014; Sung & Kim, 2010), creating preferences and increasing the use of the brand (Freling & Forbes, 2005; Machado, 2012), interfering directly in the purchase intentions of consumers (Freling et al., 2011).
Hypothesis 5: The brand personality is a second-order construct, formed by the constructs of first-order sincerity, excitement competence, sophistication, and ruggedness.
Hypothesis 6: The brand personality has a significantly positive effect on satisfaction.
Hypothesis 7: The brand personality has a significantly positive effect on loyalty to the brand.
Satisfaction
Satisfaction is defined as something pleasurable, given that the consumer seeks for in consumption to meet some need, desire, purpose, etc., and that this search must be pleasant (Oliver, 1980), being a subjective emotion of an individual from his or her assessment of the experience with a product or service, considering this may be favorable or not, according to his is her expectation to be answered or not (Hsu, Chang & Chen, 2012; Lee, Moon, Kim & Yi, 2015; Santos, Moura, Vasconcelos & Cunha, 2017), i.e., if his or her performance expectations of the product or service is achieved (Agustin & Sigh, 2015; Cruz, 2013; Lima, Moura & Souki, 2015; Pedragosa & Correia, 2009). The advanced expectation of the product performance will be compared with the results obtained after the purchase and use of the product. The dissatisfaction occurs when product performance or service is lower than expected. The satisfaction occurs when the product or service performance is better than expected (Oliver, 1980; Pizam, Shapoval & Ellis, 2016). Then, the index of customer satisfaction in this direction can be measured then, according to his or her expectation to be achieved or not (Petruzzellis, D’uggento & Romanazzi, 2006).
Satisfaction is measured from the accumulation of positive experiences from the client to the long period of interaction with a brand (Hsu et al., 2012; Fornell, 1992) and so that this affects the loyalty to it, it needs to be frequent or cumulative so that the positive contacts with the brand in moments of satisfaction be aggregated (Oliver, 1980).
Concerning its consequences, the satisfaction influences the consumers' loyalty (Ahmad, Hussain & Rajput, 2015; Lee et al., 2015; Lima et al., 2015; Sahin et al., 2011), preceding the brand loyalty, since the increasing satisfaction impacts the increase in attitudinal loyalty in relation to the brand (Bennett, Hartel & Mccoll-Kennedy, 2005; Yonn, Kim, Kim, & You, 2016), decreasing the possibility of customers to buy the products from competitors (Petruzzellis et al., 2006; Souza, 2009). The assessments of satisfaction are positively related to the retention and loyalty of customers (Fang, Qureshi, Sun, Mccole, Ramsey & Lim, 2014; Fullerton, 2005; Hsu et al., 2012; Pedragosa & Correia, 2009; Santos et al., 2017).
Loyalty
The term loyalty has often been used in marketing literature interchangeably with its definition and may refer to repeat purchases (Chinomona, 2016; Morrison & Crane, 2007), preferences for brands, commitment, and loyalty to the brand, in addition to being related to a range of contexts of the market, such as loyalty to services, shops, and suppliers (Lima et al., 2015; Shabbir, Khan & Khan, 2017; Sahin et al., 2011).
There are two dimensions of brand loyalty: behavioral brand loyalty and attitudinal. The attitudinal loyalty is conceptualized in this sense as a strong internal arrangement (Kabiraj & Shanmugan, 2011; Sheth, Mittal & Newman, 2001), deep involvement with a product or service preferred (Chaudhuri & Holbrook, 2001; Ramaseshan & Stein, 2014; Jacoby, 1971), ensuring future purchases, even with the strong influences and marketing efforts of competitors that may try to change the consumer behavior (Chinomona, 2016; Algesheimer, Dholakia & Herrmann, 2005). The loyalty attitudinal indicates that the customer perceives a unique value associated with the brand (Chaudhuri & Holbrook, 2001; Ramaseshan & Stein, 2014) and will be more inclined to repeat the purchase (Bennett et al., 2005).
The behavioral loyalty is related simply with the repetition of purchase (Jacoby, 1971; Machado, 2012; Ramaseshan & Stein, 2014), where the repetitive behavior of new purchases of consumers form the bonds of loyalty (Alhaddad, 2015; Bennur & Jin, 2016; Dick & Basu, 1994; Kabiraj & Shanmugan, 2011), generating a consumer feel to a process of repurchase of a brand (Bennur & Jin, 2016; Chaudhuri & Holbrook, 2001). However, it is possible to consider the hypothesis of the customer to buy the same brand just for convenience or force of habit, without meaning that he or she likes more of this brand than the others. In this case, it is a loyalty that is not stable: if the competing brand offers a better price, the customer readily migrates to another Brand (Souza, 2009). Thus, even a repeated purchase may not reflect the actual loyalty to a product, but it can only result from situational conditions, such as brands bought simply by indication of a seller (Dick & Basu, 1994; Kabiraj & Shanmugan, 2011).
Thus, true loyalty exists when there is a repetition of purchase and a high relative attitude toward the brand (Jacoby, Chestnut & Fisher, 1978; Dick & Basu, 1994).
Brand loyalty refers to the consumer’s involvement with the brand, but that this does not guarantee that he or she cannot evaluate alternatives from other providers. Before achieving customer loyalty to the brand it is necessary to present the first superior performance of products and services offered to generate a consumer preference for the continuous quality presented. This satisfaction is the fundamental basis for loyalty, mainly in the stage of affective loyalty (Oliver, 1999).
THE CONCEPTUAL MODEL AND ITS HYPOTHESIS
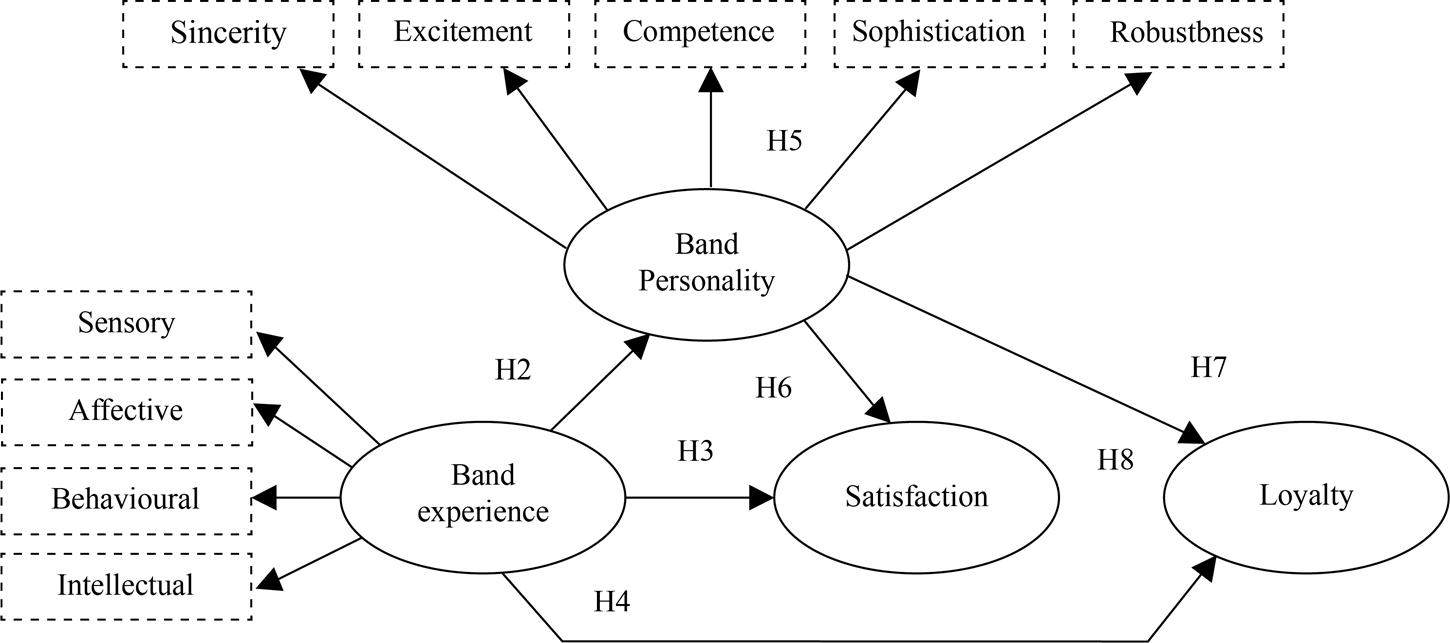
Figure 1 Graphical representation of the model used in the research Note: The dashed constructs are constructs of 1st order and the constructs Brand Experience and brand personality are constructs of 2nd order.
Considering the theoretical content exposed and the use of the model of Brand Experience of Brakus et al. (2009), it is shown in Figure 1 the conceptual model and the assumptions present in the relationships among the constructs of the model.
Considering the objectives to test and validate a hypothetical model related to the brand experience it opted for a quantitative approach.
For the elaboration of the scales to be used in the measurement of the constructs, it was opted for already tested and validated scales. The relationship of the scales that comprise the questionnaire, as well as their sources is presented in Table 1 below.
The questionnaire presented as a question filter the possession of a cellular phone on the part of the respondent for the continuation of the completion of the questionnaire.
The questionnaire was initially composed by a range of interval type with 11 points, having as anchors the expressions “Completely Disagree” and “Completely Agree”. The scale presented values between 0 and 10 points. Concerning the choice of this type of scaling, there are authors like Nunnaly & Bernstein (1994) who describe the scale of eleven points to be preferable in relation to the scales of seven points to represent interval scales with a continuous identical among the values. In addition, the scale of eleven points reduces the problems related to extreme symmetry and allows better visualization of the size of the scale to the researcher and the respondent (Fornell, Johson, Anderson, Cha & Bryant, 1996).
Table 1 Indicators and constructs used in research and their sources.
| Construct | Authors |
|---|---|
| Brand experience | Brakus et al. (2009); Khan and Fatma (2017); Khan, Rahman and Fatma (2016); Sahin et al. (2011); Nysveen, Pedersen and Skard (2013). |
| Brand Personality | Brakus et al. (2009); Aaker (1997); Nysveen et al. (2013); Machado (2012) |
| Satisfaction | Brakus et al. (2009); Khan et al. (2016); Oliver (1980) |
| Loyalty | Yoo and Donthu (2001); Brakus et al. (2009); Khan and Fatma (2017); Sahin et al. (2011) |
Source: Prepared by the authors.
The next step was the completion of a pre-test to check for possible problems with the questionnaire. 35 respondents were interviewed, and the main complaints were related to the size of the questionnaire and the perception that the questions are in some situations quite repetitive. Despite this, no significant modifications were required in the wording of the questions. Finally, a question was duplicated in different locations of the questionnaire. The objective was to verify the level of attention and care with which the interviewees answered the questionnaire.
The next step was to collect data, which occurred via the internet. The questionnaire was developed from the platform Google Forms and the disclosure occurred by means of tool Facebook Ads. The sampling with the data collection process used can be considered a sample by convenience.
A total of 716 questionnaires initially considered valid were obtained. 100 elements were removed for which the difference among the identical issues was three or more points. The questionnaires were also checked with bias responses, in addition to people who inadvertently or not, answered the questionnaire more than once. Thus, over 46 questionnaires were removed from the sample, which was comprised of 570 elements, a number considered appropriate, since it obtained more than 10 elements of the sample for each indicator that form the constructs used (Hair, Black, Babin, Anderson & Tathan, 2009). The total number of questions in the questionnaire concerning constructs is 36 questions and is presented in Table 3.
The interpretation of the results was subjected to multivariate statistical analysis - multivariate statistics, data processing (missing data, normality, outliers and alike), unidimensional and reliability of the constructs (exploratory factorial analysis, AlphaCronbach, convergent validity, and discriminant validity) and nomological validity (tests and indices of adjustment). Still, in relation to the process of data analysis, the hypotheses originated in the model tested as reference for the analyses to be carried out were considered.
DATA ANALYSIS
Sample characteristics and Data Treatment
The sample characteristics are displayed in Table 2.
Table 2 Sample Characteristics
| Demographic variable | Sample characteristic | Frequency | Percentage |
| Female | 265 | 53.30% | |
| Genere | Male | 232 | 46.70% |
| Another | 0 | 0.0% | |
| Between 18 years and less than 36 years | 229 | 46.1% | |
| Age | Between 36 years and less than 50 years | 204 | 41.0% |
| Between 50 years and less than 65 years | 59 | 11.9% | |
| 65 years or over | 5 | 1.0% | |
| Up to 1 minimum wage | 10 | 2.0% | |
| Between 1 minimum wage and 2 minimum wages | 33 | 6.6% | |
| Between 2 minimum wage and 5 minimum wages | 128 | 25.8% | |
| Monthly income | Between 5 minimum wage and 8 minimum wages | 107 | 21.5% |
| Between 8 minimum wage and 10 minimum wages | 55 | 11.1% | |
| Between 10 minimum wage and 20 minimum wages | 112 | 22.5% | |
| Above 20 minimum wages | 52 | 10.5% | |
| Complete elementary school, incomplete high school or incomplete technical education | 13 | 2.6% | |
| Education | Complete elementary school, complete high school or complete upper education | 107 | 21.5% |
| Complete higher education or equivalent | 156 | 31.4% | |
| Complete lato sensu graduation (specialization / mba) or complete graduate degrees (master/phd) | 221 | 44.5% | |
| Total of valid questionnaires | 497 elements | 100% |
Source: Data from the survey.
Note: the minimum wage in Brazil is equivalent to approximately 235 dollars per month at the time of data collection.
Another characteristic of the sample is its national scope, with respondents residing in 126 cities present in all Brazilian states (26 states to total) and in Distrito Federal.
The data processing in general begins with the verification of missing data and the withdrawal of elements that have a high incidence of unanswered questions. However, the form developed did not allow the existence of missing data.
Thus, the analysis began with the verification of multivariate outliers, which were identified by means of the calculation of the Mahalanobis distance (D2 Mahalanobis distance), which is calculated from the distribution of X2 test with the significance of 0.001 and with the number of degrees of freedom representing the number of quantitative questions to be used in the multivariate statistical analyzes. Those elements of the sample which presented values of D2 Mahalanobis distance above the value of the X2 test were considered multivariate outliers. After analysis of each element, 73 questionnaires were removed, and the sample was composed of 497 elements.
Then it was verified the normality of the sample through the Kolmogorov Smirnov Test (Test K-S). The results showed a p-value < 0.05 for all the questions, indicating the violation of normality and the need of using robust statistical techniques to this type of violation.
Verification of Unidimensional, Reliability, Convergent Validity, and Discriminant Validity.
The next step concerns the verification of the unidimensional of each of the constructs, i.e., check if each construct represents only one dimension from the empirical data collected. Thus, an exploratory factor analysis (EFA) was performed for each of the 11 variables present in the model.
For the accomplishment of EFA, it is necessary to examine three assumptions for the validity of the results achieved. The first one indicates that there must be a high level of correlation among the items that constitute the construct. This can be checked by means of the analysis of the level of significance of correlations among the items of the construct present in the correlation matrix. In addition, Bartlett’s Sphericity test should present a significant correlation among the variables at the level of 95% (Hair et al., 2009). And finally, it is necessary to check if the results of the test of reasonableness of the Kaiser-Meyer-Olkin sample (KMO) have values above 0.70 (Malhotra, 2013; Hair et al., 2009).
The resulting values indicate that all preconditions for the realization of all the EFAs of all constructs present in the model were met. In addition, all constructs showed only one factor, the values of the commonality of indicators were above 0.70, and the values of all indicators showed values above 0.50 as prescribed by Hair et al. (2009).
In addition, it was also verified the reliability of each one of the scales used for measuring the constructs. Therefore, the value of Cronbach’s Alpha was used, which must present values of at least 0.70 (Malhotra, 2013; Hair et al., 2009).
Again, the results were positive, because, all constructs showed values above 0.88 as shown in Table 3.
Another item that was checked was the convergent validity, which indicates a strong relationship among all the items that make up the construct (Malhotra, 2013; Hair et al. 2009). Thus, the convergent validity was verified for all the 11 constructs present in the model, considering the first-order constructs of affection, sensory, behavioral and intellectual - for the second-order construct brand experience -; and sincerity, excitement, competence, sophistication, and ruggedness - for the second-order construct brand personality.
For the test of convergent validity, the average variance extracted (AVE) and composite reliability (CR) are calculated. For the existence of convergent validity, the value of AVE must be equal to or greater than 0.50 and the value of the CR must be at least 0.70 (Hair et al., 2009). The results also indicate the existence of convergent validity for all the constructs, with the values of all the constructs above 0.50 for AVE and all values above 0.70 for the CR (see Table 3). The values of AVE and CR were also calculated for the second-order constructs brand experience (formed by sensory, affective, behavioral and intellectual) with values of 0.797 and 0.940 for AVE and 0.940 for CR for the second-order construct brand personality (formed by competence, excitation, ruggedness, sincerity, and sophistication) with values of 0.93 for AVE and 0.993 for CR.
Table 3 Values of exploratory factorial analysis, verification of the reliability, and convergent validity.
| Construct | Description of the Items | Component | Standardized factorial loading |
| Brand Experience / Sensory | Brand X generates a strong impression in some of my senses (sight, hearing, touch, smell, or taste). | 0.945 | 0.844 |
| V.E. 90.13% KMO = 0.772 B.S. = | I find brand X attractive in relation to sensations | 0.949 | 0.860 |
| 1,401.909 Sig. = 0.000 A.C. = 0.945 A.V.E. = 0.852 C.R. = 0.945 | Brand X generates a strong impression in some of my senses (sight, hearing, touch, smell or taste). | 0.955 | 0.877 |
| Brand Experience / Affective | Brand X causes feelings and emotions for me. | 0.946 | 0.893 |
| V.E. 89.68% KMO = 0.752 | I feel strong emotions for Brand X. | 0.963 | 0.920 |
| B.S. = 1.403.538 Sig. = 0.000 A.C. = 0.942 A.V.E. = 0.847 C.R. = 0.943 | Brand X is an emotional mark. | 0.932 | 0.831 |
| Brand Experience / Behavioral | I move (act, stir, leave the place, swing) my body when I use this Brand X. | 0.927 | 0.778 |
| V.E. 86.34% KMO = 0.757 | Brand X arouses in me the desire to move | 0.941 | 0.874 |
| B.S. = 1.108.023 Sig. = 0.000 A.C. = 0.920 A.V.E. = 0.796 C.R. = 0.921 | Brand X is a movement-oriented brand (action, activity, etc.) of the people. | 0.920 | 0.757 |
| Brand Experience / Intellectual | I have many thoughts when I use the cell phone of this Brand X. | 0.943 | 0.869 |
| V.E. 89.70% KMO = 0.744 B.S. = | Brand X makes me think about things. | 0.965 | 0.954 |
| 1.416.288 Sig. = 0.000 A.C. = 0.941 A.V.E. = 0.848 C.R. = 0.944 | Brand X stimulates my curiosity and my ability to solve problems. | 0.933 | 0.818 |
| Satisfaction V.E. 94.09% | I am satisfied with the Brand X and with its performance. | 0.942 | 0.838 |
| KMO = 0.867 B.S. = | My choice of buying a cell phone for Brand X was correct. | 0.979 | 0.953 |
| 3.396.260 Sig. = 0.000 A.C. = 0.979 | I feel good about my decision to choose brand X. | 0.982 | 0.980 |
| A.V.E. = 0.925 C.R. = 0.980 | In general, I am satisfied with my choice for Brand X. | 0.977 | 0.951 |
| Loyalty V.E. 81.38% | I consider myself loyal to Brand X. | 0.913 | 0.897 |
| KMO = 0.784 B.S. = | I don’t buy another brand if Brand X is available in the store. | 0.892 | 0.851 |
| 1.668.896 Sig. = 0.000 | If I have financial conditions, I think it is worth buying the mobile phone of Brand X | 0.888 | 0.856 |
| A.C. = 0.921 A.V.E. = 0.816 C.R. = 0.947 | I will buy a mobile phone of Brand X. | 0.914 | 0.858 |
| Brand Personality | Being “realistic” is one of the characteristics of Brand X. | 0.910 | 0.801 |
| Sincerity V.E. 82.14% | Being “honest” is one of the characteristics of Brand X. | 0.913 | 0.884 |
| KMO = 0.787 B.S. = 1.723.706 | Being “healthy” is one of the characteristics of Brand X. | 0.904 | 0.507 |
| Sig. = 0.000 A.C. = 0.927 A.V.E. = 0.823 C.R. = 0.949 | Being “happy” is one of the characteristics of the Brand X. | 0.899 | 0.427 |
| Brand Personality/ | Being “dare” is one of the characteristics of Brand X. | 0.954 | 0.7918 |
| Excitement V.E. 86.40% | Being “cheerful” is one of the characteristics of Brand X. | 0.918 | 0.499 |
| KMO = 0.852 B.S. = 2.056.755 | Being “imaginative” is one of the characteristics of Brand X. | 0.954 | 0.787 |
| Sig. = 0.000 A.C. = 0.947 A.V.E. = 0.832 C.R. = 0.951 | Being “updated” is one of the characteristics of the Brand X. | 0.890 | 0.887 |
| Brand Personality/ | Being “reliable” is one of the characteristics of Brand X. | 0.935 | 0.857 |
| Competence V.E. 90.02% KMO = 0.754 | Being “intelligent” is one of the characteristics of Brand X. | 0.964 | 0.917 |
| B.S. = 1.432.449 Sig. = 0.000 A.C. = 0.944 A.V.E. = 0.853 C.R. = 0.945 | Being “successful” is one of the characteristics of the Brand X. | 0.947 | 0.894 |
| Brand Personality / Sophistication V.E. 90.60% | Being “high society” is one of the characteristics of Brand X. | 0.952 | 0.868 |
| KMO = 0.500 B.S. = 532.610 Sig. = 0.000 A.C. = 0.896 A.V.E. = 0.813 C.R. = 0.897 | Being “fascinating” is one of the characteristics of the Brand X. | 0.952 | 0.839 |
| Brand Personality / Ruggedness V.E. 89.79% | Being “liberating” is one of the characteristics of Brand X. | 0.948 | 0.745 |
| KMO = 0.500 B.S. = 495.972 Sig. = 0.000 A.C. = 0.886 A.V.E. = 0.796 C.R. = 0.886 | Being “strong” is one of the characteristics of the Brand X. | 0.948 | 0.816 |
Source: Data from the survey.
Notes: 1) V.E. is the variance explained by the factor. 2) K.M.O is the value of the KMO test. 3) B.S. is the value of Bartlett’s sphericity test. 4) Sig. is the statistic values of Bartlett’s Sphericity test. 5) A.C. is the Cronbach Alpha value. 6) A.V.E. is the average variance extracted. 7) C.R. is the composite reliability. 8) * As the construct is formed by two factors, the value of KMO is 0.500.
The next step is the verification of discriminant validity. Its analysis consists of the comparison of the value of the correlations between the constructs with the values of the square root of AVE of these constructs. Hair et al. (2009), considers that there is discriminant validity when the value of the square root of AVE is greater than the value of the correlation among the constructs. In addition, the values of the correlations even that meet the previous criterion, might be lower than 0.85 for the existence of the discriminant validity (Anderson & Gerbing, 1988). The results of the discriminant validity can be verified in Table 4 below.
The present results in Table 4 indicate that the discriminant validity is confirmed for all the six relations among the four constructs present in the hypothetical model.
In relation to the verification of hypotheses, all of them were tested by means of Structural Equation Modeling (SEM), and its results are presented in Table 5.
From the data obtained - see Table 5 -, it is verified that only the hypothesis 3 was not supported, indicating that the nomological validity was achieved partially.
In hypothesis 1, it was verified that the four constructs of the first order as described in theory form the construct of second brand experience. The first order constructs that most influences the formation of brand experience were the experience affective. This result is consistent with those found by Brakus et al. (2009) and to those found by Nysveen et al. (2013).
It was found that the brand experience has a significant effect (p< 0.01 and β = 0.35) on the brand personality, supporting hypothesis 2. In this case, a better perception of consumers about brand personality is one of the consequences of positive brand experiences for them. This result is in line with the findings of Brakus et al. (2009), Walter et al. (2013) who investigated the experience of brand BMW, Cleff et al. (2013) who investigated the experience of Adidas brand, the results of Keng et al. (2013), the results of Ramaseshan and Stein (2014) who investigated the brands Coca-Cola, Apple and McDonalds, the results of Kim, Lee and Suh (2015) who have researched brands of a shopping center, and finally, the results of Nysveen et al. (2013) who have researched brands of mobile telephony, cable TV and broadband internet access.
Table 4 Discriminant validity: correlations between the constructs and the square root of AVEs
| Brand experience. | Brand Personality. | Satisfaction | Loyalty. | |
| Brand experience | 0.893 | |||
| Brand Personality | 0.347 | 0.982 | ||
| Satisfaction | 0.495 | 0.787 | 0.962 | |
| Loyalty | 0.647 | 0.803 | 0.843 | 0.903 |
Source: Source: Data from the survey.
Notes: The brand experience is a second-order construct, formed by the constructs of the first-order experience sensory, affective-experience, behavioral-experience, and intellectual-experience. The brand personality is a second-order construct, formed by the constructs of first-order sincerity, excitement competence, sophistication, and ruggedness.
Table 5 Verification of the hypotheses of the study
| Hypothesis: | Standardized Path Coefficient1 | T-test significance | Results |
| H1 the brand experience is a second-order construct, formed by the constructs of first-order experience-sensory, affective experience, behavioral-experience, and intellectual-experience. | 0.77 0.89 0.80 0.84 | *** *** *** *** | Supported |
| H2 the brand experience has a significantly positive effect on brand personality. | 0.35 | 0.00196** | Supported |
| H3 the brand experience has a significantly positive effect on satisfaction with the brand. | 0.07 | 0.12065 | Rejected |
| H4 the brand experience has a significantly positive effect on loyalty to the brand. | 0.10 | 0.02481* | Supported |
| H5 the brand personality is a second-order construct, formed by the constructs of first-order sincerity, excitement competence, sophistication, and ruggedness. | 0.77 0.91 0.98 0.99 0.99 | *** *** *** *** *** | Supported |
| H6 the brand personality has a significantly positive effect on satisfaction. | 0.63 | *** | Supported |
| H7 the brand personality has a significantly positive effect on loyalty to the brand. | 0.25 | *** | Supported |
| H8 Satisfaction has a significantly positive effect on loyalty to the brand. | 0.55 | *** | Supported |
Source: Data from the survey.
Notes: *** Significant relationships at the level of 0.001. ** Significant relationships at the level of 0.01. * Significant relationships at the level of 0.05. 1) in H1 the values presented for the standardized path coefficient refers to first-order constructs, respectively: experience-sensory, affective experience, experience-behavioral, and intellectual-experience. In H5 the values presented for the standardized path coefficient refers to first-order constructs, respectively: sincerity, excitement, competence, sophistication, and ruggedness.
It was also found that the brand experience does not significantly influence consumer satisfaction, generating the rejection of Hypothesis 3. It is important to emphasize that although this result was not expected, and that it is different from the results obtained by Brakus et al. (2009), Cleff et al. (2013), Tsai et al. (2015) and also to the results obtained by Sahin et al. (2011), in which the consumer satisfaction is one of the consequences of a positive brand experience. However, this result was also found by Walter et al. (2013), and in the case of the work of Nysveen et al. (2013), this relation was inversely proportional. An explanation for this fact may be the type of product of the chosen brand which was the smartphone that despite having multiple functions and basically being an “information center” maybe that still possesses a functionalist perception on the part of their users, minimizing the relationship between brand experience and satisfaction, which did not occur in studies in which the brands were Adidas, Coca-Cola, Apple, McDonald's, brands of a shopping center, among others.
Hypothesis 4 was supported, indicating that the brand experience influences significantly (p< 0.05 and β = 0.10) the consumers' loyalty. Despite the confirmation of the hypothesis, in practical terms, the direct influence of the brand experience on loyalty is low (β = 0.10). Despite this result, contrary to the findings of Brakus et al. (2009) with β = 0.24, it is compatible with the statistically significant low values of Nysveen et al. (2013) with β = 0.07 and close to the values found by Ramaseshan and Stein (2014) of 0.15 for loyalty to the purchase and 0.13 for the attitudinal loyalty. Kahn and Fatma (2017), Cliff et at. (2013) and Kim et al. (2015) presented higher values as well - in some cases above the double - for the standardized path coefficient between brand experience and consumers loyalty in comparison with the original work of Brakus et al. (2009).
In hypothesis 5, it was verified that the five constructs of the first order - as described in theory- form the construct of second brand experience. The first order constructs that most influenced the formation of brand personality were sophistication, ruggedness, and competence. These results are partially different from those found by Brakus et al. (2009) and to those found by Nysveen et al. (2013), in which the competence construct was the one that most influenced the formation of the second-order construct, brand personality.
It was verified that the brand personality significantly influences the consumers' satisfaction (p< 0.001 and β = 0.63), supporting hypothesis 6. This result is consistent with the recommendations and with the results obtained by Brakus et al. (2009) and the ones found in studies by Kim et al. (2015), Cleff et al. (2013), and Nysveen et al. (2013). Only the study of Walter et al. (2013) did not find a significant relationship between brand personality and satisfaction. In terms of the standardized path coefficient, the value of β = 0.63 is very close to the values of Kim et al. (2015) with β = 0.65 and Brakus et al. (2009) with β = 0.67, well above Cleff et al. (2013) with β = 0.17 and below the value of β = 0.81 found by Nysveen et al. (2013).
Another relationship analyzed is represented by hypothesis 7, in which the brand personality significantly influences consumer loyalty. The value found β = 0.25 with p< 0,001 make the hypothesis 5 supported. This result is in line with results obtained by Cleff et al. (2013) with β = 0.39, the result of Brakus et al. (2009) with β = 0.13, the result of Nysveenet al. (2013) with β = 0.12 and with the result of Walter et al. who identified a significant correlation with an r = 0.47. Only the study of Kim et al. (2015) did not find a significant relationship between brand personality and consumer loyalty.
Hypothesis 8 describes that satisfaction significantly influences consumer loyalty. Again, this hypothesis was supported based on the values of β = 0.55 with p< 0.001. This significant relationship was also found by Kim et al. (2015) with β = 0.52, to the result of Nysveen et al. (2013) with β = 0.81, the result of Brakus et al. (2009) with β = 0.59 and the result of Cleff et al. (2013) with β = 0.19. Again, the study of Walter et al. (2013) did not find a significant relationship between brand personality and consumer loyalty.
Another result that is analyzed is the explained variance of the endogenous constructs. The value obtained for the brand personality was an R2 of 9.95%, lower value than the R2 found by Nysveen et al. (2013) which was 22.6%. Regarding satisfaction, the value obtained was 43.4%, which is slightly higher than that found by Khan and Fatma (2017) that was 39%, but below the value of 58.7%. Finally, loyalty showed the value of R2 equal to 59.5%, which is a value above 51% for the loyalty of purchase and 47% for the attitudinal loyalty to the brand (Khan & Fatma, 2017), but below the value of R2 of 86.6% found per Nysveen et al. (2013).
In the analysis of the SEM, it is also necessary to check the values of the indices of adjustment. Thus, the values were of indices of GFI adjustment were recorded (Goodness of Fit Index), the X2/df, and the RMSEA index (Root Mean Square Error of Approximation). GFI presented a value near - 0.84 - to the appropriate value that is at least 0.90. X2/df was 2.52, which is a value within the range of appropriate values which varies between 1 and 3. The same occurs with the RMSEA index with a value of 0.055 within the acceptable range from 0.03 to 0.08 (Hair et al., 2009). In the case of GFI value, it is necessary to describe that in more complex models in conjunction with samples above 250 elements there should be a less restrictive assessment in relation to the values indicated as appropriate for the indices of adjustment (Hair et al., 2009), i.e., even if the values of the indices are not met, it is possible to evaluate these indices with values close to those of reference. The model tested has a total of thirteen constructs - considering the first order and the second order, being formed by thirty-six indicators.
The results of the indices of adjustment of this research reach the results of other studies published. Brakus et al. (2009) obtained the value of 0.86 for GFI, 5.4 for X2/df, and 0.08 for the RMSEA. Nysveen et al. (2013) obtained the value of 0.86 for GFI, 11.7 for X2/df, and 0.098 - out of the standards - for RMSEA. Thus, as these same authors wrote, the indices of adjustment are acceptable, but are not the ideal ones, the same occurring with the current research.
FINAL CONSIDERATIONS
It was found that the model of brand experience has a nomological partial validity, in virtue of which one of the tested hypotheses was rejected. The results indicate that the brand experience significantly influences the brand personality and consumer loyalty. Despite the brand experience not directly influence satisfaction, it influences indirectly for the mediating relationship with the brand personality. In addition, the brand personality influences both the customers' satisfaction and loyalty of Blackberry smartphones as well as satisfaction influences the loyalty.
The theoretical contributions of this study are various. The empirical test of the Model Brakus et al. (2009) is unprecedented in Brazil, as previously observed in studies carried out on the platforms of Google Scholar, Scielo, and CAPES. The knowledge gap of studies related to consumer behavior in different cultures is also highlighted, as occurs in this case specifically in Brazil - despite the sample not being random - with respondents residing in the 27 states of the country and in more than 120 cities.
It is important to consider also that a specific brand was not tested as in previous studies, but the brand of the respondent’s smartphone. Thus, the model of brand experience was tested for several brands at the same time. Another theoretical contribution was the confirmation of the influence of brand management in relation to the consumer’s loyalty, especially in terms of the impact of the brand experience and the brand personality in consumers’ purchasing behavior.
In theoretical terms, this study also found the same problem which had been identified in the study of Cleff et al. (2013), in which the brand experience does not influence the consumer satisfaction with the brand, concluding that there are other factors that influence consumer satisfaction - and consequently their loyalty - that is not present in the model of Brakus et al. (2009). This fact reinforces the need for further studies on the brand experience and on this model.
Considering the managerial implications, the model of the Brand Experience of Brakus et al. (2009) presents an important tool for managers in the quest for consumer loyalty. Thus, from the results obtained it is verified that managers should seek effective ways to differentiate the brand from their competitors by means of management of the personality of their brands, aggregating values related to the sophistication, jurisdiction, sincerity, the excitement and the ruggedness supporting the brands positioning. For a product in the premium category, for example, they may be associated with the values of the brand personality traits related to sophistication and competence, to a service that needs to create greater confidence in customers, the personality related to sincerity can be an effective strategy in market positioning.
Considering the marketing administration, the managers must create ways to generate brand experiences regarding the creation of brand personality and in relation to the brand experience. There are various ways to generate this perception with the public, using the packing, the tangible assets, employees, endorsement of celebrities, among others. The price may assist in the brand positioning, as well as in the formation of their personality, in terms of perhaps the sophistication, for example.
The location or the place of the service provider should generate experiences that may relate to the senses, such as the use of ambient music, essential characteristics, visual appeal, distinctive design, and tasting products that can create remarkable sensory and affective experiences impacting directly on the customer’s loyalty. In addition, one should suit the sales channels and strategies of the location, direct to customers exploring as well as the customers’ sensory and intellectual experiences it is possible to obtain subjective responses of consumption (sensations, feelings, and cognition), as well as good behavioral responses generated by the brand. Such stimuli may be part of the brand management, its identity, packaging, communications, and environments, as well as this may be distinct in several dimensions of experience (sensory, affective, intellectual, and behavioral).
Finally, it is also possible to highlight that the promotional mix formed by direct marketing, sales forces, promotions, public relations, and advertising can and should generate brand experiences, as well as helping to build a brand personality that is in accordance with the brand positioning and with the self-expression of their target audience.
In relation to the research limitations, initially, it is necessary to emphasize that the sample is not probabilistic, which limits the generalization of the results obtained. It is important to consider also the necessity of several waves requesting the respondents’ participation. As it was also requested the disclosure among the respondents and disclosures were performed in research and related sites, it was not possible to assess the response rate of the questionnaires.
In terms of future studies, it is possible to research regarding the history of the brand experiences, for example, how a brand can be related to stimuli related to names, logos, colors, shapes, which are part of marketing strategies? According to Schmitt (2009), similar issues can be investigated for other marketing tools (advertising, sales promotions, new means of communication). For example, how do these tools cause experiences?
Another possibility for future research is related to the consequences of the brand experience. Thus, can the experiences build brand value for the customer? What would be the relationship between Brand experience and other brand constructions? Previous studies basically worked with brands of products; thus, the doubt arises: are there differences in the brand experience between products and services?
It is still possible to think in new versions of the model, Brakus et al. (2009), by inserting other constructs that may enhance the explanatory power of the consumers' loyalty, such as the brand equity or even the brand love and that may mediate the relation between the brand experience and consumer satisfaction.

