


 English (pdf)
 Article in xml format
 Article references
 Send this article by e-mail
 Cited by SciELO
  Cited by Google
  Similars in
SciELO
Similars in
SciELO  Similars in Google
 Permalink
INTRODUCTION
This is a technical report that seeks to review the forecast options on the Mexican stock exchange. Its objective is to support subsequent studies of the financial sector.
One of the most important tasks in economics and finance is the analysis of assets. Among these, the prediction of data such as the most difficult one stands out. This analysis is approached as univariate methods when historical fluctuations are considered to estimate future prices with homogeneous, normal and homoscedastic characteristics, the multivariable when it is considered that the price is influenced by variables in other fields of economics and finance, either microeconomic or macroeconomic. In any case, their study typically involves the classic econometric based on statistics; this is, depends to a large extent that the data sets can be defined with the characteristics shown.
When considering the results of reality in enough detail, the behavior of the data does not correspond exactly with the assumptions of the methodologies commonly used in finance for the explanation and analysis of time series. Price behavior has shown that it does not have a normal distribution, so classical models are not appropriate to detect patterns and predict future values with enough accuracy (Zhang, 2004). We want to highlight that the predictions do not establish patterns of absolute compliance, but rather probabilities of understanding the future development of the data.
As a solution to these circumstances, apparently the use of machine learning for prediction and classification of this tasks has grown in recent years. For price forecasting, machine learning models have shown to be superior to traditional models, such as those based on linear regression (LR) and those of Box Jenkins theory (AR, ARMA, ARIMA); particularly, neural nets (NN) have had more acceptance. Nevertheless, there is a wide range of models in the computer science that have shown good forecasting capabilities and have not been completely exploited in economics and finance.
Several machine learning technologies and tools with prediction capabilities are widely available. Many financial analysts have used some models to discover hidden patterns in historical datasets which have helped them to manage portfolio allocation (Kanna, Sekar, Sathik & Arumugam, 2010), particularly, as regression for classical time series analysis of prices (Rasheed & Alhaji, 2012); using hybrid models trying to exploit features of different predictors, for example neural nets with GARCH, ARIMA and ARMA (Plata, López, & Almagro, 2007); and bio inspired algorithms (Pulido, Melin & Castillo, 2014).
This study presents an evaluation of five traditional methodologies of machine learning:
When applying these techniques, it is part of recognizing that have shown good performance in pattern recognition tasks to determine the Prices and Quotations Index of the Mexican Stock Exchange (PQI) after the 2008 crisis. The objective of this article is to explore these models to evaluate its performance in comparison to the commonly used linear regression (LR) and neural nets (NN), widely used in finance.
The paper is organized as follows: In section II, we review the related literature with respect to previous studies of the concerned index; the methodology and datasets are described in section III; and, the results and their discussion are described in section IV; some final options and conclusions are given in section V.
RELATED LITERATURE
The Mexican Stock Exchange is considered an emerging market and is one of the most important of Latin America due to its liquidity and volume of operations. As a target for domestic or foreign investments it is for the interest of companies that they have tools to do estimates of price tendencies and future values, useful for decision making, while it can contribute to reducing the risk derived from the possibility of erratic action by local agents and markets, as well as externalities resulting from other actions or other international markets.
In Merh, Sexena & Pardasani (2011), the authors developed two models, one using Artificial Neural Networks (ANN) and other using ARIMA to analyze the behavior of Sensex prices (BSE 30). In their study, open, high, low and close prices of the Sensex were used as variables. Daily quotations were used, from April 16th of 2004 to April 16th of 2009. They built an ANN model with four neurons as the input layer, four as the hidden layer and one as the output layer. They found that the accuracy obtained for ARIMA (1,1,1) was better than the ANN (4-4-1) using the absolute percentage error as evaluation method.
Similarly, in Llanos & Arango (2012), it is stated that neural networks are an effective technique for analyzing the Mexican Stock Exchange performance. The model evaluated was univariable with historic quotations of the Price and Quotations Index (PQI) from November 8th of 1991 to January 27th of 2001. The authors used differential neural network analysis (DNNA) for estimating the evolution of the PQI behavior. Their findings include that for datasets in and out of the sample they obtained errors between 0.5% and 0.8%.
The authors, Rasheed & Alhaji (2012), recognized the contribution of periodic pattern analysis for predicting tendency in stock market prices. The proposed model was multivariable, comprised of the following twenty-three factors based on the ratios: the stock price for the day, number of shares outstanding, return on assets, earnings per share, investment to liability, operating income, gross margin, profit margin, revenue, volatility and industrial average volume corresponding to daily quotations from September of 2000 to December 2009. The authors used the suffix-tree algorithm to detect periodicity of the repeat substrings. They used a Sustainability Transitions Research Network (STRN) with algorithm for periodic patterns in non-uniformly sample series. They concluded that periodic patterns could help identify trends for a stock to facilitate the decision-making process in investments.
In Valdivia & Morales (2016), the authors implemented a neural network to determine the relative variable impact between the Mexican Price and Quotations Index (PQI) and the Dow Jones Industrial Average Index (DJIA), Customer Price Index (CPI), International Reserves (IR), Yields on Treasury Certificates (CETES), Monetary Aggregate (M1) and the Mexican Peso Dollar Exchange Rate (ER). The data sets correspond to the quotations from January of 2000 to May of 2015, in monthly prices. The researchers concluded that the factor RI is what shows the most relative impact in the behavior of the index.
Also, the performance of the Mexican Stock Exchange has been examined primarily from a fundamental perspective using macroeconomic factors. Among them we can present the studies of Cabrera, Coronado, Rojas & Romero-Meza (2018) who with Bayesian models studied volatility, mainly caused by variation in exchange rates, financial crises and the prices of some products such as oil. These authors found that the best approaches to a representation of reality are given by switching models in Markovian structures with endogenous determination.
On the other hand, Bermudez-Delgado, Bermudez-Delgado & Saucedo (2018) found that gold positively affects the price of the shares and those of oil negatively affects them, allowing from this conceptualization to establish monetary and fiscal policies. The great weight that, above all, oil has on the Mexican economy must be remembered.
In short, the models presented show a high degree of success subject to the assumptions with which they were built. It is from this perspective that an attempt will be made to test the effectiveness of different forecasting methods in order to determine which is the most efficient in terms of possible supports of the decision makers. In this sense it is hypothesized that the viability of the forecasting mechanism depends largely on exogenous variables such as risk aversion. (Hoque & Shah-Zaidi, 2018; Chang & Huang & Wang, 2019; Najafabadi, Khashei & Bijari, 2019, and many others on the abundant recent literature on the subject).
METHODOLOGY
The model was built using a selection of macroeconomic variables from those found in the literature as relevant determinants for the Mexican Price and Quotations Index (PQI): Index Dow Jones Industrial Average (DJIA), National Index of Prices to Consumer (NIPC), Consumer Price Index (CPI), International Reserves (IR), Yields on Treasury Certificates (CETES28), the Mexican peso-dollar Exchange Rate (USDMX), Monetary Aggregate 1 (M1) and Sovereign Default Risk of Mexico (SDRM). The dataset is comprised of monthly prices from January of 2009 to December of 2016.
In order to determine the performance of each methodology we created two test cases: first, using the entire dataset to both train and test the model; and second, training with the dataset minus the last five elements which are used to test the model as predicting values. We also tried the resulting models five periods ahead of time. We ran both test cases for each methodology, and we used Mean Absolute Percent Error (MAPE) as error metric for models’ comparison, the computation of which is given by:
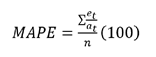 (1)
(1)where:
et mean error on time t, and et = at - ft
at is the current value
ft is the predicted value, and
n the number of elements
The experiments were tested using the platform WEKA 3.8 (Waikato Environment for Knowledge Analysis). This is a free-license toolbox which implements several techniques of predictors and classifiers most used in data mining. The settings of the algorithms used were the defaults given by WEKA.
RESULTS AND DISCUSSION
The following tables show the error percentages (MAPE) for each methodology tested. In each column the results in terms of percentages error from one to five months ahead are shown, the higher and lower percentages of which are in bold. In each table, the months are represented in columns with the number of periods ahead as header, and the methodologies in rows.
For the first test case (Table 1), the Gaussian Processes presented the highest errors as long with the Linear Regression, above 4.0%. In contrast, the Decision Tree obtained the best performance with the lowest percentages of error, lower than 1.0%. The remaining models were not too far from each other, with similar values between 2.0% and 3.5%.
Table 1 Results with in-sample data: from one to five months ahead
| MAPE (%) | |||||
| MODEL | 1 | 2 | 3 | 4 | 5 |
| Multilayer Perceptron | 2.02 | 2.23 | 2.37 | 2.61 | 2.67 |
| Gaussian Processes | 4.36 | 4.93 | 4.98 | 4.78 | 4.38 |
| Data Table | 2.42 | 2.39 | 2.39 | 2.43 | 2.56 |
| Decision Tree | 0.14 | 0.22 | 0.41 | 0.68 | 0.71 |
| Support Vector Machine | 2.3 | 2.92 | 3.16 | 3.33 | 3.24 |
| Linear Regression | 2.83 | 3.87 | 4.49 | 4.88 | 5.07 |
Fuente: Authors
For the second test case (Table 2), the Data Table presented the best performance with the lowest error percentages, lower than 2.0%. The worst percentages were for the Linear Regression, above 7.0%; the Gaussian Processes obtained similar values. In this test, the Multilayer Perceptron stayed in a range close to the worst percentages, between 4.5% and 6.0%, far from the remaining models whose range was not too different from the best result, between 2.0% and 3.0%.
Table 2 Results with out-sample data: from one to five months ahead
| MAPE (%) | |||||
| MODEL | 1 | 2 | 3 | 4 | 5 |
| Multilayer Perceptron | 4.53 | 5.58 | 5.26 | 5.62 | 5.21 |
| Gaussian Processes | 7.75 | 10.11 | 11.14 | 12.43 | 12.56 |
| Data Table | 1.66 | 1.84 | 1.66 | 1.7 | 1.86 |
| Decision Tree | 2.56 | 2.59 | 2.36 | 2.68 | 2.56 |
| Support Vector Machine | 2.26 | 2.33 | 2.07 | 2.44 | 2.67 |
| Linear Regression | 7.16 | 12.22 | 15.32 | 18.32 | 20.07 |
Fuente: Authors
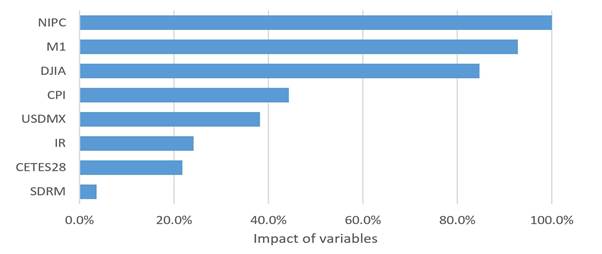
The impact of the macroeconomic variables was obtained from Multilayer Perceptron model 1 (Figure 1). National Index of Prices to Consumer (NIPC) has the highest impact on Mexican Stock Exchange performance. Sovereign Default Risk of Mexico (SDRM) has the lowest impact on Mexican Stock Exchange performance.
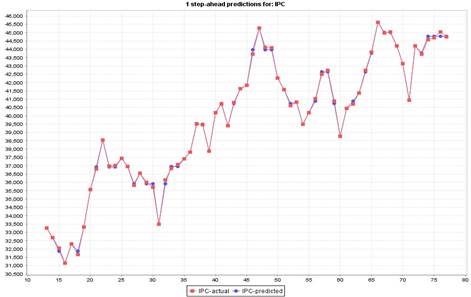
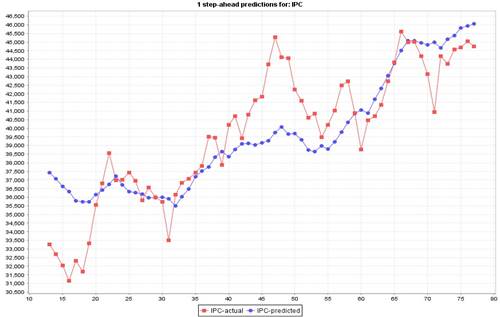
As an example, the Figure 2 and Figure 3 show the observed and predicted models for the worst and the best methodologies in the first test case, Data Table and Gaussian Processes, respectively. It can be observed the fitting degree they achieved.
CONCLUSION
As shown, the explored data mining methodologies resulted in similar performance to the referral models, the linear regression, and Neural Networks particularly to the Multilayer Perceptron. In both test cases at least one of the proposed models had the best performance. Nevertheless, it is observed that the range of error does not vary drastically among the models, they kept competitive. On the other hand, many methodologies are simple and easy to implement, which allows analysts to have their models tested rapidly, in contrast with the well-known neural nets and bio-inspired methodologies which have shown to be highly complex and time consuming.
Similarly, it is very common to find derivations of the main families of Data Mining predictors and classifiers implemented in many common-use tools, from those which required highly skilled programmers to those as WEKA that are user friendly applications. So, it is left to the analyst to be completely focused on the correct interpretation and evaluation of models rather than on their implementation.
In summary, it can be admitted that the predictive instruments are sufficiently reliable, leaving space in this reflection to consider that what makes one or another way of predicting acceptable can depend on exogenous factors of the model used and that it can understand, for example, to the degree of risk aversion of decision makers or any other environment variable and with the ability to iterate or interact with the variables contemplated in the model that shows the problem of Mexican Stock Exchange.

