


Services on Demand
Journal
Article
 English (pdf)
 Article in xml format
 Article references
 Send this article by e-mail
Indicators
-
 Cited by SciELO
 -
 Access statistics
Related links
-
 Cited by Google
 -
 Similars in
SciELO
Similars in
SciELO -
 Similars in Google
Share

 Permalink
Revista EIA
Print version ISSN 1794-1237
Rev.EIA.Esc.Ing.Antioq no.5 Envigado Jan./June 2006
ELECTRONIC SYSTEM FOR EXPERIMENTATION IN AC ELECTROGRAVIMETRY I: TECHNIQUE FUNDAMENTALS
Róbinson Torres1, Antonio Arnau2, Hubert Perrot3
1 Ingeniero Electrónico, Universidad de Antioquia. Estudiante de Doctorado en Ingeniería Electrónica, Universidad Politécnica de Valencia, España. Profesor de Ingeniería Biomédica, EIA-CES, Medellín. pfrotor@eia.edu.co.
2 Ingeniero Electrónico y Doctor en Ingeniería Electrónica, Universidad Politécnica de Valencia, España. Departamento Ingeniería Electrónica. Universidad Politécnica de Valencia. aarnau@eln.upv.es.
3 Ingénieur Chimiste, École Supérieure de Chimie Industrielle de Lyon. Docteur École Centrale de Lyon. UPR 15 du CNRS, Physique des Liquides et Electrochimie, Université Pierre et Marie Curie, París. (LISE Laboratoire Interfaces et Systèmes Electrochimiques), Université P. et M. Curie. perrot@ccr.jussieu.fr.
Artículo recibido 21-IV-2006. Aprobado 18-V-2006
Discusión abierta hasta noviembre 2006
ABSTRACT
Basic fundamentals of AC electrogravimetry are introduced. Their main requirements and characteristics are detailed to establish the design of an electronic system that allows the appropriate extraction of data needed to determine the electrogravimetric transfer function (EGTF) and electrochemical impedance (EI), in an experimental set-up for the AC electrogravimetry technique.
KEY WORDS: AC electrogravimetry; quartz crystal microbalance; electrogravimetric transfer function; conducting polymers; experimental set-up.
RESUMEN
Se presentan los fundamentos de la electrogravimetría AC con el fin de establecer las características y requisitos principales que debe reunir un sistema electrónico que permita la extracción adecuada de los datos necesarios para determinar la función de transferencia electrogravimétrica (EGTF) y la impedancia electroquímica (EI) en un sistema experimental de la técnica de electrogravimetría AC.
PALABRAS CLAVE: Electrogravimetría AC; microbalanza de cristal de cuarzo; función de transferencia electrogravimétrica; polímeros conductores; sistema experimental.
I. INTRODUCTION
At LISE (Laboratory of electrochemical systems and interfaces) in the CNRS (National Centre for Scientific Research) in Paris, an AC electrogravimetry system is used to conduct experimental research in conductive polymers. The AC electrogravimetry system provides the so-called electrogravimetry transfer function (EGTF), i.e., the relationship between the mass change induced in an electrochemical quartz microbalance (EQCM) and the electrochemical voltage variation which induces this mass change on the conductive sensitive layer contacting the working electrode (WE) of the electrochemical cell.
Information provided by an electrochemical impedance spectroscopy (EIS), although not necessary in this technique, can provide additional information very useful when combined with AC electrogravimetry. We will focus this paper on AC electrogravimetry.
The objective of this paper is to analyse the theoretical basics of the AC electrogravimetry experimental system in order to find out the main requirements of an electronic system for improving the accuracy in the determination of the EGTF. A new electronic system will be proposed in an incoming article with a detailed description of the system blocks and operation. In an experimentation framework at LISE, the accuracy of the system will be established as well, in order to corroborate the system's performance to improve the distortion that is presented in actual systems as it will be explained next.
I.1 Electrochemical quartz crystal microbalance fundamentals
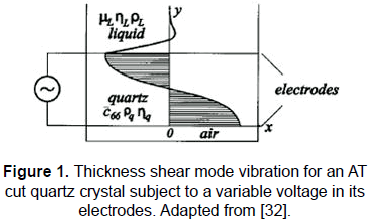
In a classical QCM system an AT cut quartz crystal is typically used as a sensor. When a variable voltage is applied between the facing electrodes deposited on the opposite faces of the crystal a transversal mechanical wave propagates in the direction of the crystal's thickness, i.e., in the direction of the applied electric field (see Fig. 1). This vibration mode is known as thickness shear mode and other vibration modes which happen in the AT cut quartz are normally negligible. The foundation of the QCM is based on the fact that the resonant frequency of the vibrating quartz crystal is extremely sensitive to any mass deposited on the facing parts of the quartz electrodes. A detailed and didactic explanation of how it happens and about the fundamentals of the classic QCM techniques can be found elsewhere [4, 33].
Some years ago, the classic electrochemical techniques were mixed with QCM techniques giving place to the so-called electrochemical quartz crystal microbalance (EQCM) techniques, in which one of the AT-cut quartz crystal electrodes is used as the working electrode in an electrochemical cell. This fact has allowed getting relevant information for understanding charge transport processes at molecular level [3]. This schema provides important information related to electron, ion and solvent activities and mass transfer associated with different electrochemical studies [1, 3, 5-7, 9].
In all the cases, for both QCM and EQCM techniques, the quartz crystal is included in an electronic circuit which electrically excites the sensor. Adequate electronic interfaces must be used to excite the sensor at the appropriate resonant frequency [10]. In many applications an oscillator is used to monitor the resonant frequency shift of the quartz sensor. For a better understanding of the operation of the crystal sensor in the circuit, its electrical impedance is normally modelled through an equivalent electrical circuit whose parameters can be related to the physical properties of the quartz-crystal and the contacting media. This makes possible the use of the quartz-crystal as a sensor by obtaining the acoustic characterization of different processes, both chemical and physical, which occur in those layers of the media very close to the sensor surface. This acoustic characterization can be obtained through electrical measurements which could be transferred into mechanical properties through the electromechanical model and interpreted in terms of physical or chemical interactions.
The simplest equivalent lumped element model (LEM) for describing the impedance response of the unperturbed1 quartz crystal, operating near any of its series resonance frequencies, is the Butterworth Van-Dyke model (BVD) for a piezoelectric resonator [4, 8]. The BVD model is showed in Fig. 2.
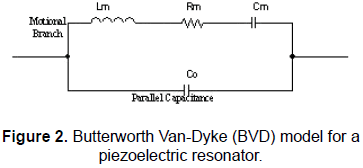
The LEM in Fig. 2 is formed by the "motional branch", composed by the dumped series resonant circuit, Rm, Lm and Cm, whose magnitudes can be directly related to the physical properties of the quartz crystal, in parallel with a capacitor which is the result of the so-called "static capacitance" that arises from the electrodes located on opposite sides of the dielectric quartz resonator and an added external capacitance accounting for packaging, connection, etc.
The resonance frequency of the series branch, i.e., the motional series resonance frequency, for the circuit in Fig. 2 is given by (1):
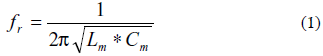
When a quartz crystal is in contact with a liquid the BVD model is modified by the presence of this new component and, as it can be shown elsewhere [32], its contribution can be modelled with an inductance and resistance added into the motional branch of the BVD model. The circuit becomes into the so-called extended BVD model (EBVD) shown in Fig. 3.
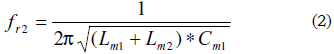
It can be noted that, in a similar way as described in Fig. 3 for the special case of a quartz crystal in contact with a fluid, whatever substance in contact with or deposited on the quartz crystal surface will alter the series resonance frequency with regard to that in the unperturbed state. In the case of a fluid and according to the EBVD model, the new motional series resonance frequency will be given by (2):
A quartz crystal in contact with a thin rigid layer contacting a semi-infinite fluid represents a special case in which the resonance frequency shift due to the global contribution of the media can be expressed as the additive contribution of the frequency shifts due to each medium separately. This special approach follows the well-known Martin equation, and the corresponding EBVD model includes an inductance representing the contribution of the thin rigid layer, as a pure inertial mass contribution, on the impedance response of the sensor [34].
When a thin rigid layer is assumed to be deposited on the quartz sensor, the shift of the motional series resonance frequency corresponding to a mass variation in the deposited layer can be described using the well-known Sauerbrey equation [11]:
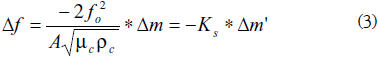
Where:
Δf: Resonance frequency shift
Δm': Surface mass density variation in the deposited layer
A: Effective piezoelectric area
µc: Shear modulus of the quartz
ρc: Quartz crystal density
fo: Fundamental or resonance frequency of the crystal
As indicated above, Eq. 3 is valid assuming rigid film behaviour or negligible phase change of the acoustic wave across the deposited layer. In these conditions the contribution of the viscoelastic properties of the medium in the sensor response is negligible and only inertial contribution is expected [37].
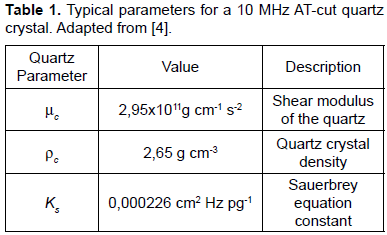
Equation 3 represents the fundamental relationship for the simplest QCM and EQCM techniques. The mass sensitivity given by the linear relation between the resonance frequency shift of the quartz sensor and the mass change given by Eq. 3 is approximately 40 pg/mm2 for a 10MHz AT-cut quartz when a resolution of 1Hz is assumed. This extreme sensitivity allows the detection of atomic interactions close to the quartz sensor and establishes the base for the use of quartz microbalance techniques for electrochemical analyse purposes.
In general, the frequency shift associated with the contribution of the media in contact with the sensor does not follow a simple expression [35]; therefore, it must be understood that the special cases described before have been included with the purpose of explaining in a simple way the basics of the QCM and EQCM techniques. However, it is important to make clear that when the viscoelastic behaviour of the sensitive layer in contact with the quartz sensor can not be neglected in the sensor response, the data interpretation can not be longer made in terms of mass effect. Moreover, the only measurement of motional series resonant frequency and motional resistance shifts are not enough for extracting the sensitive layer properties, and for making any physical or chemical interpretation of what is happening if at least some of the layer properties are assumed to be known. Furthermore, the frequency and resistance shifts provided by typical oscillators are not always related to the motional series resonant frequency and resistance shifts, which are normally taken as the maximum conductance frequency shift and as the difference of the reciprocal of the conductance peaks, respectively. In general, a complete monitoring of the admittance spectrum of the sensor around resonance by means of an impedance analyser gives more precise information. However, the specific characteristics of the AC electrogravimetry which will be explained next makes impossible the use of the impedance analyser for an appropriate monitoring of the interesting parameters. The reason is that an impedance analyser can not follow the very quick changes of the parameters of interest that are induced in this technique, then the best but not the ideal way is to monitor the parameters of interest by an oscillator-like circuit which permits the continuous monitoring of these parameters of interest.
I.2 EQCM experimental systems
The electrochemical systems that use QCM could be catalogued as a potentiostat or galvanostat. In the first type the potential of the specific electrode (cathode or anode) is controlled while in the second type the current through the working electrode is controlled.
Figure 4 shows a typical experimental set-up for potentiostatic EQCM [3]. The system is composed by an electrochemical cell with the three electrodes: the working electrode WE, the reference electrode RE, and the counter electrode CE, according to the structure of a potentiostat system [12, 13]), a potentiostat, a frequency meter, a power source, a controlled quartz sensor oscillator, and a computer.
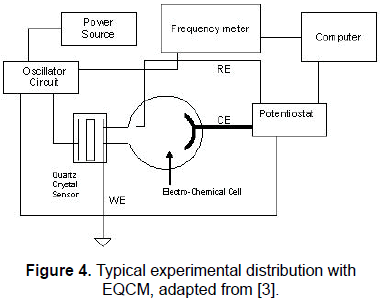
It can be observed that one of the sensor electrodes in the QCM is in contact with the electrolyte inside the electrochemical cell, operating as a working electrode. The working electrode is normally grounded to ensure the complete separation of the electrochemical electric fields from the radio frequency electric fields.
An oxidation-reduction reaction (redox) produced by the application of an electrochemical perturbation, i.e., by the application of a potential difference between the working and reference electrodes, will produce a mass variation in the material layer (conducting polymer) in contact with one face of the QCM. This mass variation, according to Eq. 3, will produce a resonance frequency shift of the sensor and then in the oscillating frequency of the controlled sensor oscillator.
This frequency is monitored in the frequency meter and registered in a central computer, and then the linear relationship described by Eq. 3 can be used to calculate the amount of mass transfer in the experiment.
The potentiostat is concerned to provide the potential difference between working and reference electrodes to produce the electrolysis and to measure the potential difference between working and reference electrodes, during the process, and finally to measure the current of the electrochemical cell.
All these variables must be monitored and can be used to obtain some specific transfer functions important in several electrochemical studies [14, 27].
I.3 AC electrogravimetry
The mechanism by which the charge transfer is produced in the conductive sensitive layer in contact with an electrode or an electrolyte has been a topic of study by several authors, due to its important applications in industrial, environmental, and biological process such as: metal electrodepositing [5], corrosion sensors [28], electrochemical process characterization which governs alkaline batteries [3], study of polymers behaviour in presence of antibodies [27] or for making devices that emulate certain corporal senses function like smell [29], among others.
The redox mechanism has been studied using several techniques, but these do not give all the information needed in order to discriminate with certainty the activity of each particle involved in the process over the conductive polymer, i.e., anions, cations, and solvent or electrolyte [17].
A technique called "AC electrogravimetry", firstly proposed by Gabrielli et al. [14], at LISE (Laboratory of electrochemical systems and interfaces), can be used to discriminate the activity of the different species involved in the charge transfer during an electrochemical process, including the case in which a conductive polymer is used as a substrate. This technique can be combined with EIS (which is used to monitor the impedance of the electrochemical cell during electrolysis) to obtain additional useful information in different applications.
The AC electrogravimetry's operation principle can be explained by means of Figs. 5 and 6.
Figure 5 represents the QCM immerse in a solution with the conductive polymer (electroactive film) to be analysed deposited on the electrode of the QCM which acts as the WE of the electrochemical cell. A low voltage sinusoidal wave is superimposed to a continuous voltage (Es+ΔE) and applied between the reference electrode and the working electrode. This sinusoidal wave will produce a charge transfer (mass variation) in the polymer due to redox processes in the presence of both ions and solvent (M) in the solution.
Figure 6 shows how this mass transfer, produced by the incoming and outgoing of ions and solvent in the polymer, produces a density change and then a resonance frequency shift in the working crystal.
This resonance frequency shift of the crystal is related to the mass change in the working electrode according to Sauerbrey equation (Eq. 3).
Finally, the so-called electrogravimetric transfer function (EGTF) is obtained by combining the voltage change provided by the potentiostat and the mass transfer monitored by the EQCM as Δm/ΔE.
This transfer function is calculated for each frequency of the superimposed sinusoidal wave (modulating signal) by means of a frequency analyser described below in Fig. 9. EGTF and electrochemical impedance data are registered in the computer which provides the graphic analysis.
It is important to make clear that the AC electrogravimetry technique allows both finding relevant results regarding to the kinetic of the ions involved in the process and discriminating the different species participating in the electrochemical process [14-27]. This is possible thanks to the different reacting response of the different species involved in the electrochemical process as a function of the frequency of the superimposed modulating signal.
Figure 7 shows a schematic diagram of a typical EGTF response plotted in a complex plane. This kind of figure is well-known as Nyquist plots and its purpose is to show the behaviour of a magnitude both in amplitude and phase as the frequency changes.
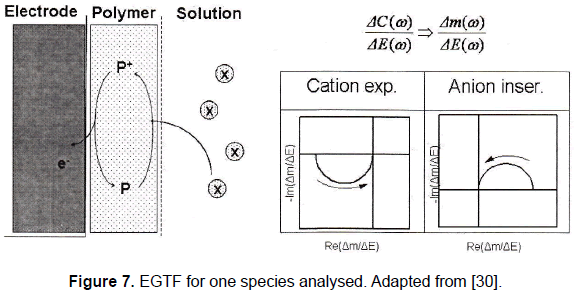
It can be noted that when only one species is involved in the experiment the plot is characterized by one loop. This loop is placed in the first quadrant if the experiment deals with an anion insertion and in the third quadrant if it is a cation expulsion. The arrows in the figure indicate the direction of the modulating signal frequency increase.
This EGTF response found is in concordance with a theoretical model proposed by Perrot et al. [22] in which the EGTF for one species is given by:
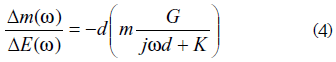
Where:
Δm is the mass variation observed in the polymer
ΔE is the voltage variation applied to the cell
d is the polymer film thickness
m is the ion's molar mass
G is a constant related to a concentration variation
K is the kinetic constant
ω is the angular frequency
The reason for the presence of the plot in the first or third quadrant depends on the sign provided by the constant G (minus for an anion insertion and plus for a cation expulsion).
When three species are involved in the electrochemical process, a response like the one depicted in the Fig. 8 is obtained.
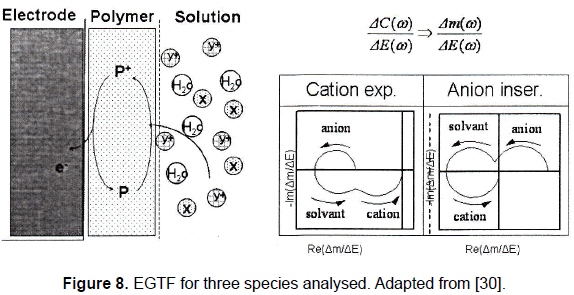
When three species are involved in the process the model is a little bit more complicated [23] due to the contribution of the different species, and the EGTF is given by:
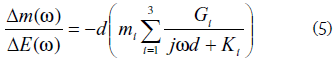
Where i can be anion, cation, or solvent.
From a qualitative and quantitative point of view the characteristics of EGTF plots depend of the physicochemical characteristics of the different species involved in the process [24]. These characteristics are determinants when the discrimination of the substances in the process is mandatory and then are important for the characterization of the polymer under study. Finally, by a fitting procedure the specific kinetics for each species can be determined [24].
Figure 8 shows that the characteristics of the different loops depend on the properties of the species, as it was corroborated in some experimental studies made by Gabrielli et al. [23]; in these studies it could be noted that the main contribution at "low" frequencies is given by the anions, at "mid" frequencies by the solvent, and at "high" frequencies by cations. This indicates that the kinetics of cations is faster than that of the anions.
II. PROBLEM OUTLINE
In order to determine the EGTF, one stage is required for an appropriate continuous measuring of the resonance frequency shift of the quartz crystal microbalance (QCM), for instance, the frequency shift of a quartz crystal sensor controlled oscillator. Moreover, the determination of the EGTF requires a voltage signal accurately related to the resonance frequency shift of the EQCM, both in phase and magnitude.
As it was mentioned, the resonance frequency shift is, taking into account some restrictions, proportionally related to the mass variation of the conductive polymer under study, which has been thin-film deposited on the working electrode of the electrochemical cell [1]. These mass variations are induced by a variable-frequency sinusoidal low potential superimposed to a constant polarisation voltage applied between working and reference electrodes of the electrochemical cell. It can be understood that the QCM output signal is related to a frequency modulation process, where the carrier signal is provided by the sensor controlled local oscillator and the modulating signal is the superimposed sine wave applied to the electrochemical cell2. The modulating signal induces mass variations in the conductive polymer and then in the mass deposited on the working electrode, i.e., on the QCM sensor, due to oxidation-reduction process in the polymer.
Nowadays, at LISE, transfer function equipment is used for a real-time obtaining of the EGTF. For this equipment two input voltages are needed, one is the superimposed sine wave applied to the electrochemical cell and the other one is a voltage proportional to the induced frequency change in the EQCM. As can be understood, an accurate frequency-voltage converter is necessary to avoid any distortion of the EGTF.
Two different approaches are currently used for the frequency-voltage converter based on two analogue frameworks.
The first framework is based on a frequencyvoltage converter composed by a multivibrator that provides a pulse of appropriate constant width at the output at each zero crossing of the input signal. The average value of this output signal is obtained with an appropriate average-value filter and directly related to the frequency shift of the input signal that comes from the EQCM [16].
Another schema is formed by a PLL (phase locked loop), which is a feedback system composed by an analogue mixer working as a phase-detector, a low pass filter, an amplifier, and a voltage controlled oscillator or synthesizer [2].
These systems present problems both for obtaining an appropriate resolution in the frequencyvoltage conversion and for a proper continuous frequency-voltage tracking.
II.1 Problems associated with AC EGTF systems
Since the AC electrogravimetry technique was proposed, two main electronic systems have been used to get the data necessary for the calculation of the EGTF. One of those experimental set-ups is depicted in the figure 9.
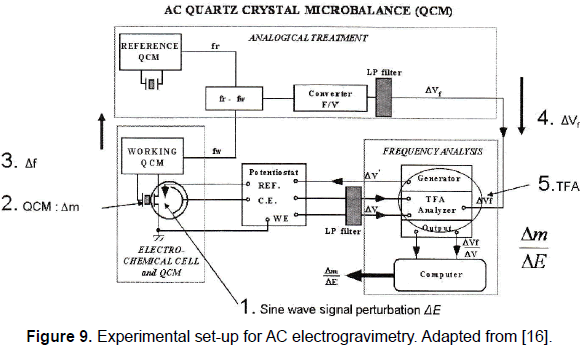
The experimental set-up depicted in Fig. 9 shows an electrochemical cell in which the WE is one of the electrodes of the quartz sensor and ground connected; the QCM is based on a quartz sensor controlled oscillator, and an analogical subsystem composed by several electronic devices to get a voltage variation related to the frequency shift produced by mass variation; a transfer function analyser and a computer to process the data obtained.
In the AC electrogravimetry technique the frequency of the superimposed sinusoidal voltage applied between the reference electrode and the working electrode WE is ranged between a few mHz and 1kHz. It is clear to understand the system like a frequency modulator system in which the carrier signal is provided by the quartz sensor controlled oscillator and the modulating signal is the superimposed sinusoidal voltage applied to the electrochemical cell. It is important to note that the oscillators' frequencies are in the megahertz range meanwhile the sine wave applied has a maximum frequency of 1 kHz. Experimentally frequency shifts (from the frequency of the carrier signal) in the range of 10 to 50 Hz are found when the sinusoidal voltage is applied to the electrochemical cell; this means that it is necessary to measure the frequency shifts very quickly and with high resolution, around 0.1 Hz over 10 MHz in less than 0.1ms. In other words, it is necessary to follow frequency changes in the range of 10-50 Hz over a carrier of 10 MHz very quickly and with high resolution, and additionally these frequency changes have to be converted in voltage changes to be used at the input of the EGTF system. This is not an easy task whose problems will be analysed in detail next.
Let's suppose that a high frequency signal, for instance 10 MHz, is required to be measured. There are several methods for performing this task. One of these is by using a very high frequency signal as a reference, to count up pulses or cycles of this signal during certain time and at the same time to count up the pulses or cycles of the signal whose frequency must be measured; then a simple operation provides the frequency measured. The principle is illustrated in Fig. 10.
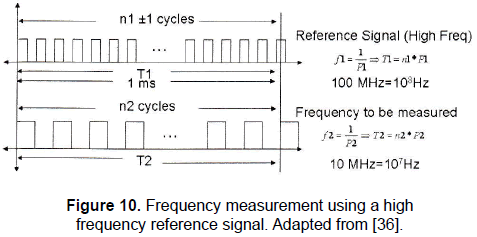
Figure 10 shows a 100 MHz reference signal used to measure the 10 MHz frequency signal. As it can be noted, during 1ms n1±1 cycles are counted, T1 is the time analysed, f1 is the frequency and P1 is the period of the reference signal, meanwhile n2 cycles are counted, T2 is the time analysed, f2 is the frequency and P2 is the period of the signal whose frequency must be measured.
The error in the measurement is given by:
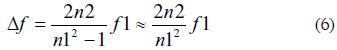
Replacing data from Fig. 10 (n1 = 105 and n2 = 104) in Eq. 6 it is obtained an error of 200 Hz.
This result is useful to show that, unless the frequency of the reference signal is as higher as 10 GHz, any system that uses this method to measure a frequency incurs an error which is not negligible for an AC electrogravimetry system as the one described above where the deviation is in the range of 50 Hz maximum.
Two solutions could be developed to improve both the system's accuracy and resolution: the first one is to increase the temporal window in which cycles from both signal are counted up, and the second one is to increase the frequency of the reference signal. But these two solutions arise with more additional problems that do not allow solving the problem.
In the first case, if the temporal window is increased, the resolution is improved even until 0.1 Hz or more; however, the problem is that it causes a very slow response of the system, which is not a problem for a "static" signal, but in the case of measuring a quickly changing frequency signal (1 kHz, for instance, in AC electrogravimetry set-up) the system is unable to measure the frequency evolution, and only the average frequency during the temporal window is measured.
In the second case, when the reference frequency is increased, some additional problems related to stability and noise of the high frequency signal appear and the measurement becomes more complicated.
As it was mentioned, at LISE, the transfer function equipment used for obtaining the EGTF requires two input voltages, one is the superimposed sine wave applied to the electrochemical cell and the other one is a voltage proportional to the frequency change measured in the EQCM. As can be noted, in addition to a good resolution frequency measurement method, an accurate frequency-voltage converter is necessary to avoid any distortion of the EGTF. This aspect supposes an additional challenge to any electronic system that presumes to recover the voltage proportional to the frequency change.
The first approach currently implemented for the frequency-voltage converter at LISE (see Fig. 9) uses a similar frequency measurement method described above. This system is composed by a multivibrator that provides a pulse of appropriate constant width at its output according to the frequency measured. The average value of this output signal is obtained with an appropriate average-value filter and directly related to the measurement of the frequency shift of the input signal that comes from the EQCM.
This system has to cover all the frequency range variation of the modulating signal (from few Hz until 1 kHz) with good resolution and accurately, but when the pulse width is large ("low" frequency) the system tends to saturation, so a calibration to the dynamic range is required in order to avoid this saturation; however, this calibration reduces the dynamic range of the system and then the resolution as well, mainly when the pulse width is short ("high" frequency). To solve the paradox a trade-off must be established between dynamic range and resolution.
Another schema is formed by a PLL, composed by an analogue mixer working as a phase-detector, a low pass filter, an amplifier, and a voltage controlled oscillator or synthesizer, as it was mentioned. This system executes a down-conversion of the sensor controlled oscillator output signal by mixing with the signal coming from a synthesizer and provides a low frequency modulating signal (a few kHz carrier signal) at the input of the phase-detector; therefore, in order to extract the modulating signal, a low pass and slow response filter must be implemented. This low pass filter is not an inconvenient to the modulation deviation (50 Hz as a maximum), but it is a real inconvenient for the speed of the modulation (1 kHz maximum), and then the conflict between resolution and bandwidth appears again.
Nevertheless, although the experimental set-ups provide good results regarding the polymer characterization, it can be noted that these systems present problems both for obtaining an appropriate resolution in the frequency-voltage conversion and for a proper continuous frequency-voltage tracking. These problems are associated with their inherent performance and produce certain inaccuracy inconveniences which are transferred as a distortion in the transfer function [17, 21].
III. SOLUTION OUTLINE
In order to solve the inconveniences in the measurement of the frequency shift of the modulating signal in the AC electrogravimetry experimental setups is necessary to design a system which has to be able to establish an optimum trade-off between both resolution and bandwidth, and in addition an accurately and continuous frequency-voltage tracking.
The PLL framework is ideal for tracking the frequency of the modulating signal, because this is its inherent behaviour. The problem of slow responses in case of using a low frequency PLL described before could be improved by using a high-frequency PLL. In this case we have to deal with the problem of low resolution or low level of sensitivity in the frequency-voltage conversion. This problem could be avoided by using a voltage controlled crystal oscillator (VCCO) instead a simple VCO in the loop. This configuration will improve the sensitivity while reducing the dynamic range and the PLL lock range; this implies a new problem since it is not known "a priori" the central frequency of the sensor controlled oscillator and then the PLL could not track this signal.
All these problems must be solved in a new system which will be proposed and explained with detail in the second part of the article.
IV. CONCLUSIONS
A detailed study regarding to AC electrogravimetry technique was performed in order to establish the main characteristics and specifications to improve the accuracy, resolution, and bandwidth requirements of the actual AC electrogravimetry setups at LISE (Laboratory of electrochemical systems and interfaces) in the CNRS (National Centre for Scientific Research) in Paris.
These requirements will be covered in a new electronic system, in which a good trade-off between resolution, accuracy, and bandwidth is established to solve the paradox existing in the actual set-ups. This system will be proposed in an incoming paper.
The electronic system mainly needs to deal with the method to improve the system's performance in two ways: obtaining good resolution, until almost 0.1 Hz in the measurement of the frequency deviation of the carrier frequency signal, i.e., the amplitude for the modulating signal related to mass transfer, and enlarge the bandwidth to be able to follow fast changes in this modulating signal (until 1 KHz). In addition, an improving in the accuracy of these measurements is mandatory.
ACKNOWLEDGEMENTS
This work is developed thanks to PETRA II project in the frame of European Alfa project to establish cooperation networks between European Community and Latin American countries for technology and knowledge transfer. In addition the authors are very grateful with the Universidad Politécnica de Valencia, the UPR 15 du CNRS, Laboratoire Interfaces et Systèmes Électrochimiques, Université Pierre et Marie Curie and the Biomedical Engineering program in agreement between Escuela de Ingeniería de Antioquia and Instituto de Ciencias de la Salud. In addition, the authors desire to thank to the Microelectronics and Control Group (Microe) of the University of Antioquia.
_____________________________
NOTAS
1 Unperturbed quartz crystal means in contact either with air or in vacuum, this way the contribution of the media is negligible.
2 It is important to note that the carrier's frequency is the MHz range (6 MHz-10 MHz) meanwhile modulating one is in the Hz range (few mHz until 1000 Hz).
REFERENCES
1. S. Bourkane, C. Gabrielli, M. Keddam. Electrochimica Acta, Volume 34, No 8 1989, pp. 1081-1092. [ Links ]
2. C. Gabrielli, J. J. García-Jareño, H. Perrot. Electrochimica Acta, Volume 46, Issues 26-27, August 2001. [ Links ]
3. H. Varela, M. Malta, R. Torresi. Química Nova. Volume 23 (5), 2000. [ Links ]
4. A. Arnau (ed.). Piezoelectric transducers and applications. Springer, Berlin 2004. Chap 1. [ Links ]
5. S. Bruckestein, M. Shay. Electrochimica Acta 1985, 30, p. 1295. [ Links ]
6. O. Melroy, K. K. Kanazawa, J. G. Gordon, D. A. Buttry. Langmuir 1986, 2, p. 697. [ Links ]
7. M. Benje, M. Eirmann, U. Pitterma, K. G. Weil. Ber. Bunsen. Ges. Physical Chemistry 1986, 90, p. 435. [ Links ]
8. A. Arnau, J. Ferrero, Y. Jiménez, T. Sogorb. Sistemas electrónicos de comunicaciones II. UPV, Valencia, 2000. Cap. 8-9. [ Links ]
9. C. Lu, A. Czaderna. Applications of the piezoelectric quartz crystal microbalance. Methods and phenomena. Elsevier, New York, 1984, Vol. 7. [ Links ]
10. A. Arnau (ed.). Piezoelectric transducers and applications. Springer, Berlin 2004. Chap 6. [ Links ]
11. G. Sauerbrey. Z. Phys. 1959, 155, 206. [ Links ]
12. D. Skoog, D. West, J. Holler. Fundamentos de química analítica. 4a ed. Reverté. Barcelona, 1997. [ Links ]
13. D. Skoog, J. Leary. Análisis instrumental 4a ed. Mc-Graw-Hill/Interamericana de España. Madrid, 1994. [ Links ]
14. S. Bourkane, C. Gabriell. M. Keddam. Journal of Electroanalytical Chemistry, Volume 256, Issue 2, 9 December 1988, pp. 471-475. [ Links ]
15. C. Gabrielli, J. García-Jareño, M. Keddam, H. Perrot. NATO Advanced Research Workshop on Electrochemistry of Electroactive Polymer Films WEEPF-2000. [ Links ]
16. C. Gabrielli, M. Keddam, N. Nadi, H. Perrot. Electrochimica Acta, Volume 44, Issue 12, January 1999. [ Links ]
17. C. Gabrielli, M. Keddam, H. Perrot, M. C. Pham, R. Torresi. Electrochimica Acta, Volume 44, Issue 24, July 1999. [ Links ]
18. J. J. García-Jareño, A. Sanmatías, F. Vicente, C. Gabrielli, M. Keddam, H. Perrot. Electrochimica Acta, Volume 45, Issue 22-23, July 2000. [ Links ]
19. J. J. García-Jareño, C. Gabrielli, H. Perrot. Electrochemistry Communications, Volume 2, Issue 3, March 2000. [ Links ]
20. J. J. García-Jareño, C. Gabrielli, H. Perrot. U.S. Army Asian Research Office (ARO-FE). 2001 Joint International Meeting (200th Meeting). San Francisco, CA. September 2001. [ Links ]
21. C. Gabrielli, J. J. García-Jareño, H. Perrot. Electrochimica Acta, Volume 46, Issues 26-27, August 2001. [ Links ]
22. C. Gabrielli, J. J. García-Jareño, M. Keddam, H. Perrot, F. Vicente. Journal of Physical Chemistry B, Volume 106, Issue 12, March 2002, pp. 3182-3191. [ Links ]
23. C. Gabrielli, J. J. García-Jareño, M. Keddam, H. Perrot, F. Vicente. Journal of Physical Chemistry B, Volume 106, Issue 12, March 2002, pp. 3192-3201. [ Links ]
24. C. Benito, C. Gabrielli, J. J. García-Jareño, M. Keddam, H. Perrot, F. Vicente. Electrochemistry Communications, Volume 4, Issue 8, August 2002. [ Links ]
25. J. J. García-Jareño, D. Jimenez-Romero, M. Keddam, H. Perrot, F. Vicente. Journal of Physical Chemistry B. Volume 107. 2003, pp. 11321-11330. [ Links ]
26. S. Al Sana, C. Gabrielli, H. Perrot. Russian Journal of Electrochemistry, Volume 40, No. 3, 2004 pp. 267-272. [ Links ]
27. S. Al Sana, C. Gabrielli, H. Perrot. Journal of Electrochemical Society, 150 (9) 2003. E444-E449. [ Links ]
28. H.E. Hager, R. D. Ruedisueli, M. E. Buelher. Corrosion Nace 1991, 47, 179. [ Links ]
29. J. M. Beeley, C. Mills, P. A. Hammond, A. Glidle, J. M. Cooper, L. Wang and D. R. S. Cumming. Sensors and actuators B: Chemical, Volume 103, Issues 1-2, 29 September 2004, pp. 31-36. [ Links ]
30. Personal correspondence with Dr. H. Perrot. [ Links ]
31. Y. Jiménez. Disertación Diploma de Estudios Avanzados. UPV. Valencia 2002. [ Links ]
32. A. Arnau, Y. Jiménez, T. Sogorb. Journal of Applied Physics, Volume 88, Number 8, October 2000. [ Links ]
33. A. Arnau (ed.). Piezoelectric transducers and applications. Springer, Berlin 2004. Chap 4. [ Links ]
34. S. Martin, V. Edwards, G. Frye. Analytical Chemistry. 63, 1991, pp. 2272-2281. [ Links ]
35. A. Arnau (ed.). Piezoelectric transducers and applications. Springer, Berlin 2004. Chap. 16. [ Links ]
36. R. Torres. PETRA II Project Second Meeting. Natal, Brazil. November 2005. [ Links ]
37. V. Edwards, S. Martin. J. Appl. Phys. Vol. 75, No. 3, 1. February 1994. [ Links ]
