


Services on Demand
Journal
Article
 English (pdf)
 Article in xml format
 Article references
 Send this article by e-mail
Indicators
-
 Cited by SciELO
 -
 Access statistics
Related links
-
 Cited by Google
 -
 Similars in
SciELO
Similars in
SciELO -
 Similars in Google
Share

 Permalink
Revista EIA
Print version ISSN 1794-1237On-line version ISSN 2463-0950
Rev.EIA.Esc.Ing.Antioq no.7 Envigado Jan./June 2007
ELECTRONIC SYSTEM FOR EXPERIMENTATION IN AC ELECTROGRAVIMETRY II: IMPLEMENTED DESIGN
Robinson Torres1, Antonio Arnau2, Hubert Perrot3, José Edinson Aedo4
1 Ingeniero Electrónico, Universidad de Antioquia. Profesor Investigador, Grupo Gibec, Ingeniería Biomédica, Escuela de Ingeniería de Antioquia e Instituto de Ciencias de la Salud. Estudiante de Maestría en Ingeniería, Universidad de Antioquia, Grupo Microe. pfrotor@eia.edu.co
2 Ingeniero Electrónico y Doctor en Ingeniería Electrónica. Departamento Ingeniería Electrónica, Universidad Politécnica de Valencia. aarnau@eln.upv.es
3 Ingénieur Chimist, École Supérieure de Chimie Industrielle de Lyon. Docteur, École Centrale de Lyon. UPR 15 du CNRS, Physique des Liquides et Électrochimie, Université Pierre et Marie Curie, Paris. LISE (Laboratoire Interfaces et Systèmes Electrochimiques), Université P. et M. Curie. perrot@ccr.jussieu.fr
4 MSc. PhD. Universidade de São Paulo, Brasil. Departamento de Ingeniería Electrónica. Director Grupo de Microelectrónica y Control Microe, Universidad de Antioquia. joseaedo@udea.edu.co
Artículo recibido 12-III-2007. Aprobado 20-V-2007
Discusión abierta hasta diciembre de 2007
ABSTRACT
A detailed description of the electronic system designed to improve the measurements in an experimental AC electrogravimetry setup is presented. This system is committed to acquire appropriated data for determining the Electrogravimetric Transfer Function (EGTF) and provide information regarding the mass transfer in an electrochemical cell in the AC Electrogravimetry Technique, but maintaining a good trade-off between the locking frequency bandwidth and the resolution in the frequency tracking, that is, enlarging the bandwidth of the system to follow signals with frequency as higher as 1 kHz, but maintaining an accurate and continuous tracking of this signal. The enlarged bandwidth allows the study of fast kinetic process in electrochemical applications and the continuous tracking let to achieve a precise measurement with good resolution rather than average frequency records obtained by conventional frequency meters. The system is based on an Analogue-Digital Phase Locked Loop (A-D PLL).
KEY WORDS: AC electrogravimetry; quartz crystal microbalance; phase locked loops; bandwidth-resolution trade-off; coarse and fine tuning.
RESUMEN
En este artículo se presenta una descripción detallada del sistema electrónico diseñado para mejorar las medidas en un sistema experimental de electrogravimetría AC. El sistema diseñado se encarga de adquirir los datos adecuados para determinar la función de transferencia electrogravimétrica (EGTF) y proveer información relacionada con la transferencia de masa en una celda electroquímica en la técnica de electrogravimetría AC, pero manteniendo un buen compromiso entre el ancho de banda de enganche y la resolución en el seguimiento de la frecuencia, es decir, el sistema incrementa el ancho de banda para permitir el seguimiento de señales con frecuencias hasta de 1 kHz, pero conservando un exacto y continuo seguimiento de esta señal. El aumento del ancho de banda permite el estudio de procesos con una cinética rápida en aplicaciones electroquímicas y el seguimiento continuo de la señal permite la obtención de medidas precisas con buena resolución en contraste con los datos de frecuencia promediados entregados por los frecuencímetros convencionales. El sistema se basa en un bucle de enganche de fase analógico-digital (A-D PLL).
PALABRAS CLAVE: electrogravimetría AC; microbalanza de cristal de cuarzo; bucles de enganche de fase; compromiso ancho de banda-resolución; ajuste grueso y fino.
I. INTRODUCTION
As it was presented in a previous paper [1], the existing experimental set-ups in AC electrogra-vimetry used for polymer characterisation undergo problems both for obtaining an appropriate resolution in the frequency-voltage conversion and for a proper continuous frequency tracking. Therefore, these problems are transferred as a distortion in the ratio of the AC mass change (coming from the AC frequency change measured) to the voltage change, i.e., the Electrogravimetry Transfer Function (EGTF), Am/AE, obtained by the system [2, 3].
In order to solve these inconveniences it is necessary that the electronic system establishes an optimum trade-off between both resolution and bandwidth, in addition to a continuous and accurate frequency tracking. It means the system is required to measure a mega hertz frequency signal, the central frequency of the QCM controlled oscillator, modulated in frequency by a small amplitude sine wave signal with a speed as fast as 1 kHz; such a measure implies to lock the RF signal and then to perform an accurate tracking with good resolution of the modulating signal. This is not a simple task because the locking of the RF signal requires a large gate time which can increase the resolution, but limits the bandwidth for faster modulating signals; on the other hand, a shortening in the time gate increases the bandwidth, but reduces the resolution as it was explained in [1]. Then the electronic system must establish this trade-off between resolution and bandwidth to measure the frequency changes induced by the modulating signal, but taking into account the high frequency range of the carrier signal.
The electronic system designed is an Analogue-Digital Phase Locked Loop (A-D PLL), because it mixes analogue and digital subsystems under a PLL schema. The A-D PLL tries to improve the system´s performance in two ways: first, by obtaining a good resolution, this is a good frequency-voltage conversion, and second, by broadening the locking frequency bandwidth to follow the fast frequency changes in the modulating signal (until 1 kHz). Moreover, an improvement of the accuracy of these measurements is obtained.
In the following sections a complete description of the system is presented along with some results found under controlled experiments. They were developed at the Laboratory of Electrochemical Systems and Interfaces (LISE) of the University Pierre and Marie Curie in Paris.
II. BLOCK DIAGRAM OF THE SYSTEM
The block diagram of the Analogue-Digital Phase Locked Loop system proposed is shown in Figure 1. Two different parts are distinguished: a main loop which is essentially an analogue subsystem and a secondary loop which is built by digital and programmable circuits.
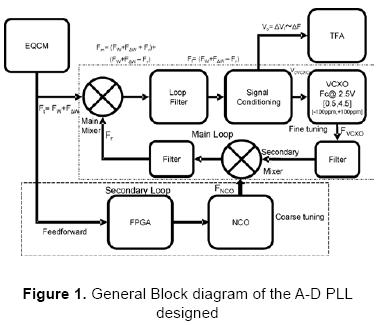
The main loop is composed by an Electrochemical Quartz Crystal Microbalance, EQCM, i.e., an electrochemical cell in which the QCM is inserted; a mixer (main mixer in Figure 1) working as a phase detector, a low pass filter followed by a signal conditioning circuit and a voltage controlled crystal oscillator (VCXO). The output of the VCXO is connected again to the phase detector through a feedback path formed by two filters and an additional mixer which acts as the interface with the secondary loop. The secondary loop makes a digitally controlled feed-forward correction based on a numerically controlled oscillator (NCO), which is managed by a purposed algorithm implemented in a Field Programmable Gate Array (FPGA).
III. A-D PLL: COMPLETE DESCRIPTION
Main mixer
The main mixer performs the analogue mixing between the signal coming from the oscillator that contains the EQCM and the signal coming from the PLL feedback path. After the analogue mixing of the signals, two components are obtained: a "high" frequency component and a "low" frequency one.
Figure 1 shows that the signal coming from the EQCM (Ft) can be considered as a frequency modulated signal whose carrier is the high frequency signal of the oscillator (Fw) and the modulating signal is the AC electrogravimetric voltage applied on the EQCM which produces corresponding frequency shifts in the oscillator frequency (ΔFw) [1], given by:
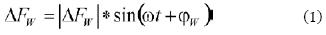
where  is the peak in the frequency shift; ω=2πf is the angular frequency of the modulating signal and φw is the phase shift.
The second input signal to the main mixer, whose frequency is Fr, is the signal coming from the VCXO, but modified by the elements of the secondary loops as shown in Eq. (2).
As a result of the mixing the output of the mixer provides the following signal:
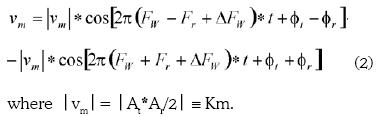
At and Ar are the amplitudes of the signals coming from the EQCM controlled oscillator and from the feedback path, respectively.
By initial signal amplitude level conditioning it is possible to set Km= 0.5 and because only the "low" frequency component is required, a low pass filter can be applied obtaining:
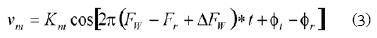
It can be noticed from Eq. (3) that, for two similar frequency and phase signals at the input of the main mixer, the low frequency component of the signal at the output of the mixer is only dependent on the carrier frequency shifts which are directly related to the amplitude of the modulating signal, i.e., the AC electrogravimetric signal. When the phase shift between the signals at the main mixer inputs is small around π/2, the following linear relationship can be established [4-6]:
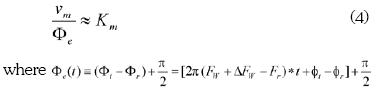
is the absolute phase error.
According to Eq. (4) the transfer function of the main mixer acting as a phase detector is Km.
Low pass integrator filter
The transfer function of the low pass integrator filter located at the output of the main mixer is given by [4, 5]:
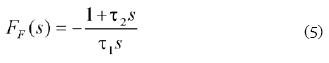
where τ1 and τ2 are parameters to be adjusted for a specific design.
Figure 2 shows the frequency response of the low pass integrator filter according to Eq. (5). Indeed, this figure is an approximation of the frequency response and is only shown for explanation purposes.
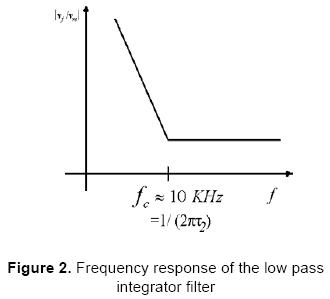
From Figure 2, it can be noticed that frequency signals beyond 10 kHz will be considerably attenuated whereas low frequency signals will be amplified; this frequency value is imposed by the parameter τ2. Then the high frequency component in Eq. (2) is highly attenuated whereas the low frequency component is kept according to Eq. (3). This signal which is related to the AC electrogravimetry voltage applied on the EQCM cell will be applied to the input of the VCXO after appropriate conditioning explained below. As it will be shown next, the parameters τ1 and τ2 determine the natural oscillating frequency and the damping factor of the PLL, and their influence in the filter behaviour and the PLL performance are widely discuss elsewhere [4, 5].
Signal conditioning subsystem
The filtered signal goes through a conditioning circuit which is composed by two elements. The first one, built by means of an active low pass filter [7, 8], is used to provide a signal with an adequate amplitude level to be processed by the Transfer Function Analyser, TFA, in order to obtain the Elec-trogravimetry Transfer Function, EGTF. The second element in the signal conditioning block establishes the desired frequency range around the central frequency of the VCXO, which is 16 384 000 Hz for an input voltage of 2.5 V This second element includes a voltage divider which introduces a constant Ka that needs to be considered for the calculation of the total system gain.
Voltage Controlled Crystal Oscillator, VCXO
A VCXO is used to select a small frequency lock range about ±75 ppm around its central frequency for an input voltage excursion of ±1.5 V around 2.5 V. The frequency-voltage gain conversion of the VCXO used was Kv = 0.8192 Hz/mV.
The high frequency-voltage gain conversion of the VCXO and its good linearity make easy to establish an accurate relationship between the EQCM frequency shifts and voltages shifts at the input of the VCXO as follows:

where ΔVcVCXO is the control voltage in mV relative to 2.5 V at the VCXO input.
In principle only the frequency shift monitoring is interesting; however, the absolute frequency of the EQCM can be obtained by the following expression:
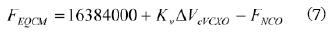
where FNCO is the frequency of the Numerically Controlled Oscillator as it will be shown below.
With this information and according to the behaviour of voltage controlled oscillators [4-6] the transfer function for the VCXO is given by:
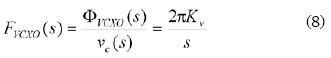
where ΦVCXO is the relative phase at the VCXO output.
The VCXO output is band pass filtered by a fifth order elliptic filter [9] with a pass bandwidth of 14-18 MHz, which is designed to extract the fundamental frequency of the VCXO signal.
Secondary mixer and numerically controlled oscillator (NCO)
Because of the extremely narrow frequency range of the VCXO, a coarse frequency tuning is necessary in order to centre the operative frequency range of the PLL around the centre frequency of the EQCM. This coarse tuning is performed by means of a numerically controlled oscillator, NCO, and a mixer, once a rough frequency measurement of the EQCM output signal is made. This so-called feed-forward correction is performed by selecting the frequency of the NCO in such a way that the up-conversion of the EQCM frequency and the frequency of the NCO (FNCO) falls in the frequency range covered by the VCXO; it is to say, (FEQCM + FNCO) ∈ (16384000 ± KvΔVcVCXOmax). For this objective a bandpass filter selecting the low frequency bandwidth component [5-12 MHz] of the signal at the output of the mixer is included in the feedback path.
With this double frequency adjustment an optimum behaviour of the system is achieved. On the one hand, a good resolution is obtained thanks to the narrow frequency range of the VCXO, and on the other hand, an extension of the dynamic range is guaranteed by the feed-forward correction; for this, a rough frequency measurement of the EQCM frequency is performed by means of a Field Programmable Gate Array, FPGA, which is also used to implement the complete control of the system.
Field programmable gate array, FPGA
An algorithm implemented in the FPGA performs the control of the system and the rough measurement of the central frequency of the signal coming from the EQCM, i.e., the output signal of the reference oscillator whose frequency is modulated by the mass variations in the EQCM. With this schema a very fast and accurate monitoring of the frequency shifts can be achieved in a broad frequency bandwidth. A summarised flow diagram of the algorithm programmed in the FPGA is shown in Figure 3.
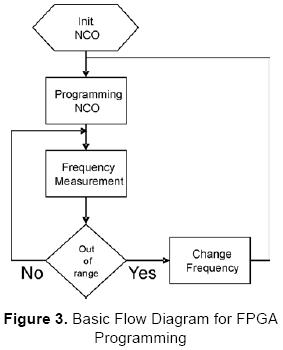
In order to follow the instructions given by the flow diagram it is essential to design the hardware architecture according to the resources available in the FPGA selected; this architecture is shown in Figure 4. Once the architecture setup was achieved, the algorithm was modelled in VHDL for its subsequent implementation into the FPGA [10].
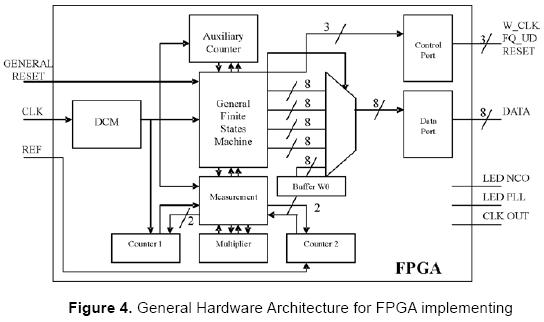
The system in Figure 4 includes three inputs: GENERAL RESET, which is connected to an external push button in the FPGA system development board; clock input (CLK), which is connected to the main clock of 50 MHz in the same board; and the reffer-ence input (REF), which is the input for the signal coming from the electrochemical cell which has been firstly pre-conditioned into a square-wave signal to be processed by the FPGA.
Besides, the system has seven outputs: W_CLK, FQ_UD and RESET for programming the NCO; LED NCO indicates the programming state of the NCO; LED PLL indicates if the PLL is locked and CLK OUT is the mapping for the main clock inside the FPGA. This clock signal is conditioned by a digital clock manager, DCM.
A finite state machine, FSM, is the main part of the FPGA architecture and is involved in distributing the tasks according to Figures 3 and 4. Furthermore, the FSM controls the programming of the NCO by using the additional elements in the diagram like the measurement block, counter 1 and counter 2. Auxiliary counter is used to control the steps in the FSM.
Complete system operation
When all the previous subsystems are interconnected, the complete system obtained can be modelled by a transfer function, according to the classical PLL theory [5, 6]. It is important to notice that, although this characterisation is just an approximation for the system´s behaviour in real experimental conditions, the experimental results, which will be shown later on, will validate the theoretical analysis next introduced.
In general the transfer function of a PLL is given by:
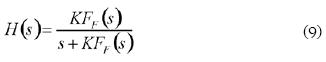
where K = 2πKmKvKa and FF(s) is the transfer funtion of the loop filter given by Eq. (5).
Replacing these equations and setting Km= 0.5, by appropriated conditioning of the amplitude of the signals at the input of the main mixer, the next expression is obtained:
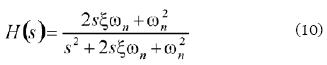
where  is the natural oscillating frequency for PLL and
  is the damping factor.
As it can be noticed both natural frequency and damping factor depend strongly on the loop filter´s characteristics which must be appropriately designed for a good static and dynamic performance of the PLL.
The general behaviour of the system is as follows: at power on, the NCO is programmed with an initial frequency selected from the range 6 to 10 MHz and the system waits for the reference signal coming from the EQCM to the main mixer input; then, the algorithm programmed into the FPGA compares the previous frequency programmed with the new one measured and makes the corresponding adjustment to the NCO´s frequency; this constitutes the coarse tuning. After the coarse tuning, the small sine wave frequency changes introduced by AC electrogra-vimetry can be followed by the VCXO, i.e., the fine tuning of the system. In this way the procedure warrants that the system is locked and the measurement process is accurate.
If at any moment the central frequency of the EQCM abruptly changes, the system responds in an effective way, due to the correction made by the NCO.
IV. EXPERIMENTAL RESULTS
Experimental validation of the system was performed in three stages: first, a preliminary characterisation was performed in order to measure the system´s frequency and phase response and its operating frequency range; second, a comparison between the current system AC electrogravimetry experimental setup [1] (named "old" from now on) and the system proposed (named "new") in terms of system performance was made; and finally, some experimental analysis with some polymers used at LISE were carried out.
System characterisation
Some preliminary characterisation related to the proposed system was introduced elsewhere [11]. For this preliminary characterisation a frequency modulated signal was recreated using an auxiliary sine wave generator (Agilent 33120A). The modulating frequency was changed in the range from 1 mHz to 1 kHz. The peak of the frequency shift was established in 50 Hz.
In a preliminary stage the system was designed with (ωn=20πK rad/s, ξ=0.707. These values provide the following time constants in Eq.(5): τ1 = 6.8 x 10⁻⁶ s and τ2 = 12 x 10-5 s.
After these results a more detailed dynamic characterisation was conducted in order to establish a comparison between the system proposed and the old system for evaluating the EGTF.
Dynamic characterisation
The dynamic characterisation is just the frequency response for the system which is calculated in conjunction by a frequency and transfer function analyser (Solartron 1254) and a computer. A comparison between the old and the new systems was performed. For simulating the electrochemical cell with the EQCM a synthesiser was used. Figure 5 depicts a block diagram for the characterisation setup of the old system in frequency response. For the new system characterisation the auxiliary synthesiser is absent.
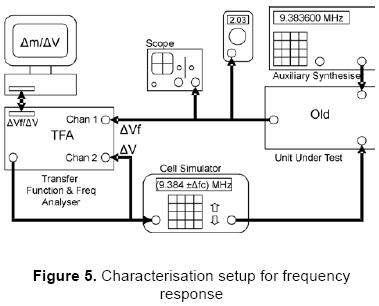
The configuration established for this system is as follows:
- Auxiliary synthesiser: RF generator HP33325B with Faux= Fc-400 Hz. This synthesiser is only present for the old system,
- Cell Simulator: RF programmable generator Marconi with Fc±ΔFc, with three carrier frequencies (6 MHz, 9 MHz and 9.384 MHz).
- ±ΔFc is provided by the generator present in the Transfer Function Analyser, TFA, Solartron 1254. It is a sine wave of 100 mV rms and variable frequency between 63 kHz and 1 mHz.
- Digital True RMS Fluke meter.
As it can be noticed in Figure 6 the new system enhances the frequency response for the AC elec-trogravimetry system regarding the old one; in the magnitude response of the old system the response does not go beyond 10 Hz without distortion whereas the new systems goes until 1 kHz approximately as it was anticipated by the results of the preliminary results [11]. In addition, the phase response of the old system presents an oscillation beyond 10 Hz; so that when a polymer with a "fast" response is analysed, as it will be shown later on, the old system will distort the polymer response. For the new system the phase response is approximately constant and small until 1 kHz.
Regarding the Nyquist response, as it was introduced in the previous paper [1], the dynamic characterisation for both the old and new systems give the response shown in Figure 7. The open circles represent the complex response (magnitude and phase shift of the demodulated signal) at different modulating frequencies. Each open circle corresponds to a specific modulating frequency. The response of an ideal system would maintain a constant amplitude and null phase shift and then the plot would degenerate in a dot on the real axis for all the modulating frequencies. Some modulating frequencies have been represented with solid circles in the figures. As it can be noticed when the modulating frequency increases, the distortion can be appreciated in the Nyquist diagram as a separation from the real axis and a decrease of the amplitude in the response. For the old system it can be noticed that a significant distortion can be found for 1 Hz modulating signal while it is necessary to increase the frequency of the modulating signal until 1 kHz for obtaining the same distortion with the proposed system.
Finally, some results using the whole AC electrogravimetry experimental setup will be shown. Once again a comparison between the current (old) and the proposed (new) systems will be made.
Experimental results for a specific polymer
In this experimental analysis three polymers (only results for polyaniline are presented) were taken and subjected to a redox process during several minutes in the AC electrogravimetry experimental setup shown in Figure 8. Again, for the new system designed the auxiliary synthesiser is absent.
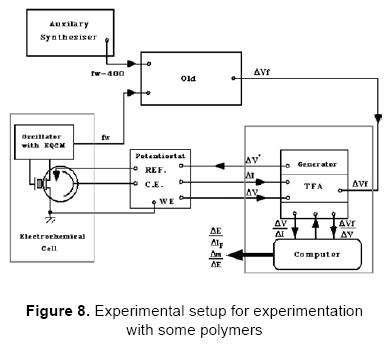
It can be noticed that this system fits with the system presented in Figure 9 in [1].
The configuration of the system was as follows:
- Carrier frequency ≈ 9 MHz
- Deviation voltage (at TFA file setup): 20 mV rms
- Modulator frequency sweep: (1 mHz- 63 kHz)
- Polymer used: Polyaniline deposited
- Electrolyte used: HClO4 1 M
- Potentiostat voltage reference: +0.200 V
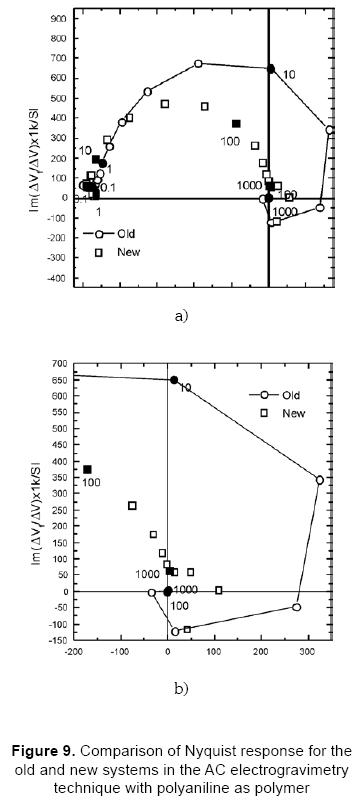
The results are compared in the Nyquist diagrams in Figure 9 where panel a) corresponds to the comparison for both systems and b) shows a detailed picture for the "high" frequency section of the panel a).
The previous characterisation analysis performed with the old and new systems in this section IV can be now used to justify that the response obtained for the polymer polyaniline with proposed system is mainly due to the real response of the polymer and not due to a distortion of the instrumentation, as it is the case of the old system. As it can be noticed the old system introduces a complete distortion of the loop which crosses the imaginary axis for AC electrogravimetry frequencies as low as 10 Hz, while the new system has an asymptotical approaching to the imaginary axis.
V. CONCLUSIONS
This paper in conjunction with the previous one mentioned undertakes the problem of appropriate monitoring of very small and high rate frequency changes, as those appearing in AC electrogravimetry systems. Very high resolution in the monitoring of very small frequency shifts (in the order of tens of cycles around 10 MHz) at high rates (until 1kHz) in a broad range of carrier frequencies (from 6 MhZ to 12MHz) is necessary in this kind of application.
A proposed system based on an A-D PLL has been validated as a good solution for these purposes. The system has been characterised and compared with the current system and an important improving in the system response has been experimentally proved. The proposed system has been also proved in real experimental conditions and its good performance for characterising the polymer behaviour at relative high frequencies has been made clear. Thus, the system is a useful tool for the AC electrogra-vimetry technique that warrants that the responses obtained during experimentation are only due to the polymer behaviour under study, without any intervention of the electronic instrumentation. Therefore, it is avoided the necessity to do any correction in the responses by means of algorithms and software, then the experimentation process is speeded up and errors are minimised.
ACKNOWLEDGEMENTS
This work is developed thanks to PETRA II project in the frame of European Alfa project to establish cooperation networks between European Union and Latin American countries for technology and knowledge transfer. In addition the authors are very grateful with the Universidad Politécnica de Valencia, the UPR 15 du CNRS, Laboratoire Interfaces et Systèmes Électrochimiques, Université Pierre et Marie Curie, and the Biomedical Engineering program in agreement between Escuela de Ingeniería de Antio-quia and Instituto de Ciencias de la Salud. Finally, the authors desire to thank to Microelectrónica y Control (Microe) group of Universidad de Antioquia.
REFERENCES
1. R. Torres, A. Arnau and H. Perrot. Electronic system for experimentation in AC electrogravimetry I: technique fundamentals. Revista EIA, Volumen 5, p. 9-21, junio 2006. [ Links ]
2. C. Gabrielli, M. Keddam, H. Perrot, M. C. Pham and R. Torresi. Separation of ionic and solvent transport during charge compensation processes in electroac-tive polymers by a.c. electrogravimetry. Electrochimica Acta, Volume 44, Issue 24, p. 4217-4225, July 1999. [ Links ]
3. C. Gabrielli, J. J. Garcia-Jareño and H. Perrot. Charge compensation process in polypyrrole studied by ac electrogravimetry. Electrochimica Acta, Volume 46, Issues 26-27, p. 4095-4103, August 2001. [ Links ]
4. A. Arnau, J. Ferrero, Y. Jiménez y T. Sogorb. Sistemas electrónicos de comunicaciones II. Ed. UPV. Valencia, 2000. Cap. 8-9. [ Links ]
5. R. Best. Phase-locked loops: theory, design, and applications. McGraw-Hill. New York 2005. [ Links ]
6. D. Wolaver, E. Cliffs. Phase-locked loop circuit design. Prentice-Hall. New Jersey 1991. [ Links ]
7. A. Pertence. Amplificadores operacionales y filtros activos: Teoría, proyectos y aplicaciones prácticas. McGraw-Hill. Madrid 1994. [ Links ]
8. R. Coughlin, F. Driscoll, Amplificadores operacionales y circuitos integrados lineales. Prentice-Hall. México 1993. [ Links ]
9. A. Williams and F. Taylor. Electronic filter design handbook. 3rd ed. McGraw-Hill. New York 1995. [ Links ]
10. L. Terés, Y. Torroja, S. Olcoz y E. Villar. VHDL, lenguaje estándar de diseño electrónico. McGraw-Hill. Madrid 1997. [ Links ]
11. R. Torres, A. Arnau, H. Perrot, J. García and C. Gabrielli. Analogue-digital phase locked loop for alternating current quartz electrogravimetry. Electronics Letters. UK October 2006. [ Links ]

