


Serviços Personalizados
Journal
Artigo
 texto em
  Inglês (pdf)
 Artigo em XML
 Referências do artigo
 Enviar este artigo por email
Indicadores
-
 Citado por SciELO
 -
 Acessos
Links relacionados
-
 Citado por Google
 -
 Similares em
SciELO
Similares em
SciELO -
 Similares em Google
Compartilhar

 Permalink
Revista EIA
versão impressa ISSN 1794-1237
Rev.EIA.Esc.Ing.Antioq no.26 Envigado jul./dez. 2016
WILLINGNESS TO PAY FOR A HIGH-SPEED PASSENGER RAIL SERVICE BETWEEN BARRANQUILLA AND CARTAGENA
DISPOSICIÓN A PAGAR POR EL SERVICIO DE UN TREN RÁPIDO ENTRE BARRANQUILLA Y CARTAGENA
DISPOSIÇÃO A PAGAR POR UM SERVIÇO FERROVIÁRIO DE ALTA VELOCIDADE PARA PASSAGEIROS ENTRE BARRANQUILLA E CARTAGENA
Luis Gabriel Márquez Díaz1
1 Transportation and Highways Engineering. MSc. in Transportation Engineering. Associate professor at Universidad Pedagógica y Tecnológica de Colombia. Avenida Central del Norte 39-115 Sede Central Tunja-Boyacá-Colombia / Tel.: (57+8) 7405626. Correo electrónico: lgmarquezd@gmail.com.
Paper received: 07-V-2016/ Approved: 20-XI-2016
Available online: February 30, 2017
Open discussion until April 2018
ABSTRACT
This paper shows the factors influencing the willingness to pay (WTP) for a new high-speed passenger rail service between Barranquilla and Cartagena. We used the contingent valuation as an instrument for data collection and we conducted a sequential experimental design in order to identify factors that have significant effect on DAP, which average value was $29,000 Colombian pesos. We calibrated a first order regression model to explain the DAP based on the variables: headway, travel time and Wi-Fi availability and electrical outlets. The optimization process greatly enhanced the DAP to a cost of $39,000 Colombian pesos, which is considered very low compared with international benchmarks for these services, concluding that it calls into question the viability of the proposed system.
KEY WORDS: Willingness to pay; High-speed passenger rail service; ANOVA; Multiple Linear Regression.
RESUMEN
El presente trabajo estudia los factores que influyen en la disposición a pagar (DAP) por un nuevo servicio de tren rápido de pasajeros entre Barranquilla y Cartagena. Como instrumento de toma de datos se utilizó la técnica de valoración contingente y mediante una estrategia de experimentación secuencial fueron identificados los factores con efecto significativo sobre la DAP, cuyo valor medio fue de $29.000. Se calibró un modelo de regresión de primer orden que explica la DAP en función de las variables intervalo del servicio, tiempo de viaje y acceso a red Wi-Fi y tomas eléctricas. El proceso de optimización para la variable de respuesta permitió aumentar su valor hasta $39.000, que se considera muy bajo si se compara con los referentes internacionales para este tipo de servicios, llegando a la conclusión que queda en entredicho la viabilidad del sistema propuesto.
PALABRAS CLAVE: Disposición a pagar; tren de alta velocidad; análisis de varianza; regresión lineal múltiple.
RESUMO
Este artigo mostra os fatores que influenciam na disposição a pagar (DAP) para um novo serviço ferroviário de alta velocidade para passageiros entre Barranquilla e Cartagena. Foi utilizada a avaliação contingente como instrumento de coleta de dados e mediante uma estratégia de experimentação sequencial, foram identificados os factores com efeito significativo sobre a DAP, cujo valor médio foi de $ 29,000 pesos colombianos. Fio calibrado um modelo de regreção de primeira ordem que explica a DAP em função das variáveis de intervalo do serviço, tempo de viagem e acesso a Wi-Fi e tomadas elétricas. O processo de otimização para a variável de resposta permitiu aumentar seu valor até 39,000 pesos colombianos, o que é considerado muito baixo em comparação com os referentes internacionais para esses serviços, chegando à conclusão da viabilidade do sistema proposto.
PALAVRAS-CHAVE: Disposição a pagar; Serviço ferroviário de alta velocidade para passageiros; Análises de varianza; Regreção Linear Múltipla.
1. RATIONALE
An experiment can be understood as a series of tests where controlled changes are present by the input variables of a process or system to identify the reasons for any changes that may be observed in the output variable (Montgomery, 2013). Although the majority of the applications of design and analysis of experiments is located in the industrial sector (Eriksson et al., 2008) it is clear that its scope includes analysing countless phenomena, such as automotive fuel, wholesale price of chemicals, or corn yield per acre (Goupy y Creighton, 2007).
In the scope of transportation engineering, design and analysis of experiments have been used in different contexts. For example to analyse the impact of using intelligent transport systems in distribution networks of goods by road (Polo-Navarro et al., 2014), to study the reliability and safety of maritime transport systems (Xie et al., 2012), or to explore concepts of capacity, efficiency and flexibility of air transport systems (Wilson, 2011).
In recent years, policymakers in Europe and the United States have considered high-speed railway infrastructure development as a possible strategy to reduce the climate impacts of the transportation sector (Clewlow et al., 2014). High-speed rail growth has led to major changes in the supply of interurban transportation in those countries that have extended their networks and services (Albalate et al., 2015). Railway infrastructure has also experienced a prosperous growth in China due to a large amount of government investment that allowed for the benefiting the Chinese society and economy, given the improved rail transport efficiency and regional accessibility (Chen et al., 2016).
It is clear that transport affects the environment in numerous ways. The reduction of environmental externalities is a potential benefit of high-speed railway investment, although this depends on the volume of demand deviated from less environmentally-friendly transport modes and whether demand is high enough to compensate for the negative externalities during construction, the barrier effect, noise and visual intrusion (de Rus and Kågeson, 2012). In the Colombian case, it has been demonstrated the relevance of including external costs in the strategic modelling of interregional freight transport networks as part of a policy that supports mechanisms for managing and pricing to achieve the social optimum (Márquez and Cantillo, 2013).
Planning for intercity passenger rail service encompasses a broad range of activities from adjusting service configurations (e.g. frequencies and on-board services) to the establishment of new routes where no service currently exists (Sperry and Morgan, 2010). In this vein, this paper discusses the planning and conduct of an experiment to analyse the factors that influence the willingness to pay (WTP) for a new high-speed passenger train service between Barranquilla and Cartagena. As this is a service that is still not available to potential users, a contingent valuation technique as a tool for experimentation is used, which by definition pretends to simulate a market through surveying potential users (Riera, 1994), in order to know what the WTP of users for this new service would be.
After the rationale the structure of this paper is as follows. Firstly, the screening experiment that identifies the factors that have significant effect on WTP is shown. Secondly, the final factorial experiment and the fitting of the regression model are presented. In all three cases the adequacy of the proposed models is verified. Later, the analysis of the results is done and it leads to the optimization design of the transport system. Finally, the main conclusions of the paper are reported.
2. SCREENING EXPERIMENT 24
In general, the design 2k in the initial stages of the experimental work is used, since it provides the least number of runs of the k factors that can be studied in a full factorial design (Montgomery, 2013). In this case, the work presented is located in the context of analysis of conveyor systems, particularly in the design of systems based on public passenger transport. Geographically, the study is part of the provision of transport services between Barranquilla - Cartagena, considering the existence (hypothetically speaking) of a high-speed train service between the two cities.
2.1 Design
As this is a new transport service, it is considered that its analysis can be done through experimentation. Initially, the objectives to be achieved are related to the possibility of identifying the most relevant factors that influence the WTP of potential users of the high-speed train service. Normally, the WTP for transport services is associated with factors such as travel time, the train headway and the service level (Jaimes y Márquez, 2009), but recently the effect of reliability (Zheng et al., 2010;. Xie et al., 2012) and the effect of accident risk have also been studied (Rheinberger y Bründl, 2008), among other factors.
Recently, some studies have addressed the influence of the Wi-Fi services and electrical connections on the decision of users to travel by train, finding that there is a positive influence, that could even lead to a 36% increase of the declared demand on existing services (Mokhtarian et al., 2013, Ettema et al., 2012), and it generates a greater willingness to pay for new services (Maccagni, 2012).
The experiment considered four factors: three quantitative and one qualitative, as it is shown in Table 1. Compared with bus mode, which travel time is 200 min, the high-speed train saves considerable time, as seen in the proposed range that varies between 60 and 90 min. In this particular experiment, the effect of accident risk was not considered due to the difficulty of considering qualitative and attitudinal nature of security (Daziano, 2012).
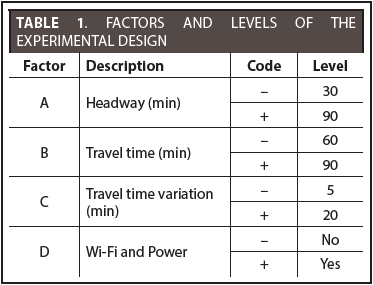
According to previous road studies, it is expected that the average train headway is 1 hour (SITR Mobility Consortium, 2014) and, for this reason, it was decided to experiment with levels of 30 and 90 min. Since the estimated path length is 135 km, assuming an average speed of 110 km/h would be expected to have a travel time of 75 min, so it is considered reasonable to use values of 60 and 90 min for this factor.
The reliability of travel time for rail services is usually high, so a big travel time variation is not expected. A variation of 15% over the average travel time is reasonable (Li et al., 2010) and, for that reason, values of 5 and 20 minutes for experimental purposes are proposed.
The response variable of the experiment, in thousands of Colombian pesos, is the WTP for the new shuttle. Theoretically, the relationship between the WTP and the factors A, B and C suggests a negative effect, i.e., a longer train headway or a longer trip, the lower the user's WTP. The same behaviour should exhibit the fluctuation travel time (reciprocal of reliability) and, as fluctuation increases it is expected to diminish the WTP, given the loss of reliability. In contrast, in the case of Wi-Fi and electrical outlets a positive effect is expected, since having the service (high factor level) would imply an increase in the user's WTP.
It is important to highlight that all chosen factors are part of the design factors of the transport system under study, so the results of the experiment would be very useful in the design phase. Depending on the chosen technology and infrastructure conditions lower or higher travel times can be achieved. Given a fixed level of demand, the desired interval between departures might determine the capacity of wagons. Depending on the control systems that will be implemented, it would be possible to keep the fluctuation of travel time on certain levels. Likewise, if the availability of Wi-Fi and electrical outlets have a significant effect on WTP, it could be assessed whether or not to offer this service.
Since this is an experiment of selection factors conducting 3 replicates, a total of 4 observations per experimental condition are proposed, i.e., a total of 64 data, which is considered an adequate sample for this first part of the analysis. The experiment was randomized by random number generation and, before performing, the polling was constructed on how to make observations. Basically, the experiment consisted of presenting to each respondent a fact sheet (Figure 1) of an experimental condition associated with the characteristics of a new and hypothetical high-speed rail service between Barranquilla and Cartagena. The output variable corresponds to the declared user's WTP to the experimental condition that was presented.

Being Barranquilla the main city of the proposed route, the experiment only observed individuals located in this main city because the high-speed rail service tends to operate as express service, only linking the main stations in the cities they link, not stopping at any other stations. Therefore, as travel is expected to be round trip, it was considered sufficient to observe only one city.
2.2 Implementation and analysis of the experiment
The screening experiment was conducted on May 9, 2014, at the Transportation Bus Terminal, in Barranquilla, using a pollster. Some users of the public transport service (road passengers) between Barranquilla - Cartagena were systematically selected. Before proceeding with the analysis, it is necessary to state that the technique used for the experiment may result in bias, usually called strategic, which is related to the difficulty users may find revealing the true WTP (Riera, 1994), which has led some critics to the method, especially when it comes to non-tradable goods in the market. Notwithstanding the above, as in the case studied, users are actually paying a fee for accessing the current service and the submitted record does not contain suggested prices, the presence of the bias is expected to be acceptably controlled.
The response variable was at a range between 15 and 42 thousand of Colombian pesos, with an average of 27,23 and standard deviation equal to 5,5. This range of values is considered reasonable because the bus fare is 17,5 thousand of Colombian pesos for the same route. The analysis of variance of the WTP (Table 2) indicates that the fluctuation of travel time (associated with the concept of reliability) had no significant effect, unlike other factors (range, travel time and fluctuation) that were truly significant. The results of the variance analysis allow reasonably assuming that the interactions of second, third and fourth order are negligible. This evidence opens the possibility to use fractional factorial designs of two levels.
There is no suspicion of assumptions violation. The normal probability plot of residuals and the basic statistics of the distribution of errors (skewness and kurtosis) indicate that residues come from a Normal distribution.
The autocorrelation analysis of residues indicates that the assumption of independence is met because errors occur randomly in time. In fact, when calculating the first lag it is found that this is equal to 0,0429, indicating that the residuals are independent. There is not any suspected violation of the homoscedasticity assumption because the graphics of residuals per factor do not exhibit obvious structure. From the screening experiment is concluded that for potential users of the service the following factors are significant: range, travel time and availability of Wi-Fi and electrical outlets during the trip.
3. FINAL FACTORIAL EXPERIMENT
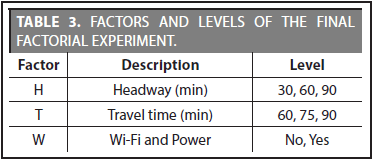
Based on the findings of the previous section, the performance of the final factorial experiment was based on a design 2·23, which involves one qualitative variable with 2 levels and 2 quantitative variables with 3 levels, for a total of 18 experimental conditions. The levels of each of the variables that make the final factorial experiment are presented in Table 3.
3.1 Determination of sample size
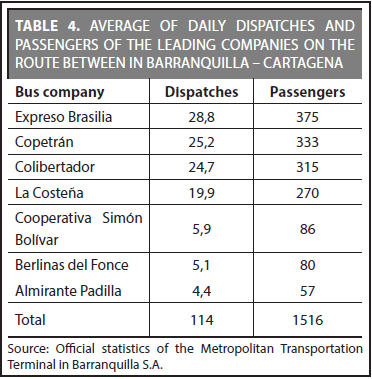
Due to the nature of the experiment, whose observations are made through the application of a contingent valuation survey that allows collecting information for a very low cost, the determination of the sample size does not appear to be a critical issue. In fact, as can be seen in Table 4, the main passenger land transport companies between Barranquilla -Cartagena, mobilize more than 1,500 passengers daily. Therefore, it is possible to take a relatively large sample without additional costs. For the ease and low cost of taking information it was decided to replicate the experiment 10 times, in such a way it was possible to have a total of 180 observations.
3.2 Data and analysis of the final experiment
The final data collection campaign was held during 20 and 21 May, 2014, at the Metropolitan Transportation Terminal in Barranquilla, with the help of a polling company that gave sheets with the experimental conditions to passengers to declare their willingness to pay for the use of the new shuttle.
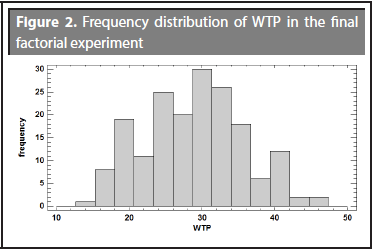
The response variable in the final experiment was located in the range between 15 and 45 thousand of Colombian pesos, with an average of 29,02 thousand pesos and a standard deviation of 6,64. Compared with the data collected in the screening experiment, the results found here seem consistent. In this case, both the standardized skewness value and the standardized kurtosis value are within the range expected for data from a normal distribution. The distribution of the response variable is presented in Figure 2. Due to the way individuals express their WTP, a higher frequency values in multiples of 5 was found, which is usual in this type of rating.
The variance analysis of the experiment was done, finding that the effects of the factors studied were significant. This means that some levels of the analyzed factors produce different values of the WTP response variable. To answer what levels of each of the factors are actually causing this difference some contrast analysis were done using the multiple range test of WTP for each of the factors considered. The tests performed on each pair of each of the design variables indicated that in all cases there are significant differences.
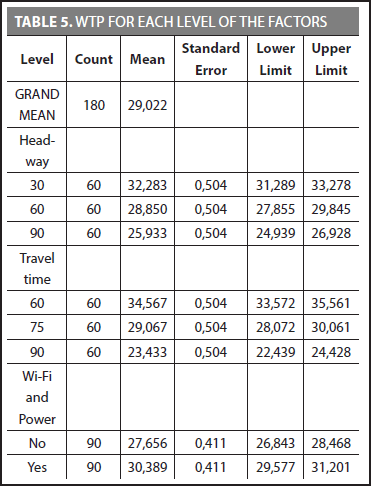
Table 5 shows the mean WTP for each level of the factors. It also shows the standard error of each mean, which is a measure of its sampling variability. The rightmost two columns show 95 % confidence intervals for each of the means. As indicated above, the mean values of the levels of each factor are statistically different among them.
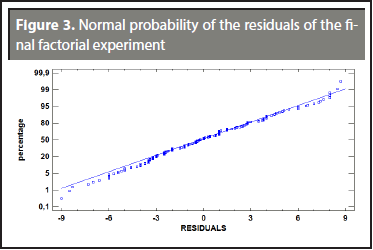
The verification of the normality assumption was graphically explained as it is shown in Figure 3, which tends to bend slightly downward from the left side, it also implies that negative residuals are not so large (in absolute value) as expected. However, this graph does not show a marked deviation from the normal distribution. When checking the distribution of the residuals with the Kolmogorov-Smirnov test it was found that they effectively fit at a normal distribution.
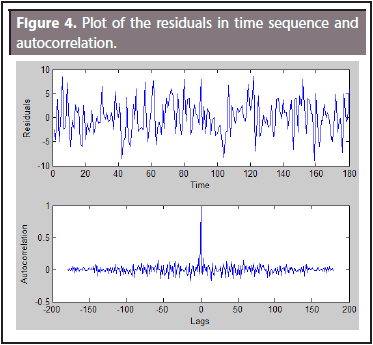
With the aim of detecting the correlations between the residuals a plot of the residuals in the time order of data collection was designed, as it is shown in Figure 4, which also shows the autocorrelation graph. It can be seen that the residual dispersion does not vary over time as the experiment progresses, allowing the compliance of the independence assumption. In addition, the autocorrelation of the first lag is just equal to 0.0287 which guarantees the independence of the residuals.
If the model is correct and the assumptions are satisfied, the residuals should be structureless; in particular, they must not be related to any other variable, including the response variable (Montgomery, 2013). When applying the test of Bartlett it was found that the assumption of homoscedasticity was not violated. It should be clarified that as the experiment corresponds to a balanced model and the assumption of normality was verified, the violation of the homoscedasticity assumption does not affect significantly the F test.
4. RESULTS
Several specifications of the regression model were tested, finding that the best linear model is the one that includes the constant and the three main factors. Table 6 shows the results of fitting a multiple linear regression model to describe the relationship Between WTP and the three independent variables. The equation of the fitted model is

Table 6 indicates that the model presented is significant. In addition, according to the t-statistic it can be said that all the factors included in the model are statistically significant. Besides, the estimated coefficients have correct signs because, as anticipated when choosing the experimental variables, the greater train headway and the longer travel time decrease users' WTP. Similarly, having access to Wi-Fi and electrical outlets services increases individuals' WTP.
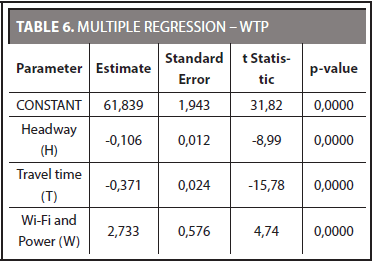
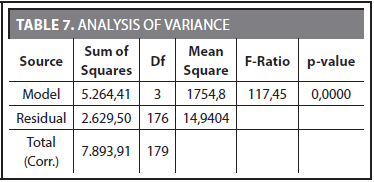
The R-Squared statistic indicates that the model as fitted explains 66,69% of the variability in WTP. The adjusted R-squared statistic, which is more suitable for comparing models with different numbers of independent variables, is 66,12%. The standard error of the estimate shows the standard deviation of the residuals to be 3,87. Since P-value in Table 7 is less than 0,05, there is a statistically significant relationship between the variables at the 95,0% confidence level. The mean absolute error (MAE) of 3,06123 is the average value of the residuals. The Durbin-Watson (DW) statistic (p = 0,6971) tests the residuals to determine if there is any significant correlation based on the order in which they occur in the data file. Since P-value is greater than 0,05, there is no indication of serial autocorrelation in the residuals at the 95,0% confidence level.
It can also be noted that residuals have no structure with respect to any of the explanatory variables. Also, an obvious structure of the residuals is not present with respect to the predicted variable. This situation allows affirming that the model is well specified and satisfactorily explains the WTP of potential users of the service.
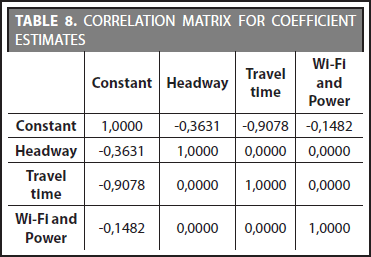
Table 8 shows estimated correlations between the coefficients in the fitted model. Normally, these correlations can be used to detect the presence of serious multicollinearity, i.e., correlation amongst the predictor variables. In our case, there are no correlations with absolute values greater than 0,5 (not including the constant term).
Based on the statistical tests performed, it is concluded that the proposed regression model should not be simplified. Moreover, since no other specifications tested gave good results, it can be said that a better model with the available data could hardly be developed. Confidence intervals for the coefficients of the regression model are presented in Table 9. Confidence intervals show how precisely the coefficients can be estimated given the amount of available data and the noise which is also present.

The experiment explores the WTP of potential users of a new high-speed train service between Barranquilla and Cartagena. It is clear that as the transport system under study is not in operation, thinking about its optimization would be unreasonable, but instead, the data collected and the calibrated model can be useful to determine the feasibility of the proposed transport system and to define its operational parameters.
To determine the viability of the proposed transport system the current rate of some highspeed trains in the world were consulted and the calculation of the rate for the hypothetical service that might be provided between Barranquilla and Cartagena (Table 10) was also done, finding that the average service rate should be about 50 thousands of Colombian pesos.

This value, compared with the average WTP of potential users, which according to the experiment is equal to 29 thousand of Colombian pesos, indicates that from this perspective the new shuttle studied would hardly ever be feasible. However, it is customary to subsidize such services (Goeverden et al., 2006); so the results of this research could be used to evaluate a subsidy policy that would allow this service to be viable. According to previous studies it seems feasible to justify the existence of a subsidy on the basis of the benefits from savings in vehicle operating costs, saving on travel time and reduction of external costs (SITR Mobility Consortium, 2014).
Although it is recommended not to extrapolate beyond the region containing the original observations (Montgomery, 2013), the adjusted regression model indicates that WTP could reach 50 thousands of Colombian pesos in an operating condition including Wi-Fi connections and power outlets, with an interval of 15 min each and a journey time of 30 min, implying a speed of 250 km/h, which is very difficult to achieve with the technology that has been considered so far and with speed restrictions in urban places.
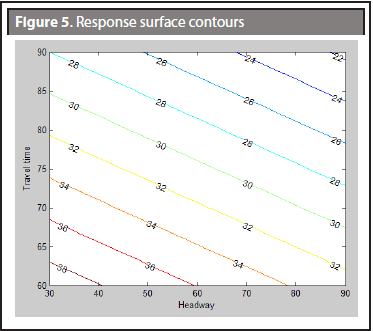
The response surface methods are commonly used for process optimization (Montgomery, 2013). In this case, the WTP has been successfully modeled by a linear function of the independent variables, finding a first-order model whose contour plot response surface and, assuming it has access to Wi-Fi and electrical connections, is shown in Figure 5.
The written regression model depending on the coded variables is

Considering that the shuttle has access to Wi-Fi and electrical connections, the model can be rewritten as:

In this case, the maximum ascent slope is equal to 0.5538 and the gradient vector corresponds to [-3.175, -5.733]. Clearly, within the operating range considered, the maximum value of the WTP ($39,132 = Colombian pesos) would be reached for a travel time of 60 min and an interval between dispatches of 30 min, as long as users have access to Wi-Fi and power connections.
The implication of decreasing the estimated travel time from 75 min to 60 min is simply to increase the operational speed design from 110 km/h to 135 km/h, i.e. an increase of 23% of speed to decrease the travel time to 20%. The need to reduce the interval between dispatches from 60 min to 30 min is slightly more complex, since providing more frequent service involves using smaller capacity equipment or provide the service with lower rates of vehicle occupancy. Either of these operational conditions has produced an increase in the costs of providing the service, which would adversely affect the expectations of the users to have a lower rate. Notwithstanding the above, in case of setting the operating conditions of the new shuttle with Wi-Fi and electrical connections, with an interval of 30 min and travel time of 60 min, the estimated WTP will only reach 39 thousands of Colombian pesos, still far from the 50 thousands of Colombian pesos, calculated based on international benchmarks.
5. CONCLUSIONS
Policymakers around the world have considered high-speed railway infrastructure development as a possible strategy to solve the passenger transportation problem among cities. As this article discusses, despite the significant investment, high-speed railway could reduce environmental externalities. In Colombia, highspeed passenger rail services are not being offered but this idea has been considered in some itineraries, such as the route between Barranquilla and Cartagena.
The willingness to pay (WTP) of potential users of a hypothetical high-speed passenger train service between Barranquilla and Cartagena has been experimentally studied. From a screening experiment it was found that the variation in travel time associated with the reliability of the shuttle does not produce a significant effect on WTP of potential users, i.e., those who currently use the service of public transport between the two cities.
Using a factorial experiment based on 180 observations it was found that the interval between offices, travel time and access to Wi-Fi and electrical systems have significant effect on users' WTP. Furthermore, by performing contrasts between pairs of each of the design variables, it was found that in all cases there are significant differences between the levels considered for each factor.
A first order regression model that satisfactorily explains the WTP in terms of interval variables, travel time and Wi-Fi and electrical connections was calibrated. The regression model was used to optimize the design of the system, concluding that, within the operating range considered, the maximum value of the WTP would be reached for a travel time of 60 min and a train headway of 30 min as long as users have access to Wi-Fi and power connections. Under these operating conditions the WTP would be 39 thousands of Colombian pesos, compared with a rate of 50 thousands Colombian pesos, estimated from international benchmarks, calls into question the viability of the proposed system.
ACKNOWLEDGEMENT
We are grateful to the Atlantic Department Government and the General Royalties System, for having partially financed this work through Project LOGPORT, BPIN 20120001001911050672.
REFERENCES
Albalate, D.; Bel, G.; Fageda, X. (2015). Competition and cooperation between high-speed rail and air transportation services in Europe. Journal of Transport Geography 42, pp. 166-174. [ Links ]
Chen, Z.; Xue, J.; Rose, A.Z.; Haynes, K.E. (2016). The impact of high-speed rail investment on economic and environmental change in China: A dynamic CGE analysis. Transportation Research Part A: Policy and Practice 92, pp. 232-245. [ Links ]
Clewlow, R.R., Sussman, J. M.; Balakrishnan, H. (2014). The impact of high-speed rail and low-cost carriers on European air passenger traffic, Transport Policy 33, pp. 136-143. [ Links ]
Consorcio Movilidad SITR (2014). Sistema integrado de transporte región Caribe - SITR. TPD-IN-SITR699-01: Pasajeros. Departamento Nacional de Planeación, Bogotá, 97 p. [ Links ]
Daziano, R. (2012). Taking account of the role of safety on vehicle choice using a new generation of discrete choice models. Safety Science 50, pp. 103-112. [ Links ]
De Rus, G.; Kageson, P. (2012). Efficient solutions for passenger transport: Investing public money in High-Speed Rail. 19th ACEA, 17 p. [ Links ]
Eriksson, L.; Johansson, E.; Kettaneh-Wold, N.; Wikström, C.; Wold. S. (2008). Design of experiments: Principles and applications Third revised and enlarged edition. Umetrics Academy, Sweden, 459 p. [ Links ]
Ettema, D.; Friman, M.; Garling, T.; Olson, L. E.; Fujii, S. (2012). How in-vehicle activities affect work commuters' satisfaction with public transport. Journal of Transport Geography 24, pp. 215-222. [ Links ]
Goeverden, C.; Rietveld, P.; Koelemeijer, J.; Peeters, P. (2006). Subsidies in public transport. European Transport No. 32, pp. 5-25. [ Links ]
Goupy, J.; Creighton, L. (2007). Introduction to design of experiments, with JMP examples. Third edition, SAS Institute Inc., SAS Campus Drive, Cary, North Carolina, 448 p. [ Links ]
Li, Z.; Hensher, D.A.; Rose, J. (2010). Willingness to pay for travel time reliability in passenger transport: A review and some new empirical evidence. Working paper ITLS-WP-10-05. Institute of Transport and Logistics Studies, The University of Sydney, 32 p. [ Links ]
Maccagni, A. (2012). NTV, Italo: Using Wi-Fi and other entertainment services to enhance the travel experience on board new express trains. Presentation to the BWCS Train Communication Systems Conference, Londod, UK, June, 18 p. [ Links ]
Márquez, L.; Jaimes, H. (2009). Modelo de demanda para un tren de pasajeros entre Tunja y Bogotá. Revista de Ingeniería Universidad de Los Andes 30, pp. 16-24. [ Links ]
Márquez, L.; Cantillo, V. (2013). Evaluating strategic freight transport corridors including external costs. Transportation Planning and Technology 36 (6), pp. 529-546. [ Links ]
Mokhtarian, P.; Neufeld, A.; Dong, Z.; Circella, G. (2013). Did free Wi-Fi make a difference to Amtrak's Capitol corridor service? An evaluation of the impact on riders and ridership. Research report UCD-ITS-RR-13-03, Institute of Transportation Studies, University of California, Davis, California, 83 p. [ Links ]
Montgomery, D. C. (2013). Diseño y análisis de experimentos. Limusa Wiley, segunda edición. México, 686 p. [ Links ]
Polo-Navarro, L.; Cipres-Bagueste, D.; Garcia-Milla, M. (2014). Impact of an intelligent transportation system on a distribution network. Through the application of discreteevent simulation and ANOVA test. DYNA, Federación asociaciones ingenieros industriales España, Alameda de Mazarredo, 89 (2), pp. 183-191. [ Links ]
Rheinberger, C.; Bründl, M. (2008). Paying for Safety: A Discrete Choice Experiment to Estimate the Willingness to pay for Risk Reductions on Alpine Roads, Swiss Federal Institute for Snow and Avalanche Research SLF, Risk Management Group. [ Links ]
Riera, P. (1994). Manual de valoración contingente. Instituto de estudios fiscales. Madrid, 188 p. [ Links ]
Sperry, B.R.; Morgan, C.A. (2010). Measuring the Benefits of Intercity Passenger Rail: A Study of the Heartland Flyer Corridor. Texas Transportation Institute, 180 p. [ Links ]
Wilson, S. R. (2011). Statistical Design and Analysis of Experiments for Next Generation Air Transportation Research. NASA Langley Research Center, NASA Statistical Engineering Symposium, May 5, 21 p. [ Links ]
Xie, M.; Ng, K.M.; Habibullah, M.S.; Kolowrocki, K.; Soszynska- Budny, J. (2012). A study of safety and reliability of maritime transportation systems. Life cicle reliability and safety engineering, 1(1), pp. 35-43. [ Links ]
Zheng, L.; Hensher, D. A.; Rose, J. (2010). Willingness to pay for travel time reliability in passenger transport: A review and some new empirical evidence. Working paper ITLSWP- 10-05, Institute of Transport and Logistics Studies, University of Sydney, 32 p. [ Links ]

