Services on Demand
Journal
Article
Indicators
-
 Cited by SciELO
 -
 Access statistics
Related links
-
 Cited by Google
 -
 Similars in
SciELO
 -
 Similars in Google
Share
Revista EIA
Print version ISSN 1794-1237
Rev.EIA.Esc.Ing.Antioq no.26 Envigado July/Dec. 2016
MONTHLY FORECAST OF ELECTRICITY DEMAND WITH TIME SERIES
PRONÓSTICO DE LA DEMANDA MENSUAL DE ELECTRICIDAD CON SERIES DE TIEMPO
PRONÓSTICO DA DEMANDA MENSAL DE ELECTRICIDADE COM SÉRIES DE TEMPO
Víctor Daniel Gil Vera1
1 Ingeniero Administrador - Universidad Nacional de Colombia. MSc en Ingeniería de Sistemas - Universidad Nacional de Colombia. Estudiante de Doctorado en Ingeniería de Sistemas - Universidad Nacional. Magíster en Administración de Empresas. Universidad Católica Luis Amigó, Medellín, Antioquia, Colombia. Tel.: 3218637163. Correo electrónico: victor.gilve@amigo.edu.co.
Paper received: 18-I-2016 / Approved: 13-X-2016
Available online: February 30, 2017
Open discussion until April 2018
ABSTRACT
The high volatility of electricity prices has motivated researchers and academics to design models that will enable the forecast of electricity demand in short, medium and long terms. This paper presents a model for forecasting the monthly electricity demand based on time series. The model uses the electricity demand values of Colombia's National Interconnected System (NIS) for the 2008-2014 period as its base. It was concluded that the time series applied to the electricity demand forecast enable a high accuracy level of prediction of future electricity demands (GWh), information which can lead to advantages for producers, distributors and large consumers when establishing strategies, streamlining operations and reaching bilateral agreements.
KEY WORDS: Energy markets; Forecasting models; Monthly electricity demand; Time series.
RESUMEN
La alta volatilidad de los precios de la electricidad ha motivado a diseñar a investigadores y académicos modelos que permitan pronosticar la demanda de la misma en el corto, mediano y largo plazo. Este trabajo presenta un modelo de pronóstico de la demanda mensual de electricidad basado en series de tiempo, el cual toma como base los valores de la demanda de energía eléctrica en el Sistema Interconectado Nacional (SIN) de Colombia en el período 2008-2014. Se concluye que las series de tiempo aplicadas al pronóstico de la demanda de electricidad permiten predecir con un alto grado de exactitud demandas futuras de energía eléctrica (GWh), información que puede generar ventajas a productores, distribuidores y grandes consumidores a la hora de establecer estrategias, optimizar su operación y realizar contratos bilaterales.
PALABRAS CLAVE: Demanda mensual de electricidad; mercados de energía; modelos de pronóstico; series de tiempo.
RESUMO
A alta volatilidade dos preços da eletricidade tem motivado a desenhar a pesquisadores e académicos modelos que permitam pronosticar a demanda da mesma no curto, médio e longo prazo. Este trabalho apresenta um modelo de pronóstico da demanda mensal de eletricidade baseado em séries de tempo, o qual toma como base os valores da demanda de energia elétrica no Sistema Interconectado Nacional (SIN) da Colômbia no período 2008-2014. Conclui-se que as séries de tempo aplicadas ao pronóstico da demanda de eletricidade permitem predizer com um alto grau de exatidão demandas futuras de energia elétrica (GWh), informação que pode gerar vantagens a produtores, revendedores e grandes consumidores à hora de estabelecer estratégias, otimizar sua operação e realizar contratos bilaterais.
PALAVRAS-CHAVE: Demanda mensal de eletricidade; Mercados de energia; Modelos de prognóstico; Séries de tempo.
1. INTRODUCTION
Electricity's importance in man's life has motivated many companies to create structural models or models based on costs to obtain estimates on future costs (Velásquez and Souza, 2007). The forecast of electricity demand has a series of factors associated to it, including the high volatility of energy prices, complex non-linear relationships, uncertainty, human limitations, organizational policies, methodological problems, limited experiences, and regulations, among others, which makes forecasting a highly complex task (Velásquez et al., 2007). Previously estimated forecasts are the reference point for the majority of the world's energy markets when participants make decisions of operations and strategies. Among the main reasons that justify the need for creating a model which serves to forecast the monthly demand of electricity are the following:
- Energy producers need forecasts in order to design commercial strategies and streamline their generation program in short term markets and to negotiate bilateral contracts in mid term markets. In long term markets, forecasts are needed to make decisions related to generation asset portfolios, new plant acquisitions, and closings of existing plants (Velásquez et al., 2007).
- In the short and mid terms, distributors and large consumers need forecasts to streamline operations, to appropriately negotiate in the short term market and to reach bilateral contracts (Velásquez et al., 2007).
- The market administrator needs quality forecasts to achieve adequate management and planning of the market (Velásquez et al. 2007).
This paper's objective is to present a model based on a time series in order to forecast the monthly electricity demand. The model was built and validated, taking the electricity demand values of Colombia's NIS during the period of 2008-2014 as base. For the construction of the model, we used time series defined as an extension of same scale values, indexed by a similar time parameter (Brillinger 2015). These time series were constructed as a technique for easy implementation and reliable results for forecasting the electricity demand, in addition to other forecast techniques, such as, artificial neural networks (ANN) or lineal regression models. In these, the basic data used are electricity demand values in the Colombian NIS in the period of 2008-2014, which were obtained from XM S.A E.S.P., company in charge of operating the National Interconnected System (NIS) of Colombia and also in charge of managing the Wholesale Energy Market (WEM). The model was developed and implemented in the R statistic software.
The article is organized as follows: after the introduction, there is a general contextualization of the Colombian electricity market, basic notions of time series, methodology employed for the construction of the model, results and validation. Finally, we conclude that the time series applied to the forecast of electricity demand enables approximations with a high degree of reliability, which in turn enables producers, distributors and large consumers to generate advantages when establishing strategies, streamlining operations and achieving bilateral contracts.
2. COLOMBIAN ELECTRICITY MARKET
During the 1980s, the Colombian electricity sector was in crisis, as were other Latin American countries. The deterioration in its performance was due to, especially, the subsidy of tariffs and the politicizing of state companies (Botero et al., 2008). The largest projects of the generation were implemented with considerable over costs and delays and led to the sector becoming a large burden for the State (Botero et al., 2008). Colombia opened the electricity sector and its wholesale electricity market in 1995, with a design similar to the British design model at the time. From the beginning of the Wholesale Electricity Market (WEM) of Colombia, on July 20, 1995, two electricity negotiation mechanisms were established: the nonstandardized contracts and direct negotiation in the short term spot market (Velásquez, Gil, and Franco, 2015). Currently, the legal basis are established in laws 142 and 143 of 1994 (Dyner et al., 2012). For the purpose of guaranteeing efficiency and reliability in service providing, a need emerged to restructure the sector based on the experience of pioneer countries, such as the United Kingdom (Rendón et al., 2011). A brief description of these regulations follows:
- Regulation 142 (residential public utilities), intends to guarantee the quality and efficiency in service providing through the regulation of existing monopolies and the promotion of competition (Régimen Legal de Bogotá D.C., 1994; Sandoval, 2004). In addition, it seeks greater participation from the private sector and the expansion of coverage in public utilities, where the State can guarantee the supply of public utilities through planning, regulation and control (Rendón et al., 2011).
- Regulation 143 (electricity regulation), establishes criteria by which the electricity service provider is governed, thus the operation of the sector, and creates some entities in charge of the management, planning, regulation and supervision of each one of the activities that make up the link in the productive chain (Régimen Legal de Bogotá D.C., 1994; Sandoval, 2004).
The main organs are made up by management and operations institutions and entities which are described in Sections 1.1 and 1.2, respectively.
1.1. Sector institutions
- Energy and Gas Regulation Commission (CREG, in Spanish) is in charge of regulating the energy sector, electricity and gas, for the purpose of providing a more efficient and better quality service (Rendón et al., 2011). Its function is to guarantee the end user more benefits, through the reduction of costs, with the objective of obtaining maximum usage of resources (Rendón et al., 2011).
- Colombian Residential Public Utility Superintendence (SSPD): technical organism, whose main duties are controlling and overseeing public utility service providers (Rendón et al., 2011).
- Mining/Energy Planning Unit (UPME in Spanish): special management unit ascribed to the Ministry of Mines and Energy. Its main duty is the creation of expansion plans regarding the electric sector (Rendón et al., 2011).
1.2. Management and Operations Organisms
- National Dispatch Center (NDC): XM dependency, affiliate of Interconexión Eléctrica S.A (ISA), in charge of supervising, controlling and planning of the integrated operation of resources for generation, interconnection and transmission of the national system for the purpose of having an affordable, reliable and safe operation (Rendón et al., 2011).
- Commercial Trade System Administrator (ASIC in Spanish): XM dependency, affiliate of Interconexión Eléctrica S.A (ISA), in charge of everything related to the registration of commercial borders and long term energy contracts and all required procedures (Rendón et al., 2011).
- National Transmission System Accounts Liquidator and Administrator (STN in Spanish): XM dependency, affiliate of Interconexión Eléctrica S.A (ISA), which participates in the Wholesale Energy Market (WEM), in charge of invoicing and liquidating charges related to the use of networks of the national interconnected system (Rendón et al., 2011).
The Colombian electricity market works as the Energy and Gas Regulation Commission (CREG) dictates. The CREG determines the rules of operation and functioning for all participants in the market (Dyner et al., 2012). The supply of electricity service to the end user in Colombia is composed of activities of generation, transportation, distribution and commercialization (Rendón et al., 2011). The first and last are close to a competitive structure, although they are really oligopolies, while the two in the middle are characterized as natural monopolies (Rendón et al., 2011). The aforementioned activities are described below:
- Generation: consists of the production of electricity. The State must guarantee that this activity is developed by means of a competitive structure, avoiding market power (Rendón et al., 2011).
- Transportation: is in charge of energy transportation at high voltage levels it the National Transmission System (NTS), set of lines and substations with equipment and transformers with connection modules which operate with tensions between 220 and 500 kW (Aguilar and Díaz, 2004; UPME, 2004).
- Distribution: the high tension (voltage) levels of energy are transformed to be delivered to the end user. In the country, energy is transported via the Regional Transmission Systems (RTS) and Local Distribution Systems (LDS) (Rendón et al., 2011).
- Commercialization: purchase of energy in the wholesale market to sell it to end users. The structure of this activity is competitive. The role of the State is mainly to guarantee the nonconcentration or non-existence of market power (Rendón et al., 2011).
Short term contracts are traded in the energy market (Gil, 2015). Transactions executed in this market can be, as in bilateral contracts, between generators and marketers or between any of the aforementioned (Rendón et al., 2011). The generators present a sole price on the prior day for the next day and declare availability to the National Dispatch Center (NDC), which is the market operator (Rendón et al., 2011). In the order of lowest to highest price merit, the declared availabilities necessary to supply the forecasted demand are dispatched. The final unit necessary to satisfy the demand dispatched determines the marginal price of the system through which all suppliers are compensated for their dispatched supplies (Rendón et al., 2011).
The mechanism of supply is done through an auction of unified price and the prices of the supply must reflect the variable costs of generation (Rendón et al., 2011). As occur in the vast majority of wholesale markets, the demanders act as passive agents in the market. The NDC receives offers from generators and begins the pre-dispatch of energy based on the demand projections constructed from: historical data, planning models and studies given by the Mining/Energy Planning Unit (UPME), without considering system restrictions. That is, the operation limits of the elements associated with the National Interconnected System (NIS) are not taken into account, nor are the undeclared lack of availabilities. Due to the restructuring of the Colombian electricity sector, during the last two decades, price behavior of electricity has increased its volatility, reflecting the existing risk for the different agents that intervene in the market (Botero et al., 2008).
3. TIME SERIES
Forecasts are a tool which provide a quantitative estimate of the probability of future events (Juárez, Zuñiga, Flores, and Partida, 2016). One of the techniques to do so are time series, used in a wide range of disciplines: finance, transportation, markets, biology, medicine, engineering, etc., to analyze the behavior of a time variable and enable decision making (Moreno-García, Jiménez-Linares, and Rodréguez-Benítez, 2017). These take as a historical base to obtain a statistical characterization on the existing links in the past and the present (Diebold, 2001). In the last two decades, the challenge of predicting the future by looking to the past has led to the creation of a variety of prediction algorithms of time series (Egrioglu, E., Yolcu, U. and Aladag, C. 2015; Hyndman, R.J., Khandakar, Y 2008). These enable considering time information, estimating parameters and provide specific data on future values (Lütkepohl, H., 2005; Pravilovic, Bilancia, Appice, and Malerba, 2017).
A time series is a succession of random values organized according to a unit of time, Y1......, T . These are useful to obtain forecasts of future values of the series for the purpose of helping to make decisions that have important consequences or to better understand the mechanism of data generation, which might or might not be clear initially in research (Giraldo, 2011). These are also used to analyze the dynamic behavior of complex systems (Zunino, Olivares, Bariviera, and Rosso, 2017).
Time series are classified into stationery and non-stationery. The first are characterized for being stable along time. The tendency in the non-stationery time series can change along time (Giraldo, 2011). The main components of the time series: tendency, seasonality and heteroscedasticity, indicate the periodical and long term behavior of the series. Given a series Tt, t = 1,......,T, the Additive Model consists of assuming that it can be cleared intothree components (Quintana and Jiménez, 2016). See Equation (1):
Where Tt is the tendency, St is the seasonal component and εt is the error component. The components Tt and St are functions of t determinants and the evolution is perfectly predictable (Giraldo, 2011). A series of time has a seasonal period component of S, if it presents patterns that repeat themselves in a constant frequency (S), producing in the series a periodical effect (Diebold, 2001).
4. METHODOLOGY
For the construction of the model, the values of the monthly demand of electricity (GWh) of the Colombian SIN during the 2008-2014 time period were used. These were obtained from the company XM S.A E.S.P, in charge of operating the Colombian SIN, as well as managing the WEM. The monthly demand values registered in 2014 were used for the validation of the model. Figure 1 shows the monthly demand tendency of electric energy in the Colombian SIN during the period of 2008-2013.
Table 1 shows the data used for the construction of the model:
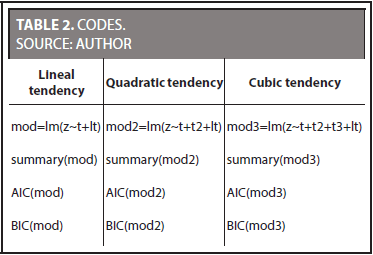
The model developed was constructed with R statistical software, programing environment for computation and generation of statistical graphs compatible with a wide variety of platforms: UNIX, Windows and MacOS (R Cran Project, 2015), and distributed under the license of GNU GPL (General Public License) (Wikipedia, 2015b). For the construction of the model, the following libraries were used: Car, Forecast, Lmtest and Zoo. Three models of additive time series with different tendencies were were developed in this project: lineal, quadratic and cubic. The Equation (2), shows the general tendency model, where p is the order of the polynomial of the function of the component of the tendency.
Table 2, presents the code applied in each one of the models:
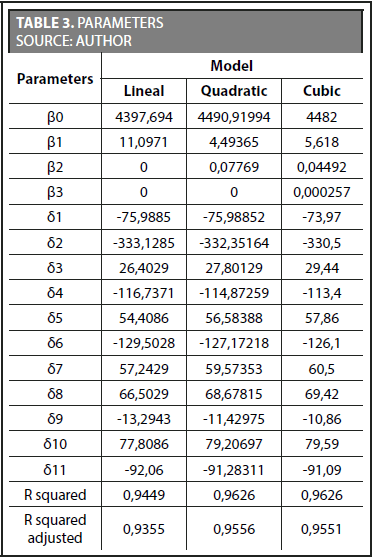
The best model was chosen according to the methodological and philosophical principles of the "Navaja de Ockham" also known as the principal of parsimony or of economics, attributed to the Franciscan friar, philosopher, and logic scholar Guillermo de Ockham (1280-1349), which establishes that: "under equal conditions, the simplest explanation is usually the right explanation," (Wikipedia, 2015a). Table 3 shows the monthly parameter and delta values for each one of the models developed:
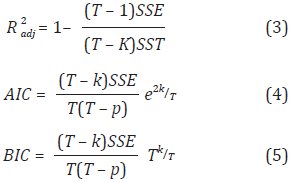
The criteria used for choosing the best model were the following: R squared adjusted (R2adj ) larger, Akaike Information Criteria (AIC) and Bayesian Information Criteria (BIC)smaller. Folowing, the respective equations of the mentioned criteria are shown. See Equations (3), (4) and (5):
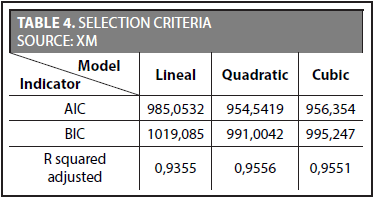
Where T is the number of periods in the sample, P is the number of parameters in the model and K = P + 1. Table 4 presents the values for each one of the mentioned criteria and for each one of the models developed:
We can see the quadratic model has the greatest R squared adjusted (R = 0.9556), the lowest AIC (954,5419) and the lowest BIC (991,0042), which is why it is the best one to adjust to the model's conditions.
5. VALIDATION AND RESULTS
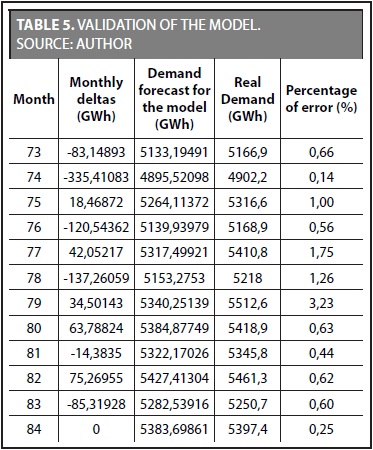
For the validation model, we took the monthly demand registered in 2014 as base. The demand was calculated for each month according to the model's components and the percentage of error. Table 5 presents the estimated and real (GWh) demands and the percentage (%) of error.
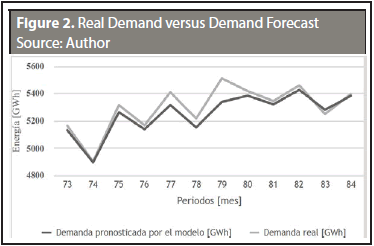
Figure 2 shows the series of values of the Real Demand versus the Demand Forecast for the model for 2014:
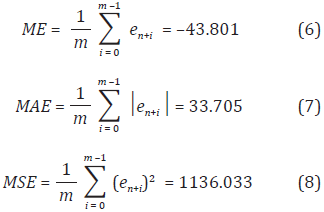
Some basic statistics applied to measure how appropriate the monthly electricity demand forecast were the following: Average Forecast Error (ME), Absolute Average Error of Forecast (MAE) and Median Quadratic Error of Forecast (MSE). See Equations (6), (7) and (8):
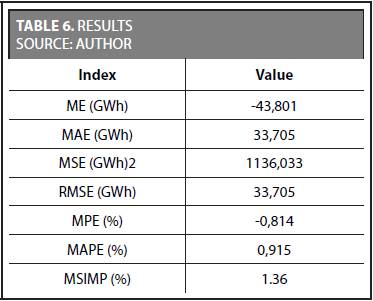
The MPE and MAPE are in statistical data in intuitive format and easy to interpret since they represent the average error percentage or the average absolute error of the forecasts and provide more concrete information regarding the precision of the forecast than the MSE. In the selected model, the MAPE = 0.915% statistic, is less than the MSIMP = 1.136%, which indicates that the model developed reduces the relative error percentage in the prediction by 0.45% with respect to the simple method. This guarantees the use of the forecast model developed. See Table 6:
6. CONCLUSIONS
Forecasting the electricity demand is an important task for all agents participating in the Colombian electricity market (managers, producers, distributors and large consumers), since forecasting enables a future view of market behavior, aids in the establishment of commercial strategies, streamlines generation programs and allows for the negotiation of beneficial bilateral contracts. Among the different methods and techniques used for forecasting electricity demand, time series enable obtaining predictions with a high degree of reliability. For this paper, three models were developed using additive time series with different tendencies (linear, quadratic and cubic). The quadratic tendency model was the model that best adjusted itself to he selection criteria: R squared adjusted larger, Akaike Information Criteria (AIC) and smaller Bayesian Information Criteria (BIC): R2adj = 0,9556, AIC = 954,5419, BIC = 991,0042. The average error percentage does not surpass 0.93%, which indicates that the model developed presents a high level of approximation to real prices.
REFERENCES
Aguilar, A.; Díaz, J. (2004). Una visión del mercado eléctrico colombiano. Bogotá: Unidad de Planeación Minero Energética (UPME). [ Links ]
Botero, S.B; Cano Cano, J.A. (2008). Análisis de series de tiempo para la predicción de los precios de la energía en la bolsa de colombia. Cuadernos de Economía, 48, pp. 174-207. [ Links ]
Brillinger, D.R. (2015). Time Series: General. International Encyclopedia of the Social y Behavioral Sciences, 2, pp.341-346. [Online] Disponible en: http://www.sciencedirect.com.ezproxy.unal.edu.co/science/article/pii/B9780080970868420842. [ Links ]
Diebold, F. (2001). Elements of forecasting 2nd ed. South y W. C. Publishing., eds., Australia. [ Links ]
Dyner, I.; Franco, C.J.; Arango, S. (2012). El mercado mayorista de electricidad colombiano 1st ed. C. F. de Minas, ed., Medellín: Universidad Nacional de Colombia. [ Links ]
Egrioglu, E.; Yolcu, U.; Aladag, C. (2015). Red neuronal artificial multiplicativo modelo neuronal recurrente para el pronóstico de series de tiempo no lineales. Proceso Neural. Lett., 41(2), pp. 249-258. [ Links ]
Gil, V. D. (2015). Forecasting Electricity Demand for Small Colombian Populations. Cuaderno Activa, 7(7), 111-120. [ Links ]
Giraldo, N. (2011). Modelado y Pronóstico de la Tendencia. pp. 17-29. [Online] Disponible en: http://www.medellin.unal.edu.co/~ndgirald/Archivos%20Lectura/Archivos%20curso%20Series%20EIO/Trabajo_No1_EstadisticaIII_sem01_12.pdf. [Consultado 4 de marzo de 2016] [ Links ].
Hyndman, R.J.; Khandakar, Y. (2008). Serie de Tiempo automático de predicción: el paquete pronóstico para R. J. Stat. Software, 27 (3), pp. 1-22. [ Links ]
Juárez, A. C.; Zúñiga, C.A.; Flores, J.L.M.; Partida, D.S. (2016). Análisis de series de tiempo en el pronóstico de la demanda de almacenamiento de productos perecederos. Estudios Gerenciales, 32(141), 387-396. [ Links ]
Lütkepohl, H. (2005). Nueva Introducción al Análisis Temporal de Series Múltiples. Springer-Verlag Berlin Heidelberg. [ Links ]
Moreno-García, A.; Moreno-García, J.; Jiménez-Linares, L.; Rodríguez-Benítez, L. (2017). Time series represented by means of fuzzy piecewise lineal segments. Journal of Computational and Applied Mathematics, 318, 156-167. [ Links ]
Pravilovic, S.; Bilancia, M.; Appice, A.; Malerba, D. (2017). Using multiple time series analysis for geosensor data forecasting. Information Sciences, 380, 31-52. [ Links ]
Quintana, M.J.G.; Jiménez, S.A.M. (2016). Modelos de series de tiempo aplicados a los expedientes de la Comisión de Derechos Humanos del Distrito Federal. Economía Informa, 398, 89-99. [ Links ]
R Cran Project (2015). The Comprehensive R Archive Network. p.1. [Online] Disponible en: https://cran.rproject.org/ [Consultado 24 de julio de 2015] [ Links ].
Régimen Legal de Bogotá (1994). Ley 143 de 1994 Nivel Nacional. [Online] Disponible en: https://www.minminas.gov.co/documents/10180/667537/Ley_143_1994.pdf/c2cfbda4-fe12-470e-9d30-67286b9ad17e [Consultado 3 de marzo de 2017] [ Links ].
Régimen Legal de Bogotá D.C. (1994). Ley 142 de 1994 Nivel Nacional. [Online] Disponible en: http://www.alcaldiabogota.gov.co/sisjur/normas/Norma1.jsp?i=2752 [Consultado 3 de marzo de 2017] [ Links ].
Rendón, J.G.; Hinestroza, A.G.; Moreno, L.S. (2011). Determinantes del precio de la energía eléctrica en el mercado no regulado en Colombia. Revista Ciencias Estratégicas., 19(26), pp. 225-246. [ Links ]
Sandoval, A.M. (2004). Monografía del sector de electricidad y gas colombiano: Condiciones actuales y retos futuros. pp. 27-45. [Online] Disponible en: https://colaboracion.dnp.gov.co/CDT/EstudiosEconmicos/272.pdf. [ Links ]
UPME (2004). Una visión del mercado eléctrico colombiano. pp. 1-110. [ Links ]
Velásquez, J.; Souza, R. (2007) ¿Por qué es tan difícil obtener buenos pronósticos de los precios de la electricidad en mercados competitivos? Revista Cuadernos de Administración, 20(34), pp. 259-282. [ Links ]
Velásquez, J.D.; Gil, V.; Franco, C.J. (2015). An Overview of the Colombian Market for Standarized Derivatives of Energy Commodities. IEEE Latin America Transactions, 13(7), 2176-2182. [ Links ]
Wikipedia (2015a). Navaja de Ockham. pp. 1-3. [Online] Disponible en: http://es.wikipedia.org/wiki/Navaja_de_Ockham [Consultado 9 de junio de 2015] [ Links ].
Wikipedia (2015b). R: lenguaje de Programación. pp.1-3. [Online] Disponible en: http://es.wikipedia.org/wiki/R_(lenguaje_de_programación) [Consultado 9 de junio de 2015] [ Links ].
Zunino, L.; Olivares, F.; Bariviera, A.F.; Rosso, O. A. (2017). A simple and fast representation space for classifying complex time series. Physics Letters A, 381(11), 1021-1028. [ Links ]


 text in


