Serviços Personalizados
Journal
Artigo
Indicadores
-
 Citado por SciELO
 -
 Acessos
Links relacionados
-
 Citado por Google
 -
 Similares em
SciELO
 -
 Similares em Google
Compartilhar
Revista EIA
versão impressa ISSN 1794-1237
Rev.EIA.Esc.Ing.Antioq no.27 Envigado jan./jun. 2017
REMOTE PROTEIN HOMOLOGY DETECTION USING PHYSICOCHEMICAL PROPERTIES
DETECCIÓN DE HOMÓLOGOS REMOTOS USANDO PROPIEDADES FISICOQUÍMICAS
DETECÇÃO DE HOMÓLOGOS REMOTOS USANDO PROPRIEDADES FISICOQUÍMICAS
Óscar Bedoya1
1 Doctorado en Ingeniería. Maestría en Ingeniería. Profesor asociado. Universidad del Valle, Cali, Colombia. Escuela de Ingeniería de Sistemas y Computación. Edificio 331 - espacio 2103. Ciudad Universitaria Meléndez - Universidad del Valle, Cali, Colombia. Tel.: 3212100 - Ext: 2781. Correo electrónico: oscar.bedoya@correounivalle.edu.co.
Artículo recibido: 05-VIII-2013 / Aprobado: 03-X-2017
Disponible online: 30 de agosto de 2017
Discusión abierta hasta octubre de 2018
ABSTRACT
A new method for remote protein homology detection, called CDA (Characteristic Distribution Analysis), is presented. The CDA method uses the distributions of physicochemical properties of amino acids for each protein. Given the training sequences of a SCOP (Structural Classification Of Proteins) family, a characteristic distribution is achieved by averaging the values of the distributions of its proteins. The hypothesis in this research is that each protein family F has a characteristic distribution that separates its sequences from the rest of the proteins in a dataset. Since there are multiple properties, close to 554 in the AAindex, a set of 72 physicochemical properties was selected to create different characteristic distributions of the same family. Each characteristic distribution is used as a classifier. Finally, a Naive Bayes classifier is trained to combine the information of the individual classifiers and obtain a better decision. We found that each family has a set of physicochemical properties that allow the discrimination of their sequences better. CDA achieves a True Positive (TP) rate of 0,793, a False Positive (FP) rate of 0,005, and a Receiver Operating Characteristic (ROC) area of 0,918. The CDA method outperforms some of the current strategies such as SVM-PCD and SVM-RQA.
KEY WORDS: Remote Homology Detection, Physicochemical Properties, SCOP Family.
RESUMEN
En este artículo se presenta un nuevo método para la detección de homólogos remotos en proteínas llamado CDA (Análisis de Distribución Característica). El método utiliza distribuciones de las propiedades fisicoquímicas de los aminoácidos para cada proteína. Dada una familia SCOP se calcula su correspondiente distribución característica promediando los valores de las distribuciones para las proteínas que la componen. La hipótesis en está investigación es que cada familia F tiene una distribución característica que permite diferenciar las secuencias del resto de las proteínas en el conjunto de datos. Debido a que existen muchas propiedades, alrededor de 554 en el AAindex, se seleccionó un conjunto de 72 índices para crear las distribuciones. Cada distribución característica se usa como un clasificador de familias SCOP. Por último, se utiliza una clasificador Bayesiano para combinar la información de los clasificadores individuales creados a partir de las distribuciones para llegar a una mejor decisión. Encontramos que cada familia tiene un conjunto de propiedades físicoquímicas que permiten una mejor discriminación de sus secuencias. El método CDA alcanza una tasa de Aciertos Positivos (TP) de 0,793, una tasa de Falsos Positivos (FP) de 0,005 y un puntaje ROC de 0,918. El método propuesto mejora la exactitud de algunas de las estrategias existentes tales como SVM-PCD y SVM-RQA.
PALABRAS CLAVE: Detección de homólogos remotos, Propiedades Fisicoquímicas, Familia SCOP.
RESUMO
Neste artigo apresenta-se um novo método para a detecção de homólogos remotos em proteínas chamado CDA (Análises de Distribuição Característica). O método utiliza distribuições das propriedades fisicoquímicas dos aminoácidos. Dada uma família SCOP calcula-se sua correspondente distribuição característica promediando os valores das distribuições para as proteínas que a compõem. A hipótese nesta investigação é que cada família F tem uma distribuição característica que permite diferenciar as sequências em F do resto de proteínas. Ao existir muitas propriedades, ao redor de 554 no AAindex, selecionou-se um conjunto de 72 índices para criar as distribuições. Cada distribuição característica usa-se como um classificador de famílias SCOP. Por último, utiliza-se um classificador Bayesiano para combinar a informação dos classificadores individuais criados a partir das distribuições. O método CDA atinge uma taxa de acertos positivos de 0,793, uma taxa de falsos positivos de 0,005 e uma pontuação ROC de 0,918. O método proposto melhora a exatidão de algumas das estratégias existentes tais como SVM-PCD e SVM-RQA.
PALAVRAS-CHAVE: detecção de homólogos remotos, família SCOP, propriedades fisicoquímicas.
1. INTRODUCTION
Remote homology detection identifies structural homology in evolutionarily related proteins that present low sequence similarity. It can be defined as a process that takes a target protein and retrieves proteins that are similar in function but distant in sequence. Homology detection can be a difficult task because proteins in the search space share low sequence similarities with the target domain, and the relationship has to be measured at 3D structural and/or functional levels (Bedoya and Tischer, 2014). Function and structure are generally more conserved during evolution than the amino acid sequence. Thus, proteins that do not exhibit high sequence similarity could still be functionally and structurally related (Yang et al., 2008).
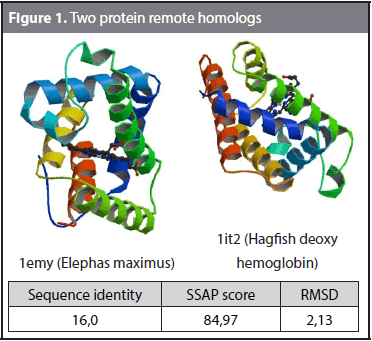
The formal definition of remote homology refers to protein sequences with less than 25% sequence identity that exhibit a similar function (Homaeian et al., 2007; Huang and Bystroff, 2006). However, remote homology detection can also be defined as the problem of taking a target protein P and retrieving proteins in the same superfamily of P that belong to a different family. Figure 1 shows an example of remote homology. The sequence identity and structural similarity of domains 1emy (Elephas maximus) and 1it2 (Hagfish deoxy hemoglobin) were compared. The sequence identity is the number of matching residues in a sequence alignment between two domains. Structural alignment establishes the homology between two polymer structures based on their three-dimensional conformation. SSAP (Sequential Structure Alignment Program) (Orengo and Taylor, 1996) was used to calculate the structural alignment. SSAP gives the RMSD (Root Mean Square Deviation) and SSAP score as outputs. The RMSD is a measure of the divergence of two aligned structures, and the SSAP score measures the structural alignment, where 100 is the highest structural similarity. A sequence identity of 16%, a SSAP score of 84,97 and an RMSD of 2,13 were obtained. The results show that these two domains share high structural similarity and a low sequence identity and thus can be considered remote homologs.
Several methods have been proposed for remote homology detection (Jaakkola et al., 2000; Hou et al., 2003; Goldstein, 2004; Dong et al., 2006; Gao, 2006; Yang et al., 2008; Webb-Robertson et al., 2010; Muda et al., 2011; Chitraranjan et al., 2011). However, an effective strategy is still needed. Existing methods may still be confused by poor similarity between the amino acid sequences even though they are closely related in function (Huang and Bystroff, 2006). SVM I-sites (Hou et al., 2003) is a remote homology detection method. It uses the I-site library to generate a score by submitting every subfragment of an unknown target sequence to the log-odd matrix representing each I-site. Because there are motifs of different sizes, the similarity scores of different clusters of I-sites are not directly comparable. Thus, there is a need to map each score to a range of comparable values. Hou et al. (2003) proposed to use a confidence curve for each specific cluster of I-sites. A confidence curve maps similarity scores to the probability of the correct local structure based on a jack-knife test. The confidence of a fragment prediction is the probability that a sequence segment with a given score has the structure predicted by the motif. To predict the local structure of any unknown protein sequence, the sequence patterns (profiles) for each of the 263 clusters of the I-sites library are used to score all subfragments of the unknown target sequence. A feature vector for a protein P in Huo et al. (2003) is calculated as the sum of confidence values for 263 motifs in all subfragments in P.
Another remote homology detection method is presented by Gao (2006). It uses the γ-matrix of the HMMSTR model. The well-known γ-matrix (Rabiner and Biing-Hwangh, 1986) has 281 columns representing the Markov states of HMMSTR (Hidden Markov Model for protein STRucture) and N rows, where N is the length of the protein P submitted to the model. Gao (2006) calls every row of the γ-matrix a γ-vector. Then, γ-vectors are clustered to determine the most representative vectors in a training data set. k-means is used as the clustering algorithm, and the centroids are taken as the representative γ-vector set. Finally, each γ-vector of a protein P in a training set is mapped to the nearest cluster and thus every protein is represented as a chain of symbols indicating the sequence of mapped clusters. The whole training set of proteins is indexed using a suffix tree to make the querying process faster.
Muda et al. (2011) address remote homology detection and fold recognition problems. A twolayer classifier is proposed. In the first level, an SVM (support vector machine) classifier is used to detect remote protein homology. The classification is performed based on one-versus-all binary classifiers. The feature vector used to train the SVM is based on the numerical values of the AAindex (Kawashima et al., 2008). Scaling is performed over numerical data to avoid dominance during the classification process. SVM-PCD (Webb-Robertson et al., 2010) uses the concept of physicochemical property distributions for protein homology detection. Every protein is represented as the distribution of its 4-mers, the average of the physicochemical values in a 4 amino acid window. A distribution of 18 values is obtained for each index in the AAIndex database. Webb-Robertson et al. (2010) propose PCD(531), PCD(181), and PCD(61), which take 531, 181, and 61 indices of the physicochemical properties in the AAIndex, respectively. The values considered in each case are concatenated and used to train an SVM for each family.
In this paper, a new method for remote protein homology detection, called Characteristic Distribution Analysis (CDA), is presented. The CDA method is based on obtaining a distribution of the physicochemical properties of amino acids for each protein. A characteristic distribution is built with the training sequences of each SCOP family. The hypothesis of this research is that each family F has a characteristic distribution that separates its sequences from the rest of the proteins in a dataset. There are 554 physicochemical properties in the AAindex. In this research, 72 physicochemical properties commonly referred are used. The methodology that is used in this research makes it possible to try every physicochemical property independently from the others, and thus, the physicochemical property that discriminate better the sequences in a specific protein family can be obtained. In addition, a final decision is also obtained when a Naïve Bayes classifier is used.
2. METHODS
2.1. Position weighted sliding window
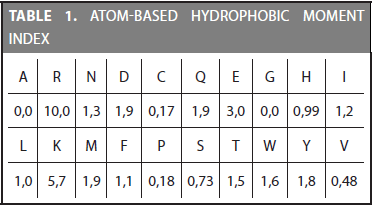
The first step in the CDA method is transforming the amino acid sequence into the physicochemical values defined in a specific index. Every index assigns a value for each of the 20 amino acids. For example, the atom-based hydrophobic moment is defined by the 20 values shown in Table 1. As can be observed, the highest hydrophobic moment belongs to the Arginine (R) amino acid and the lowest to the Alanine (A). Physicochemical properties are included in remote homology detection due to the hypothesis that they are mostly conserved during evolution (Grigoriev and Kim, 1999; Yang et al., 2008).
In this paper, a position weighted sliding window of size 5 is used instead of averaging the values at each position. We use the same strategy proposed by Bedoya and Tischer (2014). According to their strategy, the weight in each position indicates the contribution to the representative value of the window and is assigned to the amino acid in its center. Given the five values (v1, v2, v3, v4, v5) of a physicochemical property for the amino acids (ai-2, ai-1, ai, ai+1, ai+2), the contribution value c of the window assigned to the amino acid ai is calculated as in Equation (1).
The size of the window tries to capture local interactions between amino acids that are actually closed neighbours. The size of the window considered that the most important 3D relationships between amino acids occur in a local range. Given an amino acid sequence of n residues and the 5-size sliding window, a total of n-4 contribution values are obtained. The set of values obtained from the sliding windows of the whole protein is called a Contribution Vector (CV) (Bedoya and Tischer, 2014).
2.2. Selection of physicochemical properties
There are 554 physicochemical properties in the AAindex. According to Yang et al. (2008) and Webb-Robertson et al. (2010), there are indices that reflect either functional or structural characteristics of a specific protein family. For instance, in SVMRQA (Yang et al., 2008) the best indices for the 1.4.1.3 SCOP family (c-Myb DNA-binding domain) are found. The 1.4.1.3 family contains hydrophobic side chains and helical proteins. The most adequate indices for this family are pK(-COOH), polarity, alpha-helix propensity derived from designed sequences and the normalized frequency of the left-handed alpha-helix. The first two indices are related to the hydrophobicity property and the last two are structural related indices. In SVM-PCD (Webb-Robertson et al., 2010) the 531 indices in the AAindex were used. They also reduced the number of indices based on a correlation analysis and showed that no gain in accuracy is achieved beyond the 61 indices used in SVM-PCD(61).
In this paper, 72 indices were selected considering the results reported by Yang et al. (2008) and Webb-Robertson et al. (2010). The list of the selected indices is shown in Table 2. The goal of using a considerable amount of indices is to detect which ones are most appropriate to be used in the CDA analysis.
2.3. Obtaining a distribution for each protein sequence
The next step in the CDA analysis is to obtain the distribution of the contribution vectors for each protein. The decision of obtaining a distribution is related to transform every amino acid sequence into a fixed-size set of values. In this paper, 20 values are used to describe the distribution of the values in the contribution vector. Thus, proteins of different sizes become comparable because they are all expressed as a set of 20 values.
First of all, every value in the contribution vector is normalized to the mean and standard deviation associated with the index representing a physicochemical property by following the same strategy proposed by Bedoya and Tischer (2014). The mean and deviation of an index are calculated by averaging the 3200000 possible contribution values that might be obtained from a 5-size window. Equations (2) and (3) show the calculation of the mean and deviation, respectively.
where vi, vj, vk, vl, and vm are the values of a specific index. Each summation goes from one to 20, indicating the 20 possible values of a physicochemical property.
Mean and deviation are calculated for each of the 72 indices. For example, the atom-based hydrophobic moment index have a mean of 1,8221 and a deviation of 1,1948. Once the mean and deviation are calculated, each value in a contribution vector is normalized by using Equation (4). The set of normalized values of a protein is called Normalized Contribution Vector (NCV).
where CVij is the i-th value in the contribution vector using the j-th index, μj is the mean of the j-th index and σj is the standard deviation of the j-th index. Normalizing to the mean and deviation transforms values in CV to values thar are mostly in the range from -4σ to 4σ. The next step is taking the normalized values and turning them into a distribution. This is done by a binning process. Binning the range of the normalized values consists of calculating the frequency for each bin, starting from -1,8 and taking intervals of 0,3 up to 3,9. The binning process produces 20 frequency values. Finally, the frequency values are normalized by dividing each value by the number of values in the normalized contribution vector.
Figure 2 shows the distributions for two sequences. Families 1.27.1.1 and 1.36.1.5 were selected to observe the difference between the distributions of two proteins when the atombased hydrophobic moment index is used. It is expected that the distributions of sequences that belong to different families exhibit clearly different shapes.
2.4. Obtaining a Characteristic curve for each family
The hypothesis in this paper is that each family has a characteristic curve that represents the values of the distributions of the sequences in the family. A characteristic distribution for a family F is obtained by taking its sequences, calculating the distributions, and averaging the values in each position. We used the dataset proposed by Liao and Noble (2003), which has become the standard dataset in remote homology detection. The dataset is formed by 54 families, each family having a different amount of sequences and specific sets for training and testing. Details of the definitions of the dataset are available at http://noble.gs.washington.edu/ proj/svm-pairwise/. The training dataset available for each family was used to obtain its characteristic distribution. In addition, the 857 sequences referred as the test sequences in (Liao and Noble, 2003) were used to calculate the accuracy of the method.
Figure 3 shows the characteristic distributions for families 1.36.1.5, 2.1.1.1, 2.28.1.1, and 7.41.5.2. Atom-based hydrophobic moment index was used. Each characteristic distribution is obtained by averaging the values of the distributions in the same family. There are 72 characteristic distributions for each family (i.e., one distribution is obtained for each physicochemical property). It was observed that some indices discriminate the 54 families better than others. In addition, there are families that are difficult to be represented and only a few indices are able to discriminate them.
Figure 4 shows the characteristic distributions of families 1.36.1.5, 2.1.1.1, 2.28.1.1, and 7.41.5.2 when the alpha-helix propensity derived from designed sequences index is used. Each specific physicochemical property gives a different view of the same family. As can be observed from Figures 3 and 4, the 1.36.1.5 family exhibits medium values of hydrophobic moments and it is formed by sequences that show a high alpha-helix propensity.
2.5. Detecting remote homologs
The CDA method builds a classification model for each family. Even though not every physicochemical property is appropriate for discriminating the 54 families, we expect that at least one of the indices represents each family. Classification of a protein P in a SCOP family is done by transforming P into a normalized contribution vector and comparing it with the characteristic distributions of the 54 families. The comparison is performed by using the Manhattan distance. Formally, given the normalized contribution vector of P, NCVp = (v1, v2,...,v20), the distance between P and the i-th characteristic distribution using the j-th physicochemical property is calculated as follows:
where NCVijk is the k-th value in the i-th characteristic distribution using the j-th physicochemical property. Once the distances to the characteristic distributions are calculated, protein P is assigned to the family with the lowest distance (i.e., the nearest distribution).
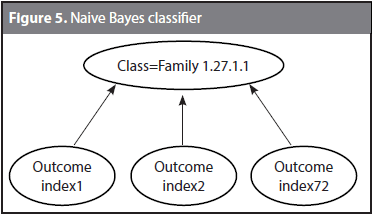
Given a target protein P and 72 characteristic distributions, every physicochemical property gives an outcome (i.e., a classification decision). Each classification tries to assign P to its actual family by using a different physicochemical property. Because some of the classification decisions might coincide with the correct family, and some others might be wrong, a Naive Bayes classifier was trained to learn the correct family given the 72 outcomes. Figure 5 shows the structure of the Naive Bayes classifier used to the family 1.27.1.1. The classification decision is taken based on the outcomes of the 72 indices. It might be expected that although not all the outcomes matches the actual classification, at least a few of them are correct and the Bayes classifier identifies them. The Naive Bayes classifier follows the conditional model p(C|F1, F2,..., Fn) where C is the number of classes (i.e., the 54 families) and F1 to Fn are the feature variables (i.e., the outcomes from index1 to index72).
Once the SCOP family is determined for a protein P, the remote homologs are identified by returning the sequences in the same superfamily but outside the predicted family.
3. RESULTS AND DISCUSSION
In this section, the results obtained in the experiments are described. First of all, we calculated the accuracy of having a characteristic distribution for each family. Then, the Naïve Bayes classifier was tested. The experiments were carried out by using two scripts. The calculation of both the distribution for each protein sequence in the dataset and the characteristic curve for each family was performed by using the Bio-Python programming language. The Naïve Bayes classifier was obtained by using the WEKA data mining tool (Hall et al., 2009). The parameters were kept by default.
3.1. Classification accuracy
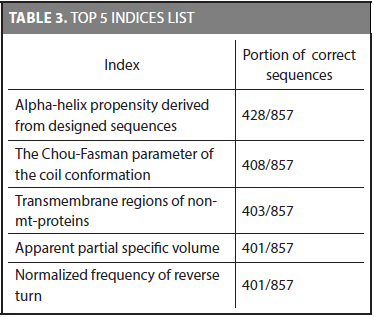
First of all, the discriminative potential of the characteristic distributions was tested. We used the same training and testing datasets proposed by Liao and Noble (2003). The characteristic distributions for each family were obtained by using the training dataset and then the accuracy of the method was calculated on the testing dataset. Using every physicochemical property to classify protein sequences in their correct family showed the following top 5 indices ordered by the amount of matches. Table 3 shows the indices that classify most proteins given a total of 857 sequences in the test set.
The alpha-helix propensity derived from designed sequences index detects the correct family 428 out of the 857 sequences. It was the best index considering the number of matches. In addition, we found that even though two indices have the same number of correct matches, it does not necessarily mean that they classify the same sequences (i.e., the 401 sequences of the apparent partial specific volume index are not necessarily the same of the 401 sequences of the normalized frequency of reverse turn index). Counting the number of sequences that have at least one index that allows identifying its correct family gives a total of 840 sequences. It shows that even though the best index identifies 428 correct families (49,975%), the set of 72 physicochemical properties allows to detect the 98,01% of the whole sequences. There are 17 sequences that none of the physicochemical properties used in this research are able to identify (i.e., two sequences in family 2.1.1.4, three sequences in family 2.28.1.1, and 12 sequences in family 2.44.1.2).
Some protein families are easy to represent (i.e., several indices represent most of their sequences), and some other families are difficult to represent (i.e., just a few indices represent them). For each protein family, there is an index that represents most of its sequences. Table 4 shows the best index for each of the 54 f amilies.
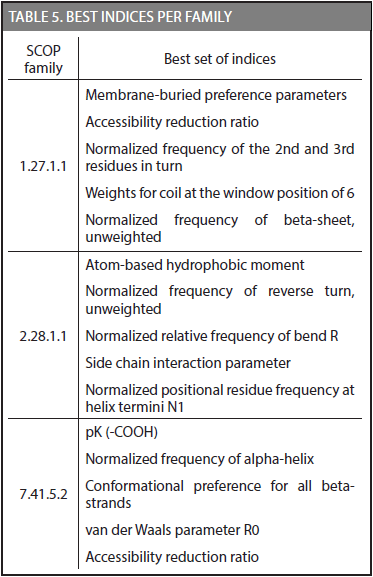
Another important result was achieved in this research; each family has a set of physicochemical properties that exhibit the highest discriminative potential in the CDA method. Table 5 shows the best set of indices for families 1.27.1.1, 2.28.1.1, and 7.41.5.2.
A total of 840 proteins out of the 857 sequences in the test set have at least one index that discriminate them by SCOP families. Given a protein P with unknown family, the normalized contribution vector of P has to be compared to the 54 characteristic distributions. In addition, because there are 72 characteristic distributions for each family, every physicochemical property gives an outcome (i.e., a classification decision). The 72 outcomes for P are submitted to the Naive Bayes classifier. It calculates the probability of P belonging to each of the 54 classes, p(C|F1, F2,..., Fn) where C is the number of classes (i.e., the 54 families) given F1 to Fn (i.e., the 72 outcomes previously obtained). The classification obtained by the Naive Bayes technique is taken as the SCOP family predicted for P.
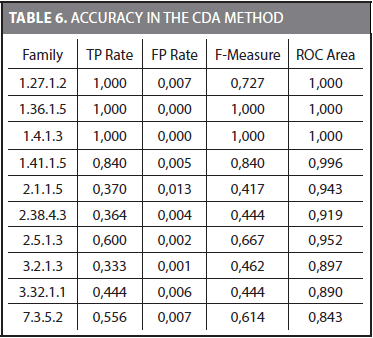
Building a Naïve Bayes classifier requires an additional dataset for its training. Because we have to keep the testing dataset unseen during training, we split the training dataset proposed by Liao and Noble (2003) into two parts. The 70% of the sequences in the training dataset was used to obtain the characteristic distributions for each family. The remaining 30% was used to train the Naïve Bayes classifier. Finally, the testing dataset was used to obtain the accuracy of the Naïve Bayes classifier. Table 6 shows the TP rate (true positive), FP rate (false positive), F-Measure, and ROC area (Receiver Operating Characteristic) for some families.
The mean values considering the 54 families for TP Rate, FP Rate, F-Measure, and ROC area are 0,793, 0,005, 0,793, and 0,918, respectively. The ROC area is frequently used to compare different methods. It was observed that for some families (i.e., 1.36.1.5 and 1.4.1.3) most of the 72 outcomes coincide with the correct family. These families are easier to represent by a Naive Bayes classifier and a TP rate of 1,0 and a FP rate of 0,0 are obtained. On the other hand, there were families in which just a few of the 72 outcomes were correct.
3.2. Reducing dimensionality
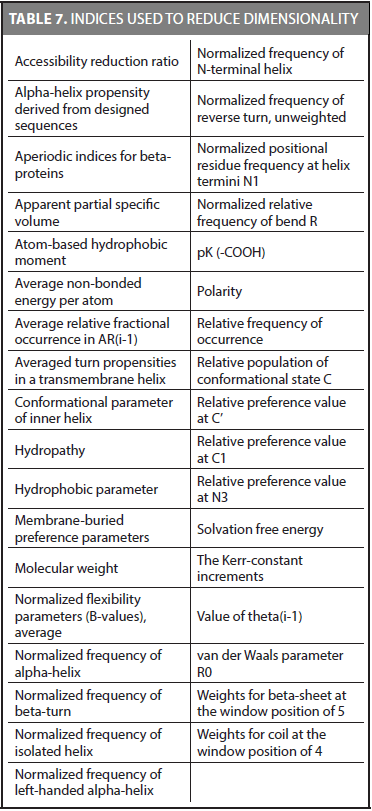
We reduced the dimensionality of CDA method in another experiment. The same methodology was used considering only the best indices for the 54 families. Because we found that some families share the same best index, we were able to reduce the number of indices to 35. These indices are shown in Table 7.
The mean values of the Naive Bayes classifier using 35 indices were 0,754, 0,006, 0,753, and 0,901 for TP Rate, FP Rate, F-Measure, and ROC Area, respectively. Although the TP rate decreases, the computational time of the method is improved because only 35 indices are calculated.
The CDA method reaches a ROC score of 0,918 using 72 indices, and 0,901 using 35 indices. SVM-PCD (Webb-Robertson et al., 2010), which is a method that also uses distributions of physicochemical properties reports a ROC score of 0,902 in SVM-PCD(531) and 0,906 in SVMPCD( 61). SVM-PCD(531) uses 531 indices and 18 values in each distribution, and thus, a total of 9558 values are calculated. SVM-PCD(61) uses only 61 indices and a total of 1098 values. The CDA method calculates 1440 values when 72 indices are used, and 700 values when 35 physicochemical properties are considered. Unlike SVM-PCD, the CDA method does not concatenate the values calculated to train an SVM. The CDA method uses 72 values to train a Naive Bayes classifier. The CDA method uses fewer values than the SVM-PCD method to make a classification. SVM-RQA (Yang et al., 2008) exhibits a ROC score of 0,912. It maps every amino acid to a numerical value using 480 physicochemical properties. The physicochemical properties are grouped into an embedding matrix, which is part of the recurrence quantification analysis. Finally, 10 values are extracted from each embedding matrix. A total of 4800 values are used to represent each protein. The CDA-method is comparable to SVM-RQA in accuracy and it uses fewer values to represent each protein. Both, the SVM-PCD and SVM-RQA methods, were tested on the same dataset that we used in the experiments.
4. CONCLUSIONS
In this paper, a new method for protein remote homology detection was proposed. It is called the CDA (Characteristic Distribution Analysis) method and is based on representing every protein sequence by a distribution of 20 values obtained from the physicochemical values of the amino acids. We proved the hypothesis that every SCOP family has a distribution that is typical for their sequences. The CDA method uses characteristic distributions to separate the sequences in each family from the rest of the proteins in a dataset. We found that there are physicochemical properties that discriminate better the sequences of a protein family. The alpha-helix propensity derived from designed sequences index, the atom-based hydrophobic moment, and the hydrophobic parameter achieved the best results for many families. In addition, a specific set of indices were found to be more suitable for each family. The CDA method achieves a TP rate of 0,793, a FP rate of 0,005, and a ROC score of 0,918. Reducing dimensionality also showed important results, a set of 35 indices achieved a TP rate 0,754, a FP of 0,006, and a ROC score of 0,901.
The CDA method requires fewer values to represent a protein than the SVM-PCD and SVM-RQA methods and presents comparable accuracy values. The CDA method might be improved by adding evolutionary information from frequency profiles. According to Liu et al. (2012), using a profile-based strategy increases the accuracy in remote homology detection methods.
REFERENCES
Bedoya, Oscar; Tischer, Irene (2014). Remote homology detection incorporating the context of physicochemical properties. Computers in Biology and Medicine, vol. 45, no. 1, pp. 43-50. ISSN: 0010-4825. [ Links ]
Chitraranjan, Charith; Alnemer, Loai; Al-Azzam, Omar; Salem, Saeed; Denton, Anne; Iqbal, Muhammad and Kianian, Shahryar (2011). Frequent Substring- Based Sequence Classification with an Ensemble of Support Vector Machines Trained using Reduced Amino Acid Alphabets. Machine Learning and Applications and Workshops (ICMLA), 2011 10th International Conference, vol. 2, no. 1, pp. 180-185. [ Links ]
Dong, Qi-Wen; Wang, Xiao-long; Lin, Lei (2006). Application of latent semantic analysis to protein remote homology detection. Bioinformatics vol. 22, no. 3, pp. 285-290. [ Links ]
Gao, Feng. Indexing methods for protein tertiary and predicted structures. PhD dissertation. 2006. [ Links ]
Goldstein, Richard and Qian, Bin (2004). Performance of an Iterated T-Hmm for Homology Detection. Bioinformatics, vol. 20, no. 14, pp. 2175-2180. [ Links ]
Grigoriev, Igor and Kim, Sung-Hou (1999). Detection of protein fold similarity based on correlation of amino acid properties. Proceedings of the National Academy of Sciences of the United States of America (PNAS), vol. 96, no. 25, pp. 14318-14323. [ Links ]
Hall, M., Frank, E., Holmes, G., Pfahringer, B., Reutemann, P. and Witten, I. The WEKA Data Mining Software: An update. SIGKDD Explorations, Vol. 11, Issue 1. 2009. [ Links ]
Homaeian, Leila; Kurgan, Lukasz; Ruan, Jishou; Cios, Krzysztof and Chen, Ke (2007). Prediction of protein secondary structure content for the twilight zone sequences. Proteins: Structure, Function, and Bioinformatics, vol. 69, no. 3, pp. 486-498. [ Links ]
Hou, Yuna; Hsu, Wynne; Lee, Mong Li and Bystroff, Christopher (2003). Efficient Remote Homology Detection Using Local Structure. Bioinformatics, vol. 19, no. 17, 2003, pp. 2294-2301. [ Links ]
Huang, Yao-ming and Bystroff, Christopher (2006). Improved pairwise alignments of proteins in the Twilight zone using local structure predictions. Bioinformatics, vol. 22, no. 4, pp. 413-422. [ Links ]
Jaakkola, Tommi; Diekhans, Mark and Haussler, David (2000) A discriminative framework for detecting remote protein homologies. Journal of Computational Biology, vol. 7, no. 1, pp. 95-114. [ Links ]
Kawashima, Shuichi; Pokarowski, Piotr; Pokarowska, Maria; Kolinski, Andrzej; Katayama, Toshiaki and Kanehisa, Minoru (2008). AAindex: amino acid index database, progress report 2008. Nucleic Acids Research, vol. 36, no. 1, pp. 202-205. [ Links ]
Liu, B., Wang, X., Chen, Q., Dong, Q., Lan, X. Using Amino Acid Physicochemical Distance Transformation for Fast Protein Remote Homology Detection. PLoS ONE 7(9): e46633. (2012). [ Links ]
Liao, Li and Noble, William (2003). Combining pairwise sequence similarity and support vector machines for detecting remote protein evolutionary and structural relationships. Journal of Computational Biology, vol 10, no. 6, pp. 857-868. [ Links ]
Muda, Hilmi; Saad, Puteh; Othman, Razib (2011). Remote protein homology detection and fold recognition using two-layer support vector machine classifiers. Computers in Biology and Medicine. vol. 41, no. 1, pp. 687-699. [ Links ]
Orengo, Christine and Taylor, Willie (1996): SSAP: sequential structure alignment program for protein structure comparison. Methods Enzymol vol. 266, no. 1, pp. 617-635. [ Links ]
Rabiner, L. and Biing-Hwang, J. An introduction to hidden Markov models. ASSP Magazine, IEEE 3.1 (1986): 4-16. [ Links ]
Webb-Robertson, Bobbie-Jo; Ratuiste, Kyle and Oehmen, Christopher (2010). Physicochemical property distributions for accurate and rapid pairwise protein homology detection. BMC Bioinformatics, vol. 11, no.1 pp. 145-183. [ Links ]
Yang, Yuchen; Tantoso, Erwin and Li, Kuo-Bin (2008). Remote protein homology detection using recurrence quantification analysis and amino acid physicochemical properties. Journal of Theoretical Biology, vol. 252, no. 1, pp. 145-154. [ Links ]


