


 Espanhol (pdf)
 Artigo em XML
 Referências do artigo
 Enviar este artigo por email
 Citado por SciELO
  Citado por Google
  Similares em
SciELO
Similares em
SciELO  Similares em Google
 Permalink
1. Introduction
Incipient faults in electrical machines can have a relatively small effect in the motor performance, but they can affect at long term its longevity, availability and reliability. Therefore, one of the major concerns in electrical machines research is fault detection and identification. Current signal analysis, as suggested by the MCSA (Motor Current Signature Analysis) technique is a non-intrusive fault detection and identification method with increasing popularity. The monitoring of certain features within the current signal both in time and frequency domain allows determining whether a given fault exists or develops in a specific motor component, given a baseline current signature.
The fault distribution percentage in induction motors, according to the fault type is (Thompson and Fenger, 2001): Stator related faults: 38%; rotor related faults: 10%; bearing related faults: 40% and other faults: 12%. These percentages justify the study of faults in stator windings, since they account for one of the most common fault types.
Some studies carried on industrial facilities show satisfying results regarding the fault detection and identification (Thompson and Fenger, 2003; Bouzida, et al., 2011; Dias and Chabu, 2014). On the other hand, it is important to mention that the success of the fault detection depends upon the correct selection of fault indicators, which should be independent from other abnormal conditions or harmonics and sub harmonics present in the current signal.
The fault symptoms in the frequency domain are modeled by theoretical approximations, using equations that relate the motor speed and construction characteristics (as number of pole pairs, number of cage bars, etc.) with frequency components that increase their energy once a certain fault starts developing (Nordin and Singh, 2014; Teotrakool et al., 2006; De Jesus et al., 2014; Bellini et al., 2006; Puche-Panadero et al., 2009).
1.1. Rotor's Broken Bars
(Thompson, 1994) describes the rotor's broken bar fault mechanism as consequence of high starting currents, which produce mechanical and thermal fatigue in the cage bars. In addition, heavy-duty cycles and long starting times increase the incidence of breakages in the bar-ring junction region. The model for this type of fault (See Equation 1) represents the fault related sidebands that appear once there is a broken bar fault:

Where fb is the sideband frequency, k = 1, 2, 3, ... and f0 is the motor supply current frequency.
1.2. Stator's Shorted Winding
This type of fault usually starts as a non-detected isolation loss between two winding turns and progressively, because of high temperatures, evolves into a short circuit, isolating a major number of winding turns (Awadallah and Morcos, 2004). Equation (2) corresponds to shorted winding fault model (Poncelas et al., 2008):
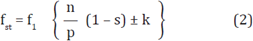
Where fst are the frequency values associated with shorted winding fault, f1 is the supply current frequency, p is the number of pole pairs, n = 1, 2, 3 ... k = 1, 3, 5 ... and s is the motor's slip.
2. Negative Sequence Component
The symmetric components method is a mathematical technique used to describe unbalanced power systems. For a three-phase system, the sequential components are described by Equation (3):
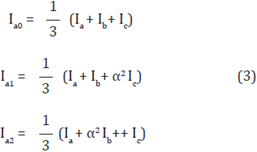
Where Ia0 , Ia1 , and Ia2 are the zero component, positive sequence component (PSC) and negative sequence component (NSC), Ia, Ib and Ic, are the phase currents and a is a phase rotation operator e j2π/3 or 120°.
A balanced three-phase system will only contain positive sequence component. The negative sequence component is the system's unbalance (or asymmetry) indicator. Finally, the zero component is a measurement of the current quantity that is not returning through the phase conductors (Bollen and Gu, 2006; Bouzid and Champenois, 2013).
It is important to mention the fact that asymmetries in an electrical machine can be present due to several reasons, including short circuit in the motor winding, inherent machine unbalances or instrumentation unbalances, mechanical load fluctuations or unbalanced supply sources. All of the above asymmetries will reflect in the machine's stator current, and consequently will affect the negative sequence current's mean value. For that reason, this current component has been used as a fault indicator in the analysis of shorted winding related faults. For example, in (Quiroga, 2010) it was demonstrated a consistent increase in the mean value of the negative sequence current in the presence of increasing shorted winding faults in an electrical machine, under several load conditions.
3. Support Vector Machines for bi-class classification
Support Vector Machines are supervised learning algorithms used to model a hyperplane in a multidimensional space to solve a given classification problem. Taking a linear classification problem with features x and classes y ε {-1, 1}, the parameters ω, b will be used to model the classifier as Equation (4) (Ng, 2013; Scholkopf and Smola, 2002):

Where g(z) = 1 if z ≥ 0 and g(z) = -1 otherwise. This notation allows dealing separately with the intercept term, b. The vector ω is then in the form (θ1 ... θn)T.
Functional and Geometric Margin
Given a training example (x(i), y(i)), the functional margin of (ω, b), regarding the training example can be written as:

If y(i) = 1, then the classifier prediction is reliable and correct if ωTx + b is a large, positive number (it is required that the functional margin is large enough). In the same way, if y(i) = -1, it is required ωTx + b to be a large, negative number. In this way, if y(i) (ωTx + b) > 0, then the prediction in the example i will be correct. Therefore, a large functional margin represents a reliable classifier.
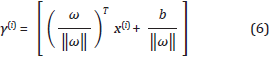
On the other hand, the geometric margin can be interpreted as the distance from a given training example to the decision boundary and it can be defined by Equation (6) (Ng, 2013):
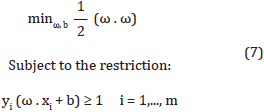
In order to find the optimum separating hyperplane it is necessary to maximize the margin (maximizing the margin implies increasing the classifier generalization capability) by solving (7) (Scholkopf and Smola, 2002):
When used in solving maximum and minimum problems, the Lagrange multipliers (with αi ≥ 0) convert the restricted problem into the minimization of the Lagrangian L, the dual representation of L in Equation (8):
Once the solution is found, training points with αi ≠ 0 will be the support vectors, which are the base of the class separation model.
In case that the example data are not linearly separable, it is possible to transform the data set into a new dimensional space, where the data can be linearly separable. For that purpose, a transformation or mapping function ϕ( . ) is defined in terms of the scalar product of the scalar product in the original classifying space. Thus, instead of specifying the transformation function, a Kernel function K(u • v) is specified. A Kernel function performs the space transformation and the scalar product in a single step, which is a relevant fact, since the calculations in SVM are expressed in terms of dot products. Therefore, in order to solve a higher dimension problem dot products are obtained as the result of kernel functions. The most popular kernel functions are Radial Basis Function (RBF) and polynomial function, expressed by Equation (9) and Equation (10), respectively, for vectors x and y (Ng, 2013):
Where o, in Equation (9), is a parameter that controls the decay rate for the kernel function as x moves away from y. On the other hand, the polynomial degree n and the sum constant ß must be specified for polynomial function in Equation (10).
It can be stated that the appropriate use of a Kernel function allows using the same algorithms used for solving the problem stated in Equation (8) when solving a non-linear classification problem.
In addition, when elements belonging to different classes are mixed, a strategy called soft margin is commonly used. This technique allows a relaxation in the optimization conditions. The soft margin strategy includes, among other variables, parameter C, which is an error penalty related to the margin. The larger the constant C, the smaller the margin is and as a consequence of that, the training error becomes smaller as well. However, for this particular application, it is more desirable to have a rather small value of C because it increases the margin width and consequently, the algorithm's generalization capability.
4. Experimental setup
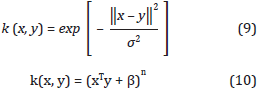
The test bed used in this work consists of a set of 2 HP induction motors, 440/220V, 4 pole, 22 rotor bars, 1800 rpm, and 60 Hz. Figure 1 shows a photo of the test bed components. It can be observed that the motor load conditions (75% and 85% of the nominal current) were obtained using a coupled 220 V.D.C. shunt generator connected to a resistive variable load.
The data acquisition system was implemented using Matlab/ Simulink® with WinDaq software as an interface to the data aquisition hardware. A DI-730 data acquisition system from DataQ® is used to record and display the three line currents at 5 KHz. The current transducers consisted of three 50mA to 120A AC/150A DC Hall Effect probes from the same manufacturer. Because the fault detection scheme using MCSA relies on the current's frequency information, an appropriate power spectral algorithm should be used to reliably identify the feature associated with the fault. The Welch power spectral density was used for that purpose because it provides a substantial noise reduction, facilitating the fault-associated feature recognition.
4.1. Fault emulation and data acquisition
To emulate shorted winding fault, the stator windings of the induction motor were reconstructed. The windings in one motor phase were equipped with several accessible taps so that a stator winding short type fault with varying severity could be introduced, emulating 2%, 5% and 10% shorted turns, corresponding to incipient, moderate and severe faults, respectively. Finally, the data were analyzed in time and frequency domain according to the motor current signature analysis technique.
To emulate broken bars condition, the rotor's bars were drilled progressively until the bar material was completely worn out but the discontinuity of the bar is guaranteed. The severity level is determined by the number of drilled bars. Thus, three severity levels are induced, corresponding to 1, 2, and 3 broken bars. The same induced levels are labeled incipient, moderate and severe broken bar fault, respectively.
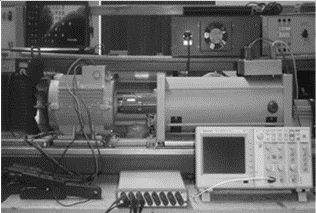
Finally, since the determination of the fault severity is based on the isolation of a given fault, the architecture proposed in this work to determine the type and severity of the fault is shown in Figure 2. It is important to mention that the features used in the severity estimation for shorted winding fault were different from those used in broken bars severity estimation. The blocks observed in Figure 2 correspond to bi-class classifiers; the classification method used was one versus one because a certain set of features allowed correct classifying of the data with acceptable error margin for each case.
4.2. Current signature analysis
The tests carried on using the test bed with shorted winding fault demonstrated that the frequency domain components that were selected as indicators are independent from any other fault related frequency components. Additionally, the experiments showed the frequency components are only suitable indicators under low load condition. Thus, the MCSA technique is degraded by the increment of the load in the motor affecting the amplitude of the selected frequency domain fault indicator. Moreover, the frequencies associated with this type of fault depend on the motor particular operation conditions.
The NSC (negative sequence current) monitoring technique was also studied in dept. This method showed a reliable sensitivity when increasing the shorted winding severity, under several load conditions. Previous tests allowed concluding that there is a consistent increase in the NSC indicator when the load is coupled to the motor (Oviedo et al., 2014), i.e. the baseline for healthy condition depends on the load regime. Further details about the use of the NSC as a motor fault indicator using the same test bed can be found in (Oviedo et al., 2011).
In order to overcome the dependency of NSC magnitude with load regime, the use of the PSC/ NSC ratio is proposed as a fault indicator. As it was stated, the negative sequence current is widely known as unbalance indicator which is sensitive to the addition of load. In the same manner, the value of the positive sequence current (PSC) magnitude increases proportionally with the addition of load. Therefore, the load effect can be attenuated with the use of PSC/NCS ratio. Additionally, in order to guarantee a reliable and robust fault detection, power quality must be guaranteed in the motor supply network since the negative sequence current indicator is produced by unbalances, not all caused by stator shorted windings.
On the other hand, tests carried out with broken bar fault lead to the conclusion that it is possible to perform reliable monitoring of rotor bars condition using MCSA. As stated by Equation (1), there will exist frequency components with increasing power surrounding the supply frequency due to the fault condition. Moreover, when load is added the motor slip s increases and thus, the faulty frequency component (sidebands) move away from the supply frequency, facilitating the identification of the fault and its severity. Figure 3 presents the PSD magnitude change in the 54,7 Hz sideband when increasing fault severity at a 85% load.
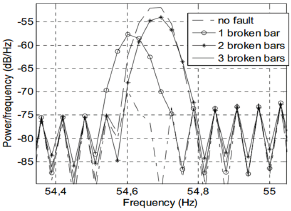
However, the increase of mechanical load when there is a broken bar condition leads to the development of sidebands around certain frequencies related to other motor faults like air gap eccentricity. Due to the previous fact, only the sidebands in the 56-66 Hz range were considered as a reliable range for broken bar fault detection in frequency domain. Further details about current signature analysis for broken bars detection using the same test bed can be seen in (Oviedo et al., 2011).
4.3. Feature extraction and feature selection
With the aim of classifying motor faults, a set of representative features must be chosen and those features should appropriately represent the current signature (Ghate and Dudul, 2009). As it was previously established, the MCSA (Motor Current Signature Analysis) technique allows identifying the frequency components with increasing energy as a fault consequence. Most common faults in previous studies include shorted winding, bearing defects, air gap eccentricity, broken bars, with outstanding results regarding broken bars detection using the power spectral density (Penrose, 2004).
On the other hand, time domain features are mostly statistical features that can be interpreted in terms of the data histogram (Theodoridis and Koutroumbas, 2009). For instance, skewness is a histogram symmetry indicator while kurtosis is a measurement of how sharp is the histogram
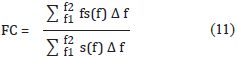
distribution; entropy is a measure of the histogram uniformity, therefore, the closer the histogram values are to each other, the higher the entropy value is. The crest factor is the signal peak amplitude divided by rms value. The purpose of using crest factor as a feature is to give an indication of how much certain abnormal condition is affecting the machine signals with spikes. Those impacts are associated with faults in motors and rotating machinery (Ghate and Dudul, 2011). Other time domain features are mean and variance, which depending upon the type of fault, can be successful features for discriminating abnormal conditions. Furthermore, among the frequency features useful to describe changes in the spectrum of a given signal. The frequency center is calculated as the mass center of the spectrum s(f) regarding the fundamental frequency between frequency f1 and frequency f2, using sum intervals Δf. A variation in the center frequency is usually related to mechanical or electrical faults in the rotating machine and is commonly used in vibration analysis. The frequency center is calculated according Equation (11) (Deraemaeker, 2006).
In general, previous works in the same field allow establishing the initial set of features for the classification performed in this work (using machine learning methods). In (Ghate and Dudul, 2009), for example, the statistical features used include rms value, kurtosis and skewness maximum and minimum values. In (Gordi and Roshanferk, 2010) the area under the curve of power spectral density of fault related sidebands and harmonics and the amplitude of the PSD using FFT were proposed as the most important features. Finally, in (Widodo et al., 2007) a SVM based fault classification system was elaborated using vibration and current signals. For that end, the selected features were crest factor, entropy, rms value, central frequency, skewness and arithmetic mean, among others. The initial set of parameter for this work were established based on previous works, but also on the results of motor current signature analysis studies carried on.
Feature selection consists on reducing the initial feature set dimension with the aim of reducing complexity and to avoid overfitting. To this end, it is common to check individual features using statistical tools like t-test of fisher discriminant ratio. In this work, the features discrimination capability was assessed using t-test (p=0.05). This test provides an indication of which features should be kept and which ones should be discarded, especially if the classification is made up using several bi-class classifiers, as in this case.
For the broken bars severity, the selected features in time domain were:
Arithmetic mean
Crest factor
PSC/NSC, proposed by the authors, is the positive sequence current- negative sequence current ratio in order to normalize the current signal.
Kurtosis
Skewness, indicates the symmetry of the histogram distribution.
rms, root mean square.
Entropy, which is a measure of the histogram's uniformity. That means that the more alike the histogram values are the higher entropy value is for that particular distribution.
On the other hand, the frequency domain features where:
Central Frequency is a feature that allows determining the power spectral density cumulated area center, between two frequency limits. In the broken bars case, these frequencies were 55.98 Hz and 65.91 Hz. In the case of shorted winding fault, those limits were 534.97 Hz and 545.04 Hz. Both calculations were made using Δf = 0.1526 Hz.
rms of Power Spectral Density (PSD), which gives an indication of the magnitude level of the power distribution. When a faulty condition appears, there will be particular spectral components with higher power.
For shorted winding fault severity classifier the selected features were PSC/NSC ratio and rms value of Power Spectral Density using the t-test method for all possible fault severity bi-class scenarios (e.g. 2% shorted winding fault vs. 5% shorted winding fault and so on). The features with the majority of success outputs were chosen.
5. Results and Analysis
5.1. Fault classification
This section describes the fault classification method and the results of using John Platt's SMO (Sequential Minimal Optimization) function, adapted by Michael Mavroforakis for bi-class classification problems (Theodoridis, 2010). Some of the inputs were Matrix X, containing the input data set; vector Y that contains the class labels (1 and -1); Tol is a scalar that controls the algorithm's precision. Once this number is reached, the algorithm stops if it has not surpassed the step condition yet. Meanwhile, the output parameters are: 1) The vector with the estimated Lagrange multipliers, Alpha 2) The intercept term, b 3) The separating hyperplane normal vector, w (only makes sense when using a linear separator) 4) The number of times the norm is evaluated in the algorithm, evals 5) The number of steps until convergence, stp.
In addition, the training error is calculated as the ratio between the number of data outside the correct side of the classifier during the training (including those on the correct side, but inside the margin) and the total samples. Likewise, the validation error is the ratio between the number of samples outside the correct side of the classifier during the validation (including those on the correct side, but inside the margin) and the total samples ratio. The penalty constant C and kernel parameters were modified systematically and observing the training success percentage. As previously stated, error counting is based on the samples outside the correct class (including those points in the correct class, but inside the margin). When a non-linear classifier was required in the proposed classifying architecture the best results (in terms of convergence and error) were obtained using the Radial Basis Function Kernel, also known as Gaussian Kernel, expressed for vectors x and y by Equation (9).
In order to exploit the original data set in the training and validation procedures a random set of 50% of the data set was used in the training algorithm and the rest in the validation algorithm. Then, the data were crossed and the algorithm performance is assessed averaging the two results of the algorithms, in terms of error and support vectors. Two folds were used in order to establish a tradeoff between the generalization capability of each classifier and the limited training data. It is important to mention that in this work, the induced levels of shorted windings were labeled according to a specific severity level. Thus, 2% of shorted winding corresponds to an incipient fault; 5% shorted winding correspond to a moderate fault. Finally, 10% shorted winding corresponds to a severe fault. The same labeling scheme was used for broken bar fault severity classification; 1 broken bar corresponds to incipient fault, 2 broken bars corresponds to moderate fault and 3 broken bars corresponds to severe fault.
5.2. Fault type Classification
This type of classifier determines the class to which a given datum belongs. The classifier consists in three learning machines that classify data into one of three possible classes: 1) Healthy motor 2) Shorted winding motor or 3) Broken bars motor.
Healthy motor- broken bars motor classification
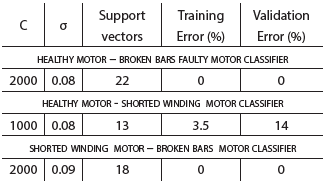
This bi-class machine works using Mean, PSC/NSC, Central Frequency and the RMS of Power Spectral Density as features. The SVM training exercises showed the performance stated in Table 1 . As stated before, the results are measured using training error, test error (or validation error) and the support vector count.
Healthy motor - shorted winding motor classification
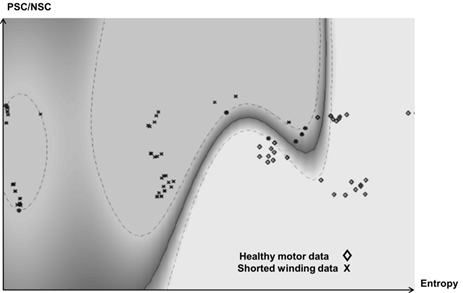
This bi-class machine works using Entropy and PSC/NSC as features. The training and validation results are displayed in Table 1. As stated before, the results are measured using training error, test error (or validation error) and the support vector count. The machine training and validation can be observed in a two dimensional graphic which depending upon features observed, can give a performance indication. Figure 4, shows the machine response with Entropy (abscissa) and PSC/NSC (ordinate) as features.
Shorted winding motor - broken bar classification
This bi-class machine works using mean, PSC/ NSC, central frequency and power spectral density RMS value as features. The training and validation performance results are showed in Table 1.
5.3. Fault severity classification
According to the fault classifier architecture proposed in this work, once the fault type is identified, it must be determined whether the fault is incipient, moderate or severe, depending on the established severity levels for the induced faults. The addition of load makes it difficult to identify the severity level because data form separated clusters depending upon the load regime. Sometimes these clusters are closer to other data corresponding to another severity level, so the learning machine must be flexible enough to classify well.
Shorted winding severity classifier
This classification task was achieved using three support vector machines that classify data into one of three possibilities: 1) incipient short circuit fault 2) moderate short circuit fault, 3) severe short circuit fault. This classifier uses PSC/NSC ratio and Power Spectral Density RMS value in all machines.
Incipient short fault- moderate short fault machine
Table 2 shows the training constants used in this machine and the performance parameters SV (support vectors), training error and validation error.
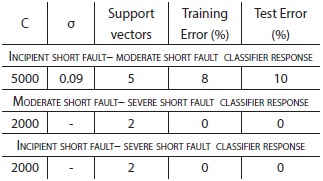
Moderate short fault- severe short fault machine and Incipient short fault- severe short fault machine
Table 2 shows the training constants used in both bi-class machines and the performance parameters SV (support vectors), training error and validation error. Both are linear machines, and the scalar product did not require a kernel function.
Broken bars severity classifier
This classifier uses three support vector machines that classify data into one of three possibilities: 1) incipient broken bars fault, 2) moderate broken bars fault, 3) severe broken bars fault. This classifier uses Crest factor, Mean, Entropy and PSC/NSC ratio as features.
Incipient broken bars- moderate broken bars machine
This bi-class machine works using Arithmetic mean, and Crest Factor as features. The experiments using those features when training a SVM showed the performance enounced in Table 3.
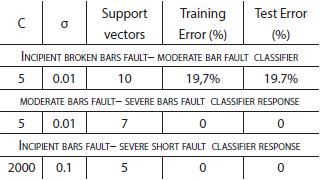
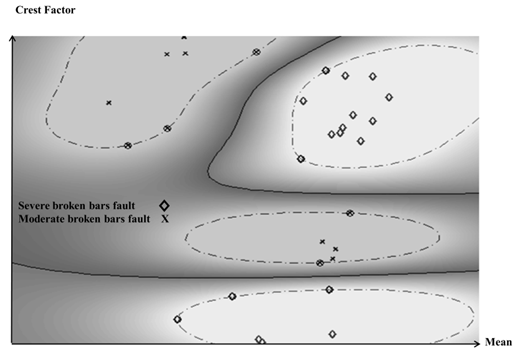
Moderate broken bars- Severe broken bars machine
This machine also uses Mean, and Crest factor as features (see Table 3). The machine response in a two dimensional graphic is showed in Figure 5 with Mean (abscissa) and Crest factor (ordinate) as features.
Incipient broken bars- severe broken bars machine
This bi-class machine works using Arithmetic Mean, PSC/NSC, Crest Factor and Entropy as features. The experiments using those features when training a SVM showed the performance enounced in Table 3. These results show that even though broken bars are mechanical faults, it is feasible to use the proposed feature (PSC/NSC ratio) to determine the severity of this type of fault in several load scenarios, since this feature reflects in a very reliable way the asymmetries in the stator current when bar breakage is present.
The above results demonstrate that, combining MCSA technique and time domain features is a reliable way to detect and identify faults in induction motors. Whereas MCSA allows predicting faulty components in the current power spectral density, time domain features like Crest factor allow measuring unbalances directly from the waveform, which is useful for fault isolation purposes.
Finally, it can be stated that the PSC/NSC ratio performed well for both identification of the type of fault and severity estimation. This ratio allows normalizing the current signal in the presence of load and therefore makes it possible to adapt classifiers.
6. Conclusions
This work aimed to study the use of a new stator current feature for detection of winding and cage bars faults in a 2 HP, 3 phase induction motor, and the experimental validation of a detection and identification scheme, as well as the extraction and selection of the most reliable set of current signal features for this particular scenario.
The Positive Sequence Current/Negative Sequence Current (PSC/NSC) ratio and the central frequency showed satisfying results in fault type detection and fault severity identification. The main contributions of this study are the results for the PSC/NSC ratio, since it performs successfully with the addition of load. The influence of the motor's load regime on the behavior of the features associated to Motor Current Signature Analysis can jeopardize the classification process. Nevertheless, frequency-related features such as central frequency and RMS value of Power Spectral Density can be used in some dedicated learning machines with satisfying results.

