


 English (pdf)
 Article in xml format
 Article references
 Send this article by e-mail
 Cited by SciELO
  Cited by Google
  Similars in
SciELO
Similars in
SciELO  Similars in Google
 Permalink
1. Introduction
Warehousing is the process in charge of holding inventory to satisfy customer orders in a short time, handle and store items, consolidate products, customize orders, offer added-value service, among others (Frazelle, 2002b). Warehouses are a key aspect of the operations that make part of the supply chain because they contribute to the synchronization of these operations. Additionally, considering the importance of warehouses, companies invest many resources such as space, workforce, equipment, among others. This amount of resources is represented on the logistics operation cost. For example, in Colombia, logistics costs represent on average 13.5\% of the total sales, where warehousing is 46.5\% of the total logistics cost, which makes it the most representative cost (Andres, 2018).
Different kinds of decisions are made inside the warehousing process and they can be classified as: strategical, tactical, and operational. Strategical decisions define the planning of resources for long term, and most of the time, they require a high investment. For instance, acquisition of new technology for improving the picking process. Tactical decisions affect the operations in the medium term and are mostly based on the strategical decisions (Rouwenhorst et al., 2000). For example, implementation of different policies such as routing or storage location assignment. Finally, operational decisions impact the operations in the short-term and they are responsible for the daily executed operations. In this way, the decisions at this level should consider the constraints given by the tactical and strategical levels. Some examples of daily decisions in warehousing processes are workforce allocation and job assignment (Van Gils et al., 2018).
Before the warehouse managers make decisions about the processes inside the warehouse, it is necessary that they assess the operations for understanding the complexity of the system (Bartholdi and Hackman, 2008). These assessments allow identifying issues around material and information flow. In most of the cases, these assessments are called activity profiling. Warehouse activity profiling is the systematic analysis and statistical measurement of processes, items, and customer orders. Indeed, profiling reveals opportunities for improvement that are not easy to detect with a simple inspection, it also provides a baseline for justifying investments, and motivates objective decision making (Frazelle, 2002a). In literature, there are different ways for profiling, which depend on the decisions that the managers want to make. For example, customer's order profile, item activity profile, purchase order profile, and inventory profile (Park, 2011). One of the most common ways of profiling is analyzing the customer's order data, which provides the customer's order profile. Analyzing the customer's order profile allows finding a set of characteristics that identify the type of orders. Some examples of decisions that can be made with the information provided by the customers' orders are: the best storage location for the items, the workload in each shift, the number of staff required, and the necessary systems for completing the orders.
The purpose of this paper is to present an approach for profiling activities inside a warehouse based on the customer's order history. In this work, we analyze the characteristics of the orders in terms of the number of lines per order and the order affinity. The number of lines per order is the set of references required in a customer order. Order affinity represents how similar the orders are depending on the items that these share. For estimating this indicator, we present a new procedure. Additionally, our profiling approach uses cluster analysis for grouping sets of orders with similar characteristics. In this context, the aim of the cluster analysis is to identify the different kinds of orders and their characteristics. For evaluating this approach, we collected the data for a real operation from the distribution center of a retail company. After applying our approach, we identified four different profiles, which can support different kinds of decisions in the warehousing activity. Some of the decisions are the use of batches for completing the orders, the definition of work zones for retrieving the products, or the evaluation of different material handling equipment. Although our approach was tested using information from a retail company, it is possible to extend the approach to other companies as long as these companies provide the customer's order history data.
2. Literature review
Literature provides different approaches for profiling activities. Normally, these approaches are either qualitative, or in other cases, statistical analyses. The selection of either one of them depends on the decisions to be made in the warehouse.
Some authors present different ways of developing general profiles. For example, Frazelle (2002b) presents different kinds of profiles which are based on analyses from descriptive statistics. Thus, the results summarize the characteristics and describe the behavior of the process parameters. Another example, introduced by Bartholdi and Hackman (2008), presents other types of profiles that use data mining and statistical analysis for looking for patterns in the data sources from a warehouse. As a result, they obtain a non-biased view of the operations in a warehouse.
In most of the cases from warehouse activity profile literature, the main data source for profiling is the customer's order data, which provides all the information about the work developed in the warehouse. The data source for this study is also the customer's order data because our interest is to characterize the customers' orders.
Hereafter, we present some authors that use the customer's order data for profiling and making decisions in the warehousing activity. Accorsi et al. (2014) develop a decision support system for making decisions about the storage capacity, available storage space, and the appropriate locations for each item. All decisions are based on the behavior of customer's order history data. In another work, Baker et al. (2009) present a framework where they analyze the customer's order data for establishing the requirements for making decisions about the design of warehouses. Agrawal et al. (1993) evaluate the customer habits and they found associations and patterns between items that customers usually buy together. For improving the assignment of the storage location of the items in a warehouse, Chuang et al. (2012) and Yener et al. (2019) find patterns in the customers' orders. Finally, for improving the order picking activity, Chen et al. (2005) form batches of orders that have similar items using the association rules for minimizing the travel time.
Although there are different kinds of works that focus on activity profiling for making decisions, in most of them, the profiles are relative to particular decision-making. In contrast, this work presents a standard approach for developing a profile, which can be extended to different types of decisions. To do so, our study analyzes the number of lines and the order affinity. With this, we provide a quantitative analysis of the work that was executed for fulfilling the customers' orders.
3. Profiling Methodology
For characterizing the customers' orders, we developed our own methodology. In Figure 1, we present the general framework of the methodology. The input is a set of customer's order history. This data set is composed by the ID of each order, the picking date of the order, an ID of the required items, and the quantity for each item. We grouped these orders temporarily by the day when the orders were picked, this is a natural grouping that represents the operation as it is executed. After processing the input data, for each set of orders in a day, we performed step one. Here, we estimated two indicators, lines per order and order affinity. The following sections contains the description of both indicators for describing the behavior of the orders. After the characterization was done, step two grouped the days with similar characteristics using a cluster analysis based on the identification of patterns. Finally, the methodology produced a set of clusters, where each cluster represented a set of days in which orders had similar behaviors. At the end, each cluster was characterized in terms of the number of lines and order affinity.
3.1. Characterization
As mentioned above, the characterization step estimates some indicators of a set of orders which were picked on the same day. According to (Goetschalckx and Ashayeri, 1989; Hsieh and Tsai, 2006; De Koster, Le-Duc and Roodbergen, 2007; Chackelson, Errasti and Tanco, 2011; Errasti et al., 2011) the most important indicators that need to be considered are the number of lines per order, and the affinity between orders. For this reason, we will use these indicators, which are explained below.
3.1.1. Lines per order
An order is a set of lines, where each line represents a reference required by the customer. In most cases, a line indicates a location to visit where the item is stored. In consequence, the number of lines per order is an indicator of the workload in the warehouse.
Starting with a set of orders from the same day, we estimated the maximum, the average, and the minimum of the number of lines. The average indicator was used because this value represents the central tendency of the number of lines in the set. On the other hand, the maximum and the minimum indicators were used because they allow seeing the range of lines between the orders from the same day. Then, considering that the input customer's order history data contains the orders from days, we estimate the above mentioned indicators for each day.
3.1.2. Order affinity
In this work, we defined the order affinity based on the similarity between the items contained in a set of orders grouped into a specific period of time (e.g. one day).
Here, we describe the mathematical formulation for calculating the order affinity indicator of a set of orders. This formulation considers frequent pattern mining, which leads to the discovery of association and correlations among items in large data sets (Han, Pei and Kamber, 2011). Specifically, we use the occurrence frequency of an item-set, which is the number of orders that contain a set of items, in our case the item-set is a pair of items. The result of the occurrence frequency between items is an item-versus-item matrix, such as the matrix shown in Figure 4.
Most of the authors found in literature use the item-versus-item matrix to identify patterns between item-sets. However, in our case, the matrix was not clear enough for identifying the level of affinity into the set of orders. For this reason, we needed to transform the matrix into a scalar value for identifying the level of affinity between orders. In this work, we present a methodology for transforming the matrix into a scalar value for representing the affinity.
3.1.2.1. Mathematical formulation of the order affinity indicator
Let 0 be the set of orders from a particular day. Additionally, let R be the set of items sorted by importance. This order of importance is defined by the number of times that an item appears in the set of orders 0. Each item i ∈ R has a weight of importance, defined as αi, where Σi∈R αi=1. We computed αi as the number of lines for each item in 0 divided by the total lines of the set of orders in 0. From the order o 6 0 a binary parameter roi, is known, which is equal to 1 if the order has the item i ∈ R or 0 otherwise.
Using the binary parameter, we can estimate the item frequency matrix. This matrix is defined as Aij = Σo∈O roi × roj ∀ i and j ∈ R: i≠j. Note that matrix A ij indicates the number of times where item i ∈ R and item j ∈ R appear together in an order.
After the matrix is built, we need to transform it into a scalar value. With this objective in mind, we initially calculate, for each item i ∈ R, the total number of times where i is together with other items in the set of orders. This is defined as ti = £j6R Aij . Subsequently, we calculate the weighted average from ti in which each item is paired with an another item defined as p = Σi∈R αi × ti . We define as the absolute indicator of affinity, which is interpreted as the average of the number of times in which two items are paired in the set of orders 0. In order to transform this indicator into a relative indicator, p is divided by the maximum value of the affinity that could be present in the set. Therefore, the relative indicator of affinity is defined as
Equation 1. Relative indicator of affinity.
Where (|R|-1)x|0|, is the best of the cases in which all the items appear in all the orders.
3.1.2.2. Illustrative example
With the aim of clarifying for the reader the calculations of the order affinity indicator, we present an illustrative example. Consider the set of orders shown in Figure 2.
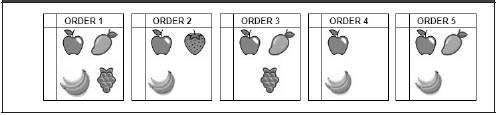
Additionally, consider the set of items R, sorted by importance as shown in Figure 3. The number below each item represents its weight of importance; these are computed as explained in Section 3.1.2.1.
Now, using the binary parameter roi, we can estimate the matrix A of the frequency of occurrence of a pair of items, shown in Figure 4.
Figure 4 Matrix A for illustrative example. The frequency occurrence, factors (ti, ai, and ti x ai), and absolute indicator
Once the matrix is built, the next step is to transform the matrix into a scalar value. In Figure 4, we show the process for calculating ti and p.
Knowing the value of p, 0, and R, we calculate f using Equation 1.
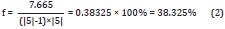
After applying Equation 1, we can see that the set of orders from Figure 2 has a 38.325% of affinity. This means that the orders do not share many pairs of items.
3.2. Grouping by characteristics
Once the orders are grouped into days and the set of orders is characterized using lines per order and order affinity, the last step in the methodology is to group the days with similar characteristics for determining the profiles inside the warehouse. By performing a cluster analysis, we can create these groups.
Cluster analysis is defined as the process of partitioning a set of observations into subsets. Each observation must have similar characteristics to other observations from the same subset, but different subsets, observations must have different characteristics. In this way, clustering allows us to find unknown groups within a data set (Han, Pei and Kamber, 2011). Moreover, applying cluster analysis helps us to identify the different groups where days have similar characteristics in order to obtain the profiles of the customer's order data history.
Cluster analysis provides a set of groups containing the different profiles of the warehouse based on the number of lines per order and the order affinity. This information should lead us to identifying opportunities in the process and justifying future changes or investments. Furthermore, the information provide by the groups can serve as a baseline to make decisions that improve the operations inside a warehouse. One of these decisions could be the adequate selection of the order picking systems for each type of profile.
4. Case of study
In this section, we present an application of the proposed approach for profiling warehousing activity using customer's order data history from a retail company. The company has one distribution channel in charge of distributing to department stores and specialty shops. Currently, for satisfying the customer's orders from this channel, the company has a traditional Order Picking System (OPS) in their warehouse. In this OPS the pickers travel around the picking zone retrieving products from different storage locations.
Recently, the company has started to plan its future investments, and they want to know if it is necessary to consider some investment for its OPS. Before taking into consideration the investment, the company needs to evaluate which OPS has the best performance according to the behavior of their customer's order data history. For evaluating the different OPSs, it is necessary for the company to identify the different profiles that they have in their operation. Depending on the profiles, the implementation of one OPS can either have a good or bad impact on the productivity. For this reason, the first step in the evaluation of a new OPS is the identification of the profiles as well as the characteristics of the customer's orders.
The company provided the customer's order data for 12 months of activity in the warehouse, with a total of 331 operation days. The data contained 146,540 orders with a total of2,349,954 lines, requested by 1,110 clients with a total of 4,550 unique products.
As we mentioned in the last section, for profiling the customers' database, we calculate the maximum number of lines per order, the average of the number of lines per order, the minimum numbers of lines per order, and the order affinity indicator for each day. For analyzing the result of the indicators, we constructed a frequency histogram for each indicator. With the information from the frequency histogram, we had a first insight into the results. These histograms are shown in Figure 5.
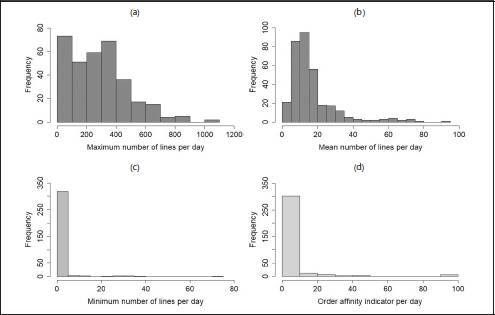
It is important to notice that in Figure 5, the indicator with more variability in its occurrence frequency is the maximum number of lines per day, as shown in Figure 5(a). From this figure, we can identify that 76.13% of the days have a maximum number of lines per order between 3 and 400 lines, and only 0.6% of the days have a maximum number of lines between 1,000 and 1,100 lines (i.e., there is an asymmetry behavior in the maximum number of lines per day). Additionally, analyzing the customer's orders, we find that 0.6% of the days with a large number of lines correspond to orders made by the most representative client.
In Figure 5(b), we can identify that 71.6% of the days have an average number of lines between 5 and 20 lines. This histogram also has a right asymmetry with dispersion from 20 lines to 95 lines. This large range for the dispersion can be related to the days that have a large maximum number of lines per day.
In Figure 5(c), we can see that 96.07% of the days have a minimum number of lines per day between 1 to 5 lines. Analyzing the other 3.92% of the days, we find that on these days the company completes between one and three orders per day. These is explained by the fact that these orders have a large number of lines. However, this seldom happen.
In Figure 5(d), we can identify that 90.93% of the days have an order affinity indicator between 0.05% and 10%, this could indicate that the orders do not have a strong affinity in this company (i.e., the orders do not share many references). Additionally, this histogram shows that 1.81% of the days have a strong order affinity. This behavior could be related to the days with orders that have more than five lines (i.e., more than five items), which are the days when the company only consolidates between one and three orders per day.
Once the days are characterized, we proceeded to apply the grouping by characteristics step. For this process, we used the TwoStep Cluster Analysis, which is a tool designed for identifying groups within a data-set that are not apparent. This cluster analysis is different from others because it determines the optimal number of cluster using the Bayesian information criterion (SPSS, 2001). For applying the TwoStep Cluster Analysis, we used the IBM SPSS software (version 25). Continuing with the application of this approach and having the characteristics of the number of lines (maximum, average, and minimum) as well as the order affinity, we evaluated the different groups that the TwoStep Cluster Analysis formed.
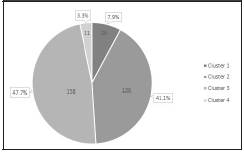
After running TwoStep Cluster Analysis, we obtained four clusters. This means that we found four profiles in the warehousing operation. In Figure 6, we present the size of each cluster. The smallest cluster has 11 days representing 3.3% of the days, and the largest cluster has 158 days representing 47.7% of the days.
In Figure 7, we can see the relevance that each characteristics has when the clusters are grouped (i.e., a larger number indicates more relevance). For grouping each day into a cluster, the most relevant characteristic was the maximum number of lines, followed by the order affinity indicator. This means that the clusters were mainly grouped after these two characteristics. Additionally, we found that the average of the number of lines and the minimum number of lines had a lower contribution for assigning the days into the form clusters.
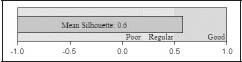
For assessing the quality of the clusters, we evaluate the silhouette coefficient, which is defined as the measure that evaluates the cohesion between the observations of each cluster and the separation between the observations of the different clusters. The silhouette coefficient takes values from -1 to 1, where a value of -1 indicates a poor grouping of the observations, while a value of 1 indicates an excellent grouping of the observations (Han, Pei and Kamber, 2011). Figure 8 presents a 0.6 value for the silhouette coefficient for our clusters. This means that we have a good relationship between cohesion and separation of the grouped observations.
Once the quality of the clusters was admissible, we evaluated the characteristics of the cluster. For this evaluation, we assessed the centroid, which represents the center of mass of each cluster. The centroid of each cluster is presented in Table 1.
TABLE 1 CENTROID FOR EACH CLUSTER
| Cluster | Observations | Maximum number of lines | Minimum number of lines | Average number of lines | Order affinity indicator |
| 1 | 26 | 653.31 | 1.12 | 51.16 | 4.88 |
| 2 | 136 | 404.81 | 1.00 | 15.88 | 0.64 |
| 3 | 158 | 132.10 | 1.22 | 10.80 | 3.52 |
| 4 | 11 | 48.27 | 25.73 | 36.41 | 70.42 |
From Table 1, we can infer that cluster 4 grouped the days that have a higher order affinity indicator. These days were characterized for completing between one and three orders, which had a high quantity of items. In this cluster, Tuesday represented 91% of the days. After analyzing the information of the company, we found that these days have a special behavior because, on Tuesdays, they process the orders from an important client. Additionally, clusters 1 and 3 are mainly differentiated by the values of the maximum and the average of the number of lines. These differences explain the behavior of the order affinity indicators. Since cluster 1 has higher values for the maximum and the average number of lines, the order affinity indicator is greater than the order affinity indicator of cluster 3. On the other hand, cluster 2 has the lowest value of the order affinity indicator. We analyzed the behavior of this cluster and we found it has the days where the company completed the orders from the largest amount of clients. We also found that these orders were very diversified (i.e., the orders share a small number of pairs of items).
Applying this approach for profiling the warehousing activity, we conclude that the company has four customer's order profiles. These profiles are differentiated by the characteristics of the number of lines and the order affinity indicator. Considering that the performance of the OPS depends on the number of lines per day and the order affinity, the company could evaluate the different OPSs for each profile with the intention to select the OPS that has the best performance for all the profiles that were found. Additionally, the information from this approach could help the company in the evaluation process for other decision, for example, the acquisition of material handling equipment and the slotting of the items.
5. Conclusions
In this study, we present an approach for profiling the warehousing activity based on the customer's orders. The approach is comprised of two-steps for analyzing the customer's order data history. In the first step, we characterize the customer's order data history evaluating the number of lines per day and the order affinity indicator per day. For this step, we present a novel procedure when computing the order affinity indicator, which uses the occurrence frequency of a pair of items in the set of orders. In the second step, we group the days with similar characteristics (using cluster analysis techniques) to identify the profiles of the process. The result of the second step is a set of clusters, where each cluster represents a different profile in the customer's order data history. The profiles provide a quantitative analysis of the work executed for completing the customer's orders. For this reason, the profiles could serve as a baseline to make decisions to improve the processes.
For validating the approach, we present a case of study where we apply the approach using one year of customer's order data history from a retail company. The goal of the company after applying the application of the methodology was to evaluate its order picking process. With this information they wanted to identify any possible improvement on their current operation. From this date, We found four clusters using the customer's order data history. The clusters differ in the number of lines per day and the order affinity indicator. Additionally, We also found a good result for the silhouette coefficient (define as the measurement that evaluates the quality of the clusters in terms of a good rate between the cohesion and separation of the observations). In the results, we identify one cluster with a high level of order affinity indicator. The days in this cluster had a special behavior, in which a large number of pair of items belong to a reduce number of orders. Furthermore, we also identify a cluster with the lowest order affinity indicator. In this cluster a large number of orders are completed from a large number of customers with a diversified pairs of items. In conclusion, the application of the presented approach for profiling warehousing activity using customer's order data history shows patterns and behaviors of the customers' orders that could serve as a baseline for making decisions in the warehousing processes


