


Services on Demand
Journal
Article
 English (pdf)
 Article in xml format
 Article references
 Send this article by e-mail
Indicators
-
 Cited by SciELO
 -
 Access statistics
Related links
-
 Cited by Google
 -
 Similars in
SciELO
Similars in
SciELO -
 Similars in Google
Share

 Permalink
Nova
Print version ISSN 1794-2470
Nova vol.13 no.24 Bogotá July/Dec. 2015
Artículo original producto de la investigación
A Web-based Fuzzy Inference System Based Tool for Cardiovascular Disease Risk Assessment
Herramienta Fuzzy de Inferencia basada en Web para la evaluación del riesgo vascular
Leonardo Yunda, Ms.C, PhD(c)1, David Pacheco2 and Jorge Millan, PhD1
1. Bioinnova Group, School of Health, Universidad Nacional Abierta y a Distancia UNAD, Bogotá, Colombia
2. Department of Electrical Engineering and Computer Science, Massachussets Institute of Technology, USA
Correspondencia: leyunda@unad.edu.co
Recibido: 11/03/2015 / Aceptado: 29/05/2015
Abstract
Objective: a Web-based Fuzzy Inference Tool for cardiovascular risk assessment has been developed. The tool makes use of inference rules from evidence-based medicine for membership classification. Methods: the system framework allows adding variables such as gender, age, weight, height, medication intake, and blood pressure, with various types of membership functions based on classification rules. Results: the tool allows health professional to enter patient clinical data and obtain a prediction of cardiovascular risk. The tool can also be later used to predict other types of risks including cognitive and physical disease conditions.
Keywords: Cardiovascular risk assessment, Fuzzy Logic, Evidence Based Medicine.
Resumen
Objetivo: desarrollar una herramienta Fuzzy de Inferencia basada en Web para la evaluación del riesgo cardiovascular. La herramienta hace uso de reglas de inferencia de medicina basada en evidencia para la clasificación de membresía. Métodos: el marco del sistema permite la adición de variables como el género, la edad, el peso, la altura, la ingesta de medicamentos, y la tensión arterial, con varios tipos de funciones de pertenencia basada en reglas de clasificación. Resultados: la herramienta permite a los profesionales de la salud ingresar los datos clínicos del paciente y obtener una predicción del riesgo cardiovascular. La herramienta también puede ser utilizada más adelante para predecir otros tipos de riesgos, incluyendo condiciones de la enfermedad cognitivas y físicas.
Palabras clave: evaluación de riesgo cardiovascular, lógica difusa, medicina basada en evidencia.
Introduction
Cardiovascular disease (CVD) has traditionally being considered one of the leading causes of morbidity and mortality in the United States and abroad. Accounting for 1 in every 4 deaths each year, the CVD problem is a health threat to our population and a large cause of expenses in healthcare systems. In Colombia, for example, in the period of 2008-2013, CVD deaths counted for 23.5% of the total deaths (1) causing a huge cost in the healthcare economic resources. CVD is, however, a highly preventable disease when making corresponding life style changes in diet and physical activity, for example, that impact the patient's modifiable factors such as body mass index, waist circumference and cholesterol levels. These factors have been traditionally viewed as precursors to CVD. As the effectiveness of CVD management methods based on medication are only assessed from clinically validated studies done on a large population, their application to an individual patient is not always certain, effective and turns out to be a lengthy and expensive process. A difficulty of traditional CVD treatment actions is the fact that CVD risk depends on a number of variables and factors that are difficult to evaluate and associate with a precise disease risk level. Thus, in order to manage and minimize the amount of cardiovascular events arising every year there has to be a proper disease prevention program focused on the individual that first evaluates his/her risk of acquiring or exacerbating CVD.
General promotion of health and prevention of disease programs have statistically shown to be effective in reducing the number of CVD events in the population but are not targeted to each individual. Conditions and risk factors of individuals are not usually known or assessed from the electronic medical record so customizing precise wellness programs for each individual is not easily accomplished. A more efficient approach is to use online and medical informatics tools for evaluating disease states and risks or exacerbating or acquiring a condition. Although, the basic CVD risk computational algorithms such as the Framingham risk score (2,3) and, lately, Chad2 (4) can at some level predict the outcome of an individual from acquiring or exacerbating CVD, those tools are based on hard but simple inferences and transitions from one state into another state ("normal" SBP = 120mmHg, "high" > 130 mmHg; Hypertension: SBP > 160 mmHg; Age > 75 years). These algorithms do not take into consideration key behavioral risk factors such as patient awareness of his/her condition, stress levels, anxiety, and sleep levels, as well as the inherent ambiguity in their classification process.
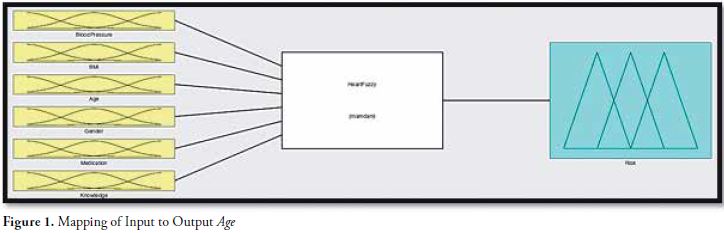
Our approach described in this work uses computational tools and evidence-based medicine to infer CVD risks levels on an individual. With this knowledge, proper prevention measures can be taken. By using patient's blood pressure, age, body mass index, gender, and behavioral factors, a system can be devised to map these inputs to an output of CVD risk. As these variables can combine to produce an overall risk score, we are proposing a computational model that takes into account ambiguity in the classification process. We then make this tool accessible online for wellness awareness that allows the mapping from a dataset to a risk score level using a medical knowledge base. The tool can then be augmented to infer risks levels for other disease conditions.
Fuzzy Diagnosis
Uncertainty plays a key role when using patient data to classify patients into a class of wellness states and disease conditions. Linguistic uncertainty, natural diversity and subjectivity are present in medical diagnosis. The meaning of "high", in the context of measurement of blood pressure, for example, might have different implications depending on the medical history of the patient, the healthcare professional and the clinical context. Thus, while the measurement of blood pressure can be known, with negligible statistical uncertainty, the interpretation of the result may have different meanings and courses of action depending on the clinical context (5). In this scenario, Fuzzy theory has been demonstrated to be an ideal approach for handling non-statistical uncertainty.
Due to its ability to handle non-statistical ambiguity, Fuzzy classification has been incorporated into various medical fields such as anesthesia monitoring (6-8) and cardiology (9-13). It has also generated advancements from axial artificial heart pumps (14) through the use of fuzzy control systems, to automatic evaluation of CT scan heart slices for creating 3D/4D heart models (15).
In terms of using Fuzzy sets to evaluate CVD, approaches such as that by M. Eswara Rao and Dr. S. Govinda Rao (16) have been implemented for coronary arterial disease diagnosis. Jose Antonio Sanz's et. al. (17) presented an approach for medical diagnosis of cardiovascular diseases using an interval-valued fuzzy rule-based classification system with dynamic rules. Other proposed CVD systems include Fuzzy inference for coronary disease screening (18) and assessment (19), in clinical decision support systems (20), and for heart disease diagnosis (21). A review of applications of Fuzzy sets in healthcare systems is presented in the paper of Lazzari (22).
Fuzzy Logic
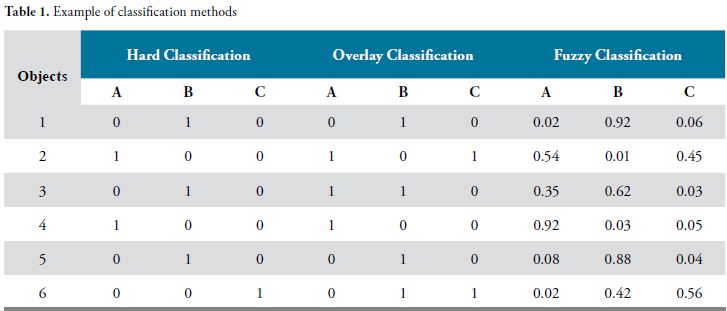
Fuzzy logic, introduced by Lofti A Zadeh in 1965 (23), allows for a novel methodology when classifying data when there is non-statistical ambiguity. In medicine it is useful in applications when subjective patient data must precisely map to a single output, such as in applications of cardiovascular disease risk assessment. Examining a glass of water as an example, before the methods introduced by fuzzy logic, computer perspective would see a glass of water as empty, 0, or full, 1 in what is called a digital approach. However, from human interpretation we can see that this is not always the case - in fact, it rarely ever is. Fuzzy logic allows us to map the quantity of water in the glass to two different functions - namely empty and full - and we can then see the glass as being a "member" of these two functions with varying degrees. These degrees range from 0 to 1; 0 being the lowest degree of membership and 1 being the highest. For illustration purposes, an example is shown in Table 1 of three classification approaches applied to 6 different objects, when classifying each object into A, B or C categories (24). As shown from the Table, Fuzzy allows a soft non-rigid non-exclusive approach for classifying the objects into the A, B or C classes.
The Fuzzy method can be applied in healthcare when ambiguity exists in the classification process. When classifying a patient as "old" it is then possible to not take abrupt (hard) transitions in age to distinguish between young and old, thus eliminating the observer ambiguity. When applying Fuzzy to factors such as Age, BMI, or Blood Pressure, we can obtain a smoother transition curve that is more precise and impartial. Following this principle, a Fuzzy classification approach for atrial fibrillation cardiac arrhythmia is discussed in (25). In our current work, however, we have created a framework that can be applied to other disease conditions and it is not limited only to CVD. The following pages explain how this approach can be used to create a Fuzzy-Based Heart Diagnostic System and show mathematical models and graphs obtained using the MATLAB's Fuzzy Inference System tool.
Membership Functions
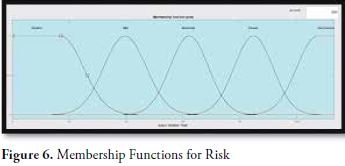
Membership functions, or the functions used to map input to the different classifications in the range from 0 to 1, vary in terms of shape. The most commonly used ones are triangular, trapezoidal, and Gaussian functions. A triangular function has a constant slope, which directly affects the degree of membership, and only has one point of complete degree - or a value of 1. Trapezoidal functions are similar to triangular ones but have a range of complete degree values. Gaussian functions, the ones used by our Fuzzy-Based Heart Diagnostic System, have varying slopes due to the curvature of the functions and maintain the single point of complete degree that triangular functions have. The mathematical formula for this function is shown below:
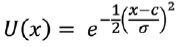
Where U(x) represents the membership degree U based on the input value x, c represents the mean value for the maximum of the Gaussian function or a complete degree of 1, and is a value used to represent the standard deviation of the function. Gaussian distribution functions are the preferred choice to represent variations as many physical and social processes in nature follow the Gaussian distribution around a mean value. By using this function we will obtain a value ranging from 0 to 1 to account for a process that is known as fuzzification. For purposes of synthesis, we will only discuss the following factors into our calculation of CVD risk: Age, Body Mass Index (BMI), Gender, Blood Pressure and Medication intake.
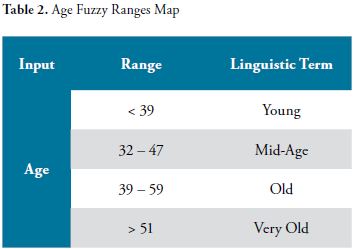
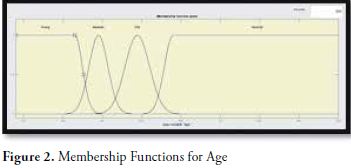
Age
The designed Fuzzy-Based Heart Diagnostic System uses age as an input field taken into consideration when calculating the risk of heart disease. Age has been used to diagnose heart disease because of the importance in predicting the progression of CVD. Studies and clinical data have shown that as age of the individual increases, blood pressure naturally increases due to the narrowing of blood vessels; we therefore account for that normality in our system. Four fuzzy sets, or ranges encompassed by each membership function, have been developed to account for ages ranging in the linguistic terms of Young, Mid-Age, Old, and Very Old. The precise mapping of input to a fuzzy set is shown below:
These four membership functions are mapped to a degree of membership as shown by the following figure:
Body Mass Index
Our input pool also includes the patient's body mass index - a calculation directly based off of the patient's height and weight.
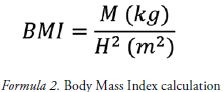
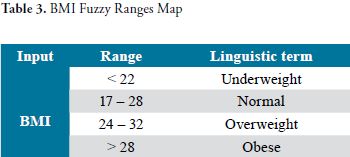
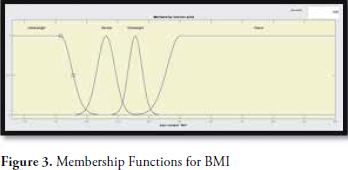
Where M is the patient weight in Kg and H is the height in meters. This measurement enables us to classify the patient, according with membership functions, as Underweight, Normal, Overweight, or Obese. Certainly, implications of being in the last two categories include effective narrowing of the blood vessels as they become clotted with fat. Of course, a person's risk of heart disease cannot be solely linked to his or her body mass index and therefore this is just an enhancement to the calculation rather than a main point of comparison. The ranges that correspond to the linguistic terms given above are as follows:
Gender
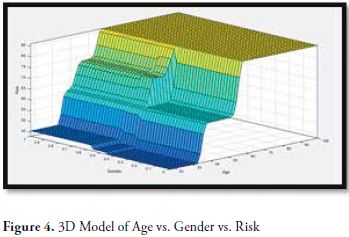
We have also included gender as another parameter to include in the calculation of a patient's risk of heart disease. It has been statistically proven that gender has an effect on the likelihood of someone suffering from a heart disease, especially in people of younger ranges of age. Because gender does not require a membership function, as it simply contains two different values. A person can only belong to one of these values, therefore no ranges or degrees of membership are assigned. Rather, Female is represented by a value of 0 and Male is represented by a value of 1 - for no other reason than the first value, or 0, being associated with the best characteristics in terms of output. In order to see how gender is used in conjunction with blood pressure, age, or BMI we later provide the set of rules used to evaluate the risk of heart disease.
Blood Pressure
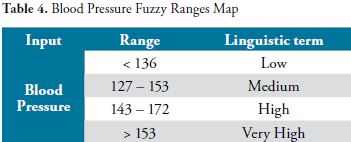
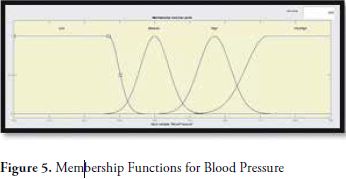
The next input is one of the most important ones in recognizing heart disease. Blood pressure tells us what the patient's current resting heart condition is, which, when mixed with factors such as medication or body mass index allows for a more precise heart disease risk assessment. In our fuzzy system it is divided, like age, into four different linguistic terms, each corresponding to a membership function. The terms and the corresponding ranges are as follows:
Medication and Knowledge
Another input parameter that we have incorporated into our system is whether the patient is taking high blood pressure medication or not. By analyzing the nature of this variable, and later proposed in our rule set, we can see that if a patient has high blood pressure and is taking medication, the risks become even greater than if he or she weren't taking that medication. This is because the fact that the medication is not helping to relieve the blood pressure allows for the deduction that the patient is at a much higher risk for heart disease. This is coupled with the knowledge of having high blood pressure to create an even more precise calculation for output. For example if someone is aware of their high blood pressure but is not taking medication, then the risk would be higher than if that person were not aware. This can be deducted from simple human nature, considering that the person was unwilling to get medication even after having been diagnosed of high blood pressure leads to the system calculating a higher risk for heart disease.
These two parameters, much like Gender, only have two values from which a patient can only logically choose one. For Medication, the values are No medication and Yes medication - 0 and 1 respectively. For Knowledge, it is Yes knowledge and No knowledge - 0 and 1 respectively. For further information on these two variables and their role in the calculation of heart disease risk, we will look at the rules section.
Heart Disease Risk
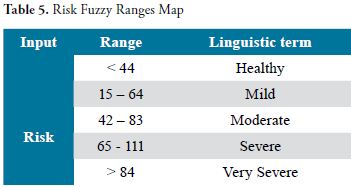
In a fuzzy system, output is also associated to membership functions. This is so in order to derive a more accurate result from the input we obtain. A user may fall under different risk ranges with varying degrees of membership; this is then calculated to give what is called a crisp output, or an output that is clearly associated with a risk level. The linguistic terms used to describe the risks and their corresponding ranges are as follows:
Rules and Output
A fuzzy approach to any sort of issue needs to have a rule set as the main point of calculation mapping input to output. In our Fuzzy-Based Heart Disease Diagnostic System we have a total of 27 rules encompassing the main associations of groups of inputs to a type of output. The rule structure tends to be in the form:
If (Input1 is TermRange1) …
OR/AND (Input2 is TermRange2)…
Then (Output is TermRange3)
Formula 3: Rule Syntax
Where Input is any of the abovementioned input types - Age, Blood Pressure, Medication, etc -, TermRange is a linguistic term used to describe the Input preceded by the word "is" - Young, Overweight, Severe, etc -, and Output is simply whatever output we are choosing to map our input to, in our case since there is only one output - Risk - we do not need to worry about that.
The words OR and AND are not interchangeable, as can logically be inferred, and even differ in the way the rule is calculated. In our system, we have made rules using AND only. The main distinction, which can also be altered based on technical preference and the purpose of the system, between OR and AND is that OR uses a max function to calculate the resulting output for the individual function, while AND uses the min function to calculate it.
To explore what this means in terms of degrees of membership let's use the example above. If Input1 belongs to TermRange1 with a degree of 0.7 and Input2 belongs to TermRange2 with a degree of 0.8 and the "AND" delimiter is used in the rule, the min function will be activated and the lowest degree of membership will be used - 0.7 in this case. If OR were to be used, the highest degree of membership would be taken - 0.8 in this case. This degree is then used to state that Output belongs to TermRange3 with a degree of 0.7, if AND is used, or 0.8, if OR is used.
The rules included in our Fuzzy-Based Heart Disease Diagnostic System can be shown in the following snapshot of MATLAB's Fuzzy Inference System Rule Modifier. They follow the syntax represented above and include a number in parenthesis at the end of each line corresponding to the weight of the associated rule. The lower the weight value, the less of a role the rule plays in calculating the output.
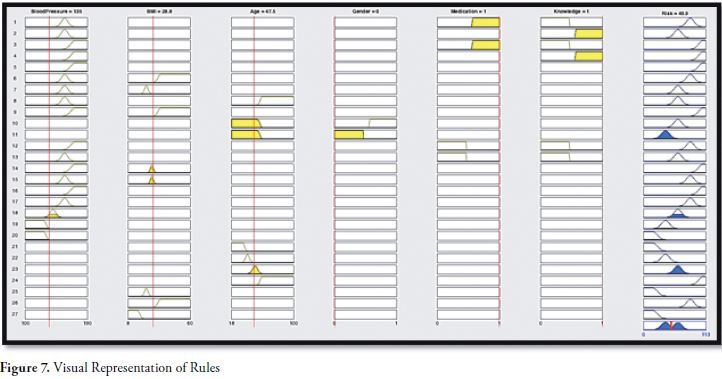
After each individual rule is processed and based on whether the requirements for the rules are met or not, we will obtain a range of degrees of membership to each of the output membership functions. Two rules may provide a different degree of membership to the same output function. In order to deal with this discrepancy in rules, fuzzy logic allows us to choose whether we want to use the min, max, product, or a variety of other methods to calculate the final degree membership of each of the output functions. In our system we use the max function, which keeps the maximum degree of membership associated with each of the membership functions. Now that we have a degree for each membership function in the Risk output, we need to involve another equation to evaluate the final output, or what is called the crisp output in the defuzzification step. The formula used in this step is as follows:
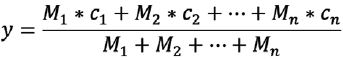
Where Mn is the membership degree, obtained from the rules, for function n - n being 1 for the first function, in our case Healthy, 2 for the second function, or in our case Mild, and so on -, cn is the c value used in Formula 1 to create the membership function - or in other words, the value at which the membership degree is 1 -, and y is the crisp output - our final measure of heart disease risk.
Web implementation
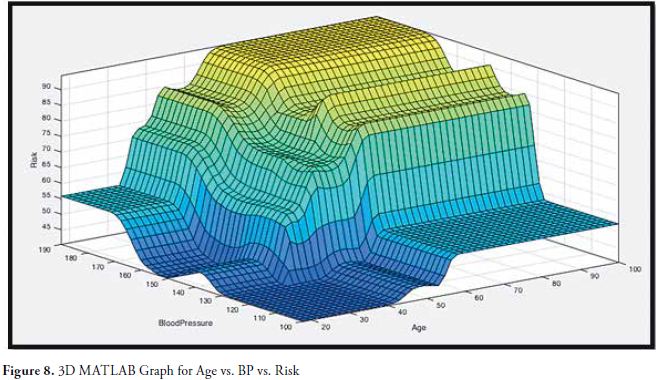
It is possible to create a Fuzzy Approach to a problem using MATLAB's Fuzzy Inference System. The system allows us to clearly see the relationship between input and output and to modify the types of calculations done by the rules and output degree mapping. The graphical models that it creates are also good in showing the membership functions as a group in 2D and 3D graphs.
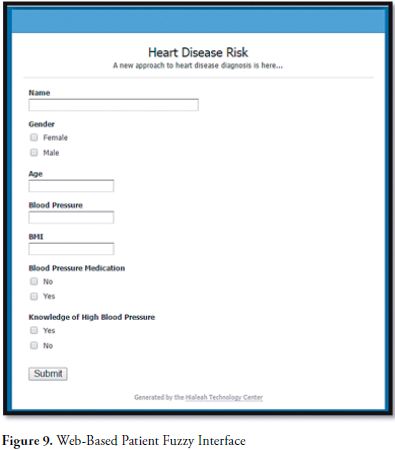
In our web approach for the Fuzzy-Based Heart Disease Diagnostic System we have used the programming language PHP as well as an Apache server for development. A simple HTML form used to acquire input, coupled with a PHP form handler and several functions to create membership degrees, rules, and crisp output have been programmed in order to allow for a website accessible to patients.
Conclusions and Future Work
We have developed a Web based Fuzzy inference tool that evaluates the risk of acquiring or exacerbating cardiovascular disease. The inference tool makes use of classification rules based on membership degrees obtained from evidence based medicine and knowledge base from a 600 patient database previously assessed for cardiovascular risk. The significance of this tool is that it allows using soft classification rules that have overlapping degrees of membership, which can be obtained from experience and from patient data. This in turn, can be dynamically adjusted based on the population and particular demographics of the dataset. The web-based tool can later be transformed and augmented to allow for evaluation of risk of acquiring any type disease condition based on inference from knowledge bases and evidence base medicine.
Acknowledgement
This research has been supported by the School of Health, Universidad Nacional Abierta y a Distancia UNAD, Bogotá, Colombia.
References
1. Enfermedad Cardiovascular: principal causa de muerte en Colombia. Boletin Observatorio Nacional de Salud, No. 1, Diciembre 9, 2013. Instituto Nacional de Salud, Colombia. [ Links ]
2. D'Agostino, R.B., et al. (1998). Prediction of coronary heart disease using risk factor categories. Circulation, 97, 1837-1847. [ Links ]
3. D'Agostino, R.B., et al. (2008). General cardiovascular risk profile for use in primary care: the Framingham Heart Study. Circulation, 117, 743-753 [ Links ]
4. BF Gage et al. (2001). Validation of clinical classification schemes for predicting stroke. Results from the national registry of atrial fibrillation. JAMA, 285: 2864-2870. [ Links ]
5. Fuzzy Diagnosis, Ludmila I. Kuncheva and Friedrich Steimann, Artificial Intelligence in Medicine, No. 16 (1999) 121-128. [ Links ]
6. Asbury AJ. Feedback control in anesthesia. Int J Clin Monit Comput 1997;14(1):1-10. [ Links ]
7. Asbury AJ, Tzabar Y. Fuzzy-logic new ways of thinking for anesthesia. Br J Anaesth 1995; 75(1):1-2. [ Links ]
8. Linkens DA, Shieh JS, Peacock JE. Hierarchical fuzzy modeling for monitoring depth of anesthesia. Fuzzy Sets Syst 1996;79(1):43-57. [ Links ]
9. Downs J, Harrison RF, Kennedy RL, Cross SS. Application of the fuzzy ARTMAP neural network model to medical pattern classification tasks. Artif Intell Med 1996;8(4):403-28. [ Links ]
10. Goldman JM, Cordova MJ. Advanced clinical monitoring-considerations for real-time hemodynamic diagnostics. J Am Med Inf Assoc 1994;SS:752-5. [ Links ]
11. Grauel A, Ludwig LA, Klene G. ECG diagnostics by fuzzy decision making. Int J Uncertain Fuzziness Knowl Based Syst 1998;6(2):210-0. [ Links ]
12. Ham FM, Han S. Classification of cardiac arrhythmias using fuzzy artmap. IEEE Trans Biomed Eng 1996;43(4):425-30. [ Links ]
13. Held CM, Roy RJ. Multiple-drug hemodynamic control by means of a supervisory fuzzy rule-based adaptive-control system-validation on a model. IEEE Trans Biomed Eng 1995; 42(4):371-85. [ Links ]
14. Axial Suspension Fuzzy PID Control for Axial Artificial Heart Pump. Changjun Zhao et Al. Applied Mechanics & Materials , 2014, Vol. 703, p323-326, 4p. [ Links ]
15. Automated fuzzy evaluation of CT scan heart slices for creating 3D/4D heart model. M. Bielecka et Al. Applied Soft Computing, May 2015, vol.30, pp. 179-89. [ Links ]
16. Expert System for Heart Problems. M. Eswara Rao, Dr. S. Govinda Rao, October 2014, Vol 4, Issue 10,266-271. [ Links ]
17. Medical diagnosis of cardiovascular diseases using an interval-valued fuzzy rule-based classification system. Jose Antonio Sanz et Al. 28 November 2013. [ Links ]
18. Fuzzy Inferencing for Coronary Artery Disease Screening. Anu Ragavi et Al. Dec 2014, Vol 4, Issue 12,388-391. [ Links ]
19. A fuzzy-evidential hybrid inference engine for coronary heart disease risk assessment. Vahid Khatibi et Al. Expert Systems with Applications, Volume 37, Issue 12, December 2010, Pages 8536-8542. [ Links ]
20. Clinical decision support system: Risk level prediction of heart disease using weighted fuzzy rules. P.K. Anooj. Journal of King Saud University. Volume 24, Issue 1, January 2012, Pages 27-40. [ Links ]
21. A Fuzzy Expert System for Heart Disease Diagnosis. Ali Adeli et Al. Proceedings of the International MultiConference of Engineers and Computer Scientists 2010 Vol I, IMECS 2010, March 17 - 19, 2010, Hong Kong. [ Links ]
22. Fuzzy Sets Application To Healthcare Systems. Luisa L. Lazzari et Al. Fuzzy Economic Review Vol. XVII, No. 2, November 2012, p. 43-58. [ Links ]
23. Zadeh LA. Fuzzy sets. Inf Control 1965; 8:338-53. [ Links ]
24. Etude comparative de la classification ascendante hiérarchique et de la classification floue pour identifier cinq familles de voitures. G. Paviot, Cahier de recherche, Laboratoire Orléanais de Gestion, 1997. [ Links ]
25. Fuzzy logic based system for classification of atrial fibrillation cardiac arrhythmias. Messaoud, A., Ecole Nat. et. Al. Electronics, Circuits and Systems, 2006. ICECS '06 13th IEEE International Conference on. [ Links ]
