Serviços Personalizados
Journal
Artigo
Indicadores
-
 Citado por SciELO
 -
 Acessos
Links relacionados
-
 Citado por Google
 -
 Similares em
SciELO
 -
 Similares em Google
Compartilhar
Revista Criminalidad
versão impressa ISSN 1794-3108
Rev. Crim. vol.61 no.3 Bogotá set./dez. 2019
Estudios Criminológicos
Citizen security, violence and criminality: a holistic and criminological vision of the statistical figures of 2018
1Magíster en Pensamiento Estratégico y Prospectiva Capitán de la Policía Nacional de Colombia Jefe, Observatorio del Delito Dirección de Investigación Criminal e INTERPOL, Bogotá, D. C., Colombia jair.rodriguez1243@correo.policia.gov.co
2Subintendente de la Policía Nacional de Colombia Jefe, Equipo de Investigaciones Criminológicas Observatorio del Delito, Dirección de Investigación Criminal e INTERPOL Bogotá, D. C., Colombia yeizon.duarte4286@correo.policia.gov.co
3Doctora (c) en Economía Jefe de Pregrado, Escuela de Economía Universidad EAFIT Medellín, Colombia cgomezt1@eafit.edu.co
4Tecnólogo en Investigación Judicial Patrullero de la Policía Nacional de Colombia Investigador Criminológico, Observatorio del Delito Dirección de Investigación Criminal e INTERPOL Bogotá, D. C., Colombia jahiler.cadavid3407@correo.policia.gov.co
Criminality and public safety are associated and dependent concepts and therefore evidence - through statistical indicators - establishes an existing correlation between both using a descriptive type approach. This document aims to analyze, interpret and describe the behavior of the crimes that occurred during 2018 in Colombia. In this sense it begins with the debate of socioeconomic and public safety aspects of the criminal economy, as well as its impact on the commission of criminal elements. The methodology used focuses on the Principal Components Analysis (PCA), which determines the grouping and concentration of eight crimes nationwide per quarter; then it focuses on 10 capital cities that concentrate 23% of the crimes, finally it does it in the localities of Bogotá. Likewise, the criminological analysis is carried out to illustrate the behavior compared to the other factors that affect the criminological juncture. Drawing from the information that lies at the SIEDCO database, statistical exercises were done to establish levels of correlation to study the inertia of criminal indicators in Colombia during the comparative periods of 2017 and 2018, since these behaviors are repeated in time. As a result, a correlation between qualitative and academic information could be established with filed complaints and criminal acts known by the National Police. Likewise, the operational activities of the institution have allowed a holistic observation of crime registered at a national level and a study of criminogenic variables that help having more effective police actions in crime reduction and complementary methods to combat criminal action.
Keywords: Criminality; theft; crime; homicides; economies; violence
La criminalidad y la seguridad ciudadana son conceptos asociados y dependientes, por ello la evidencia -mediante indicadores estadísticos- establece una correlación existente entre ambos mediante con enfoque de tipo descriptivo. Este documento tiene como objetivo analizar, interpretar y describir el comportamiento de los delitos ocurridos durante el 2018 en Colombia. En este sentido se inicia con el debate de aspectos de tipo socioeconómico y de seguridad ciudadana de la economía criminal, así como su incidencia en la comisión de los elementos delictivos. La metodología utilizada se enfoca en el Análisis de Componentes Principales (ACP), el cual determina la agrupación y concentración de ocho delitos a nivel nacional por trimestre; luego se focaliza en 10 ciudades capitales que concentran el 23% de los delitos, por último en las localidades de Bogotá. De igual forma, se realiza el análisis criminológico para ilustrar el comportamiento frente a los demás factores que inciden en la coyuntura criminológica. Partiendo de la información que reposa en la base de datos SIEDCO1, se efectuaron ejercicios estadísticos para establecer los niveles de correlación para estudiar la inercia de los indicadores delictivos en Colombia durante los periodos comparativos de 2017 y 2018, dado que estos comportamientos se repiten en el tiempo. Como resultado, se pudo establecer una correlación entre la información cualitativa y académica con las denuncias presentadas y hechos delictivos conocidos por la Policía Nacional. De igual forma, las acciones operativas de la institución han permitido una observación holística de la criminalidad registrada a nivel nacional y un estudio de las variables criminógenas que ayudan a tener acciones policiales más eficaces en la reducción del delito y los métodos complementarios para combatir el accionar criminal.
Palabras clave: Criminalidad; hurto; crimen; homicidios; economías; violencia
A criminalidade e a segurança cidadã são conceitos asociados e dependentes, por isso a evidencia -mediante indicadores estadísticos- estabelece uma correlação existente entre ambos mediante um enfoque de tipo descritivo. Este documento tem como objetivo analisar, interpretar e descrever o comportamento dos delitos ocorridos durante o 2018 na Colômbia. Neste sentido se inicia com o debate de aspetos de tipo socioeconômico e de segurança cidadã da economia criminal, assim como a sua incidência no cometimento dos elementos delitivos. A metodología utilizada se foca na Análise de Componentes Principais (ACP), a qual determina a agrupação e concentração de oito delitos ao nível nacional por trimestre; logo se focaliza em 10 cidades capitais que concentram 23% dos delitos, por último nas localidades de Bogotá. De mesma forma, se realiza a análise criminológica para ilustrar o comportamento diante aos outros fatores que incidem na conjuntura criminológica. Com base na informação que fica na base de dados SIEDCO, foram efetuados exercícios estadísticos para estabelecer os níveis de correlação para estudar a inércia dos indicadores criminais na Colômbia durante os períodos comparativos de 2017 e 2018, dado que estes comportamentos se repetem no tempo. Como resultado, foi possível estabelecer uma correlação entre a informação qualitativa e académica com as denúncias presentadas e fatos delitivos conhecidos pela Polícia Nacional. De mesma forma, as ações operativas da instituição têm permitido uma observação holística da criminalidade registrada a nível nacional e um estudo das variáveis criminógenas que ajudam a ter ações policiais mais eficazes na redução do delito e os métodos complementários para combater a ação criminal.
Palavras-chave: Criminalidade; furto; crime; homicídios; economias; violência
Introduction
This article records statistics figures concerning crimes committed in Colombia during 2018, these reveal the behavior of criminality through a comparison between the years 2017 and 2018, disaggregating this way crimes with greater impact on citizen safety and that affect the social and economic stability of a community.
According to González and Sánchez (2008) the criminal phenomenon must be understood and analyzed not in itself, but always in relation to another, determined in time and space. Therefore, the minimum method for its knowledge is the comparative one, taking into account that crime in Colombia is a secular problem of vital importance for all State institutions. Nevertheless, Durkheim (1893) raised in the sociological concept that the anomie as criminality is a failure of social structure, by the relative lack of rules in a group or community (González and Sánchez, 2008), which leads in great measure to establish the citizens' behavior parameters and the legal compliance that justice operators must have in our country ; however, there are interpretations of violence and crime from the econometric methodologies that reduce the social development model and enhance crime to a set of socioeconomic variables (poverty, unemployment, education level among others.) (Paternain, 2007).
From an economic perspective, we take into consideration different ways to analyze crime. From a microeconomic point of view, there is the decision of the individual agent (delinquent in this case) maximizing its profit, who is rational as the neoclassical economists suppose and that conducts a cost-benefit analysis between exercising a legal activity versus an illegal one. This analysis has as benefit the income obtained through the illegal activity, which will be carried out if it exceeds the lawful one, but, in addition, it incorporates within its reasoning the cost, which has to do with the probability of being captured and convicted (as well as the severity of the sentence) (Becker, 1968) (Ehrlich, 1973).
In addition, microeconomics is responsible for understanding how markets work, so it is useful when analyzing the increase in crimes against economic assets: the supply and demand of illegally obtained goods (cell phones, motorcycles, vehicles, computers, among others). Similarly, the increasing ability of criminals to hide their illegal activities and infiltrate them into the formal economic system through sophisticated operations is evidenced, so as not to lose dividends on their investments, that is, by achieving participation in the formal economy.
This is how this article presents a combination of a theoretical and descriptive analysis, which aims to contribute to the understanding and development of public policies to address the crime problem with a scientific basis. In addition, it begins with a review of the literature, focusing on tangible and intangible costs that crime brings to society and, therefore, how dissuasive and preventive actions are most relevant to tend to improve the quality of life of the inhabitants of a territory, focused on the case of the Latin American region.
Then we proceed to describe the dynamics of crime in Colombia, understood as the set of crimes and offenses committed in a given time and space, with graphic techniques that allow a sophisticated visualization of reality. At the end of the manuscript rest the final considerations, looking for a holistic view of the problem under consideration.
Criminality deterrence and prevention
The Latin America and the Caribbean region - according to the World Bank - has a homicide rate per hundred thousand inhabitants of 22.3 and the world’s is 5.3 becoming the most violent region in the universe during 2015. This situation has not changed in the last three years. This violence brings both economic and social costs, which implies being a priority of public policy in the different territorial dimensions of the countries. In the words of Jaitman (2017), within the psychological costs is what refers to the changes in the behavior of people and companies to prevent being victims, in addition to the expenses to protect themselves from criminal action as well as at the national level is the loss of productivity from the productive factors and the opportunity cost in the efficient allocation of resources that are diverted to control crime.
It is estimated that on average for Latin America and the Caribbean (LAC), crime is equivalent to 3% of the Gross Domestic Product, existing large differences between countries, being critical Central Americans like El Salvador with 105 homicides per 100,000 inhabitants and Honduras with a rate of 57, contrasting with those in South America such as Chile (3), Argentina (6), Uruguay (7.8). On the other hand, the countries with the highest number of inhabitants and that have also suffered different types of violence behave differently: Brazil (28), Mexico (16).
Given this reality, one of the most important institutions as well as deterrents against crime is, on one hand, the Police, in charge of executing the captures and, on the other, the judicial system having the responsibility of condemning the crime and imprisoning the individual who commits it. In this regard, Mello (2019) studies the causal effect of the police on crime, finds that violent crime responds better than property crime, before increases in the police force. He points out that fiscal support to local rulers for crime prevention can obtain great returns, especially in complicated macroeconomic times and even more so in geographic locations that are most affected by these crises. Estimates indicate that each police officer is associated with 4.27 fewer violent crimes and 15.39 less property crimes, which implies corresponding elasticities of -1.3 and -0.81, consistent with other literature that states that Police-crime elasticity is greater for violent crimes than for property. This is logical, since the action or police presence controls crime in two ways: it is dissuasive with its presence per se and is disabling when there is indeed an apprehension. It is worth noting that the deterrent effect is particularly relevant not only by the decline in crime, but because in relative terms is less expensive than via incapacitation incarceration (Chalfin & McCrary, 2017).
It is then appropriate to begin the analysis of crime prevention via deterrence, reason why we should first cover the seminal work of Becker (1968), who states that the offender is a rational being, as such taking decisions performing a cost-benefit analysis, taking into consideration the income it will receive when doing a legal economic activity versus an illegal one, the probability of being apprehended if its decision is illegal and the severity of the sentence it must face if prosecuted for such activity.
Then on, other economists have analyzed the sensitivity of crime to deterrence, the severity of the sentence and the opportunities offered by the formal labor market (Chalfin & McCrary, 2017). This is how if analyzed jointly to Becker (1968) and to Ehrlich (1973) - pioneers in the economic analysis of crime - three conclusions about deterrence are achieved: 1) the supply of crime will decrease as the probability of apprehension increases, (2) the supply of crimes will decrease as the severity of the criminal sanction increases, and (3) the supply of crimes will decrease as the opportunity cost of the crime increases.
The previous generates the famous metaphor of carrot and stick (Corman & Mocan, 2005), constituting the stick all related to the apprehension and corresponding sentence and the carrot all the conditions of the formal and legal labor market that signals the cost-benefit analysis of the potential criminal; In this regard, it is concluded that although economic and deterrence variables are important to explain the decrease in crime, the contribution of deterrence measures may be greater than those coming from economic variables.
Assuming the above as a rational assumption, the deterrent role of the police is fundamental and in this regard three ways in which this can be managed are described. The first is known as police surveillance of "hot spots." In this case, the police are deployed in a concentrated manner in areas of a city that seem to attract disproportionate levels of crime. The second type of intervention is "problem-oriented" police and refers to a collection of deterrence strategies focused to change the behavior of certain types of criminals or to succeed in specific territories. Finally, it refers to that of the "proactive" police, constituting strategies that are designed to make police surveillance more intensive, while maintaining fixed resources (Chalfin & McCrary, 2017).
In line with the above, the seminal article of hot spots corresponds to Sherman, Gartin & Buerger (1989), who study the spatial crimes concentration by guiding decisions to concentrate the police force and its resources on those same spaces The second strategy is that of the problem orientation approach, in which the fight against criminal gangs can be used as an example, whose objective is to prevent young people from getting involved in problems of violence between neighborhoods and their link to the criminal gang that acts near their home. In this strategic line is Eck (2003) with the theory of reforming possible criminals or existing criminals by providing anti-drug education, granting opportunities to practice sports and recreational activities for adolescents can contribute positively to thwart the development of criminal propensities. The third tactic has to do with police proactivity.
Furthermore, what is now being experienced is the need to predict or forecast in time and space where the crime will take place to act before and not in a posterior way. In this regard, Cohen, Gorr & Olligschlaeger (2007) developed a leading indicator model to forecast serious crimes both violent and against property, seeking to support the tactical deployment of police resources to prevent increases in crime (or to withdraw resources from forecasted areas for greatly decreasing), based on the attractive and displacement theories of crime.
Victimization and welfare of the population
Perhaps one of the problems of growing crime in Latin America is that of theft, which has direct implications on the quality of life of the inhabitants because they are victims of this crime, which can be with or without violence. However, it includes monetary and psychological costs faced by the victim. Kuroki (2013) reaffirms the above and refers to how crime affects individuals financially and this directly violates subjective welfare and happiness of a social reality. The author uses data from these phenomena collected from the national territory of Japan and notes that this violation is evidenced by the monetary pecuniary loss (loss of cash, medical expenses and lost working hours, if injured) and with the non-pecuniary loss (which may include psychological difficulties). From the data collected, the way individual well - being is affected by the direct experience of theft or assault is examined, specifically, the different income groups are examined.
On their behalf, Alfaro-Beracoechea, Puente, Da Costa, Ruvalcaba & Páez (2018) study how fear of crime (to be a victim of a crime) affects people's subjective well-being. It is indicated that the sociocultural context of a society can influence how people process fear, and therefore, the relationship between fear of crime and subjective well-being differ between social contexts where this fear is most frequent and in those it is not. Consequently (as this study does) it is important to analyze whether geographical location is a moderator in this relationship.
On one hand, social contexts where the crime rate is low, fear tends to affect people's subjective well-being less, which suggests that there is a cognitive process of habituation where the frequency and seriousness of the crime are minimized. On the other, in countries where the crime rate is higher, there may be a stronger perception of the danger (concern about security and dissatisfaction with the police and justice). In this way, the relationship between the fear of crime and the subjective well-being of people turns out to be stronger and more negative in these social contexts.
Violence in Latin America: a growing problem
As Glebbeek & Koonings (2016) states, the urban area of Latin America has become a synonym for violence and insecurity, finding a connection between them and poverty. In addition, it analyzes within the socio-spatial dimensions of violence and insecurity the links between criminal gangs, drugs and violence in peripheral areas. This, in turn, generates responses from urban residents, who take matters of security and law enforcement into their own hands. In this vein, it is important to note that while poverty does not directly generate systematic or organized violence, persistent social exclusion, the possibilities of alternative income and power extralegal sources, combined with an absent, corrupt or bankrupt State in certain territorial or social urban environments, lead to violence and to insecurity.
In the same vein, Jones & Rodgers (2015) suggest a basic premise where poverty and unemployment, income crises, rapid urbanization and weak institutions, increase the risk of violence. They then argue the widespread idea that cities and violence are intimately related based on the fact that a great deal of the recent conflict, terrorism and civil disorder has occurred in cities such as Beirut, Baghdad, Mumbai and Nairobi, or that the highest rates of homicides in the world affect cities in Colombia, Central America and South Africa. The above evidences in turn a relationship between cities in developing territories and violence.
At the same time, the issue of criminal gangs is a matter that is greatly preoccupying, generating a growing concern about what appears to be a phenomenon of complex and progressively growing organized crime in many cities around the world (Wolff, 2015. Moreover, Winton (2014) mentions how violence characteristics of contemporary gangs, in particular the relationship between extreme violence and urban marginality; the growing organization, power and influence of gangs; a battle for institutional legitimacy between gangs and the State; and the serious and harmful effects of this conflict on the local population and their social stability. The author points out how in Central America, for example, it is considered that a first round of extremely drastic punitive measures has accelerated and diversified gang crime instead of reducing it.
Recently, there have been signs that softer and more community initiatives receive some support. These involve a range of activities, including: voluntary weapon collection; temporary restrictions on carrying firearms and alcohol prohibitions; infrastructure in slums; and education and public health initiatives focused on at-risk youth. These so-called "second generation" initiatives are part of a new conceptual consensus within policy circles, are being promoted largely by bilateral and multilateral development agencies working in the region, which in general have tried to distance themselves from a rhetoric that criminalizes young people.
Statistical contextualization of crime and operability in the year 2018
Next is the analysis of the crime figures recorded and consolidated by the National Police in SIEDCO.
To calculate the correlation of capital cities with respect to the eight crimes in 2018, the Principal Components Analysis (PCA) method was used, which seeks to reduce the dimensionality of a data set, which for this case, is information of crimes (homicide, theft6, extortion, personal injury, sexual crimes, and domestic violence).
The information of crimes by cities discriminated by quarters was taken and processed in the R statistical program, selecting the columns that correspond to each quarter of the year 2018 and in each one for the eight crimes mentioned above. Next, the graphics according to the command in R for PCA method are extracted, which show by using a circle of correlation, the behavior of crimes for each quarter.
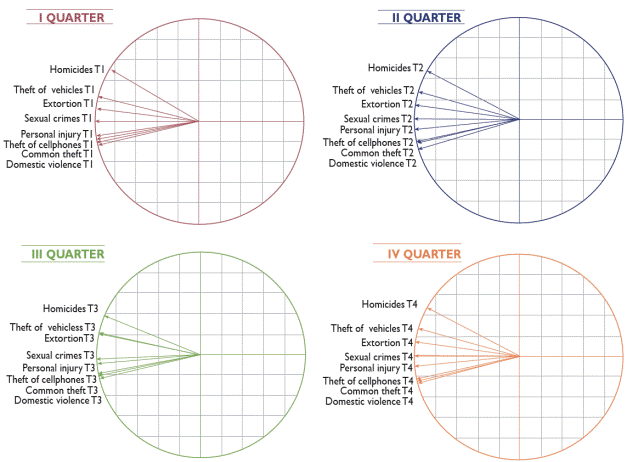
Source: SIEDCO Information, National Police 2018. Own elaboration 2019.
Graph 1 Circle of correlations by quarter, 2018.
The graph above shows the description of the criminal behavior for 2018 per quarter, there you can evidence three groups faced to criminal behavior: the first refers to the relationship of crimes of cellular theft and common theft (people, residences and commerce), which could infer that in each case of theft to a person or residence or business, the most stolen property is a cell phone.
The second, especially for the last two quarters, is related to personal injuries and sexual crimes, which in many reported cases the victim is physically assaulted by its victimizer. Finally, the relationship between extortion and theft of vehicles, which presents a significant correlation as for each case of theft of vehicles in the second and third quarter of 2018, cases of extortion to be able to recover the stolen good are manifested.
Likewise, the analysis of the 10 main cities with the highest concentration of crimes (23%) is carried out, excluding Bogotá, Medellín and Cali for being cities with similar causes and the number of crime records that exceed the national average. The cities of study are Barranquilla, Cartagena, Bucaramanga, Villavicencio, Ibagué, Pasto, Popayan, Cúcuta, Santa Marta and Neiva.
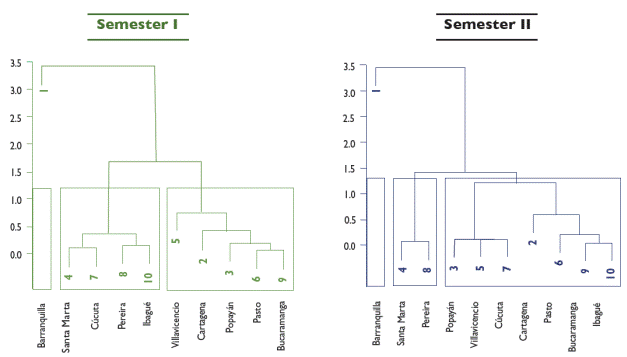
Regional as well as national analysis was done for the eight priority crimes, but only by semester, from this the following results of similarity were obtained (see Figure 2).
Source: SIEDCO Information, National Police 2018. Own elaboration 2019
Graph 2 Dendogram by semester, 2018.
Using the PCA method for the eight crimes in 10 cities, the graph which indicates the similarity and correlation by jurisdiction of the crime rates under three clusters (groups) of cities is obtained. Both in the first semester and in the second semester, the first cluster is centered on the city of Barranquilla, which has a very different behavior (independent) from other cities; the second cluster is concentrated, mainly, in Santa Marta and Pereira, may the difference between semester be because of exogenous causes or institutions' strategies to counter crime causing that in the second semester the occurrence of the crimes in Cucuta and Ibague is not similar.
Also, in the third cluster you can find the largest number of cities with similar criminal behavior that can be intervened in accordance with the level set in the semester Dendrogram.
This graph is very telling, since it allows establishing lines of action to focus, optimize and be effective in the implementation of strategies by institutions in accordance with the sectoring observed. The point goes more to the detailed analysis of city by city and the variables of time, mode and place that allow the occurrence of a criminal act.
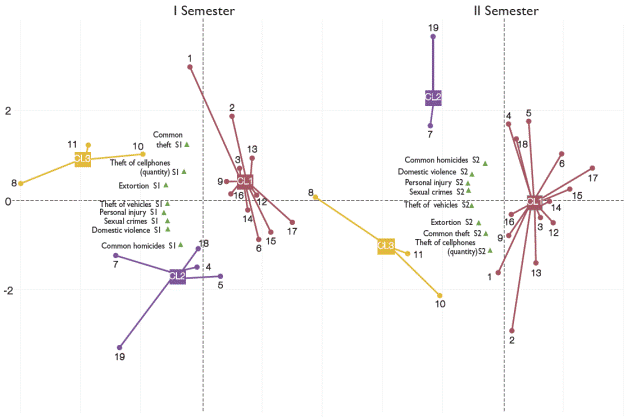
Like the previous exercises, it was carried out for the city of Bogotá by municipalities and semester. For this, the cluster and correlation between crimes graphs were taken, with the purpose of showing the criminal similarity by localities and correlation by crime (see graph 3).
Source: SIEDCO Information, National Police 2018. Own elaboration 2019.
Graph 3 Criminal dendrogram in Bogotá7, 2018.
In this graph the grouping of the localities with correlation in the criminal phenomenology are presented. Therefore, during the year and according to the analysis per semester, the localities of Kennedy, Engativá and Suba, as well as Fontibón and Puente Aranda, record criminal behavior in the eight similar crimes, according to the modality, cause and temporality where they occur, possibly because they are nearby localities. Similarly, they are related to the correlated crimes of common theft, cell theft and extortion.
Thus, the following is the analysis of the crime figures for 2018 recorded by the National Police, which presents an increase of 6.58% (see table 1), compared to 2017, in the total consolidated of crimes contemplated in the Colombian Penal Code, the decrease observed in crimes related to life and to humane integrity (5.17%), against the family (2.19%) against copyright (39.01%), against public health (3.24%) and against the constitutional and legal regime (9.36%).
The ones with the greatest increase in 2018 were those associated with moral integrity (1915.12%), followed by crimes against mechanisms of democratic participation (477.65%) (see graph 1).
On the total of the criminal records in 2018 (see table 1), those related to the title “Crimes against the economic patrimony” registered a participation of 38.55% (496,963), followed by crimes against life and personal integrity with a 16.09% participation (207,123).
The criminal behaviors with the highest frequencies within the title “against patrimony” are: theft from people, residences and commercial entities, with a total of 369,831 cases in 2018, and a participation in the total of crimes that threaten the economic patrimony of 28.7 % (see table 4).
At the end of this article, the annexes of the tables with statistical information on the behavior of crime at a national level for the year 2018 will be published.
Common homicide
When performing an analysis by rate of homicides in the capital cities, it shows that the highest ones are concentrated in San Andrés, with 34, followed by Arauca, with 29; Armenia, with 29; Medellín, with 25; Neiva, 24; Villavicencio, 23, and Tunja with 4, is the lowest rate of cities nationwide.
According to the administrative records of the National Police in SIEDCO during 2018, in Colombia 12,928 homicides were recorded8 which represents, in comparison to 2017, an increase of 5.12%; that is, 630 more cases, as in the previous period 12,298 events took place, representing a rate of 26 homicides per each 100,000 inhabitants. Likewise, it is pertinent to indicate that 260 cases correspond to deaths in public force and State security agencies procedures against alleged criminals, which are included in the total cases of the year 2018.
Source: SIEDCO Information, National Police 2018. Own elaboration 2019.
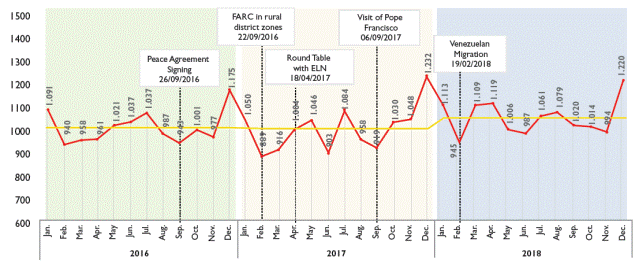
Graph 4 Historical homicides 2016, 2017 and 2018.
At the end of 2016, 12,164 common homicides were registered with an average of 1,014 monthly cases; during 2017, there was a decrease in 85 cases (0.7%), 12,079 were perpetrated with a monthly average of 1,007 events; next 2018, 12,668 common homicides and an average of 1,056 monthly cases, had an increase of 4.87% (588) (see graph 4).
The departments that registered the highest number of homicides during 2018 were:
Antioquia, with 19.33% (2,449 violent deaths); Valle del Cauca, with 17.70% (2,242) and Cundinamarca, including Bogotá D.C., with 11.52% (1,459). These territorial entities concentrated 48.55% (6,150) of the case.
Source: SIEDCO Information, National Police 2018. Own elaboration 2019.
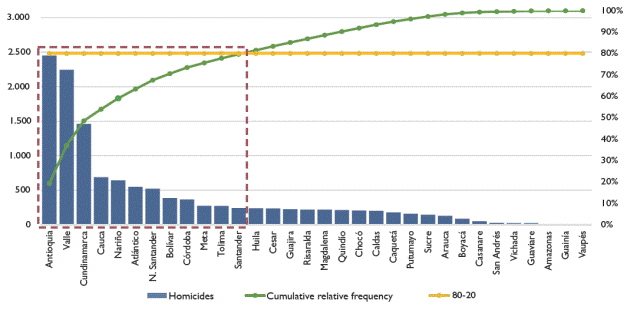
Graph 5 Pareto Chart - Homicides by political departments, 2018
The departments of Antioquia, Valle, Cundinamarca, Cauca, Nariño, Atlántico, Norte de Santander, Bolívar, Córdoba, Meta, Tolima and Santander reported 80% of violent deaths in 2018, indicating that 10,088 victims were presented in these 12 departments.
66.63% (8,441 cases) of the homicides occurred in urban areas, while 33.37% (4,227) in the rural sector; public roads which account for 60.78% (7,699) are the site of greatest participation. Regarding the date of occurrence of the events, the months where most murders occur are December (1,220) and April (1119). Likewise, including the previous months, January, March, July and August maintained a homicide trend above the monthly average (1,056). Weekend days (Sunday and Saturday) are those that reported 21.16% (2,680) and 16.06% (2,035) respectively (see Graph 6).
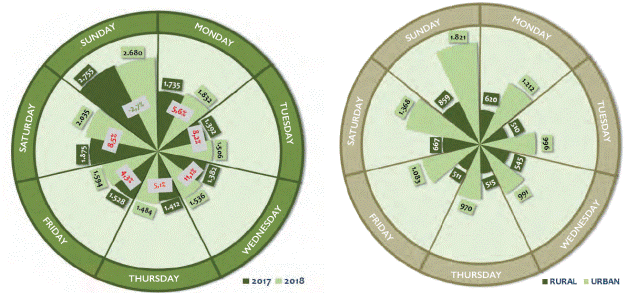
Source: SIEDCO Information, National Police 2018. Own elaboration 2019.
Graph 6 Homicide days a week year comparatives and weekdays vs. zone 2018
Regarding the time of the events, the range is provided between 18:00 to 23:59 hours, this interval recorded 38.62% (4,893) homicides, followed by 12:00 to 17:59 hours with 22.78% (2,886).
The firearm was the most used means for the commission of this crime in 2018, with 72.41% participation, represented in 9,173 cases, followed by sharp weapons, with 21.85% (2,768) and blunt elements with 4.33% (548). In addition, 11 homicides occurred without the use of weapons.
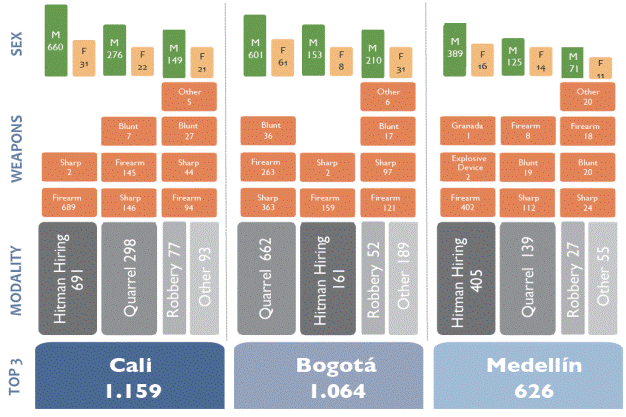
Source: SIEDCO Information, National Police 2018. Own elaboration 2019.
Graph 7 Top 3 cities by homicides: modality, weapons and sex, 2018
Similarly, instrumental violence (hitman hiring) registered 53.69% (6,802 cases) of participation, it is the modality of greater recurrence, followed by fights with 28.32% (3,587 events) and the robbery with 5.98% (757). To a large extent these cases are induced by factors such as the illegal settling of scores with 33.04% (4,186), social intolerance with 30.93% (3,918) and by revenge with 23.09% (2,925).
Regarding the sex of the victims, these have been men, mainly, representing 91.46% (11,586) of the total homicides, and women 8.54% (1,082); In addition, the age range was concentrated in people between 20 and 30 years old, representing 40.39% (5,117) of the total cases (see graph 8).
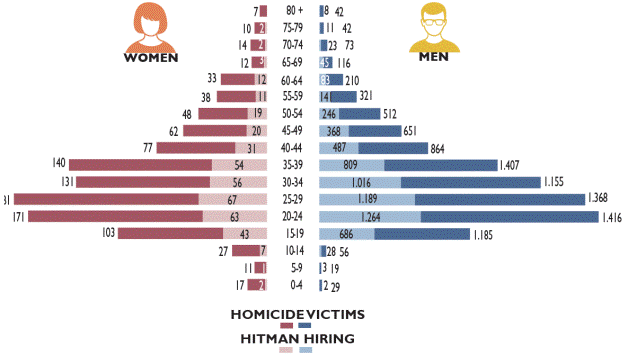
Source: SIEDCO Information, National Police 2018. Own elaboration 2019.
Graph 8 Age range and sex of homicide victims vs hitman hiring modality, 2018
According to marital status, it is single people who are more often victims with 62.15% (7,873), followed by those who live in domestic partnership with 31.28% (3,962) and Married ones with a non-significant percentage, 4.88% (618).
The most affected employee groups are individuals with 33.63% (4,260), followed by people who are independent with 30.88% (3,912) and the unemployed with 16.34% (2,070).
Next, a summary is made relating a series of words to the statistical figures of homicide in Colombia in the cloud of variables with data, during 2018, the size of the main words is in agreement with the participation of the word in the grouping of the variables (city, modality, weapon or medium, sex, marital status, age group, month, quarter, day of the week, zone, site type, and time interval) (see graph 9).
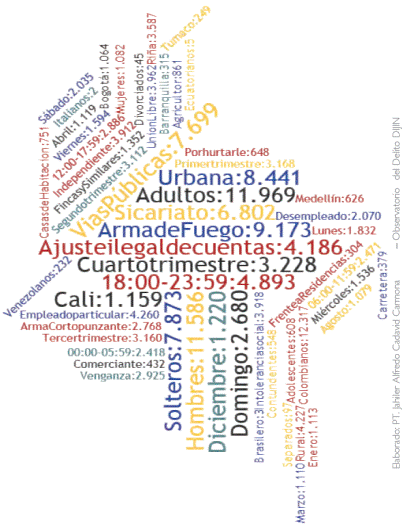
Source: SIEDCO Information, National Police 2018. Own elaboration 2019.
Graph 9 “Cloud variables with data” of homicide in Colombia, 2018
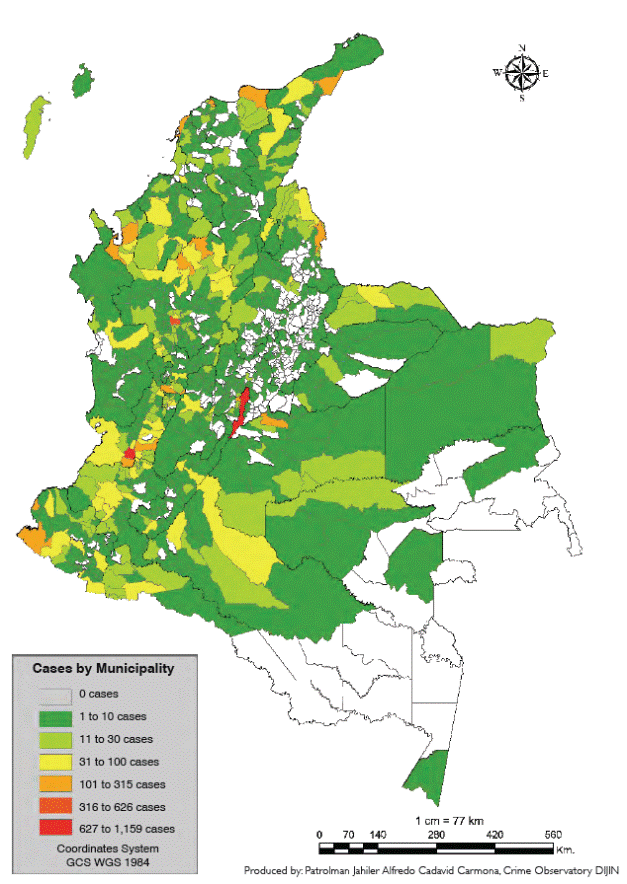
Map 1 Homicide at national level by political department, 2018
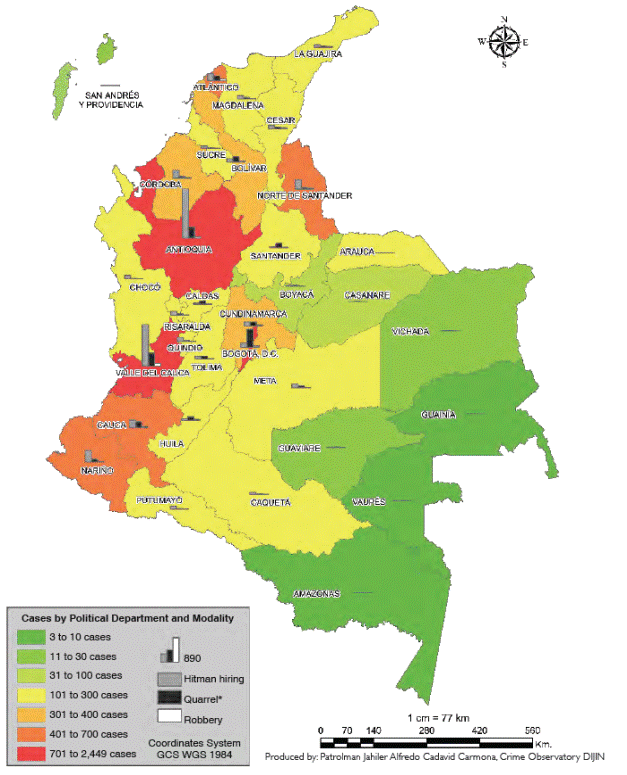
Source: Information SIEDCO National Police 2018. Own elaboration 2019.
2. Crimes that threaten citizen security and economic patrimony
Crimes of theft have significant impact on public safety as much as on the losses of an economic nature and in the perception of security. These generate significant crime rates. The crimes that most generate crime economy are common theft (includes residences, commerce and people) and vehicles (cars and motorcycles).
Thefts (people, residences and commerce):
Thefts (people, residences and commerce): These crimes registered an increase of 17%, because 316,624 cases were filed in 2017 and 369,831 in 2018. The absolute variation was of 53,207 more thefts (see table 4). The departments with significant decrease are: Nariño (19%); Vichada (17%); San Andrés (9%), when these two years are compared; as for those with the greatest increase in common theft, were Vaupés (52%); Atlántico (33%); Bolívar (25%) (see graph 8).
Theft from people
During 2018, we had 256,958 cases of theft from persons (modality categorized in the Penal Code -Law 599/2000, Article 239-) for a rate of 516 events per 100,000 inhabitants, with an increase of 22.5% (more than 47,188) in relation to the previous year, when 209,770 thefts were registered (see graph 4); the modalities with the highest participation were robbery (44.86%), picking pockets (14.41%) and snatching (9.25%). In addition, the opportunity factor (22.29%) was the most recurring circumstance (see graph 10)
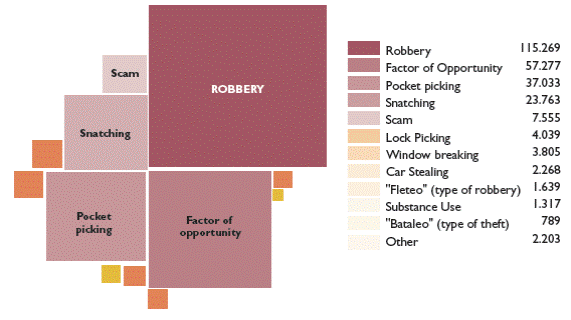
Source: SIEDCO Information, National Police 2018. Own elaboration 2019.
Graph 10 Participation modalities of theft from people in Colombia, 2018
46.10% (118,467) of the total people affected were registered in Cundinamarca, including Bogotá (105,959) and the departments of Antioquia (12.31%) and Valle (8.26%). The department of Nariño presented a significant reduction compared to 2017, from 6,540 cases to 5,266 (1,274 less), followed by Risaralda (276 less), Córdoba and Meta (150 less each). Likewise, 80% (205,624) of these cases was concentrated in seven political departments (see graph 11).
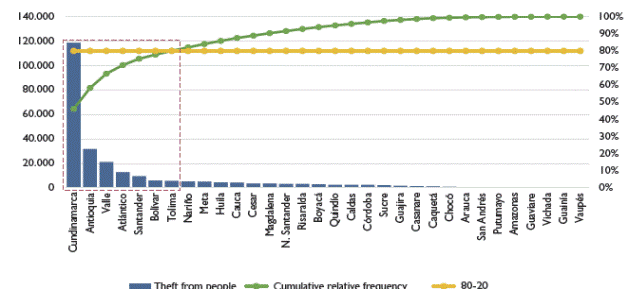
Source: SIEDCO Information, National Police 2018. Own elaboration 2019.
Graph 11 Pareto Chart - Theft from people by political departments, 2018
The places with the highest rate of reports for this crime were the capital cities, including: Bogotá with 41.24%, followed by Medellín 8.55% (21,972), Cali 6.27% (16,106), Barranquilla 3.74% (9,618) and Bucaramanga with 2% (5,142); These cities group 61.80% (158,797) nationwide. Moreover, 23 capital cities showed an increase and 9 decreased this way: Pasto (-1,055), Villavicencio (-267), Pereira (-202), Cúcuta (-66), San Andres (-59), Mocoa (-24), Inírida (-20), San José del Guaviare (-5) and Puerto Carreño (-3).
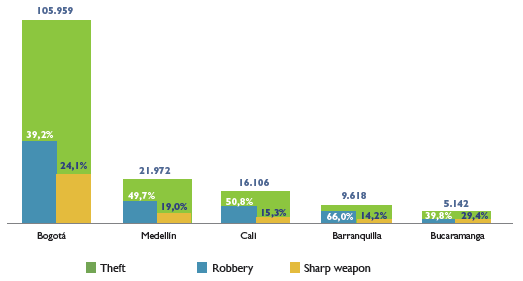
Source: SIEDCO Information, National Police 2018. Own elaboration 2019.
Graph 12 Cities with the highest record, robbery and sharp weapon modality, theft from people, 2018
At the end of 2018, four departments registered a significant decrease in theft from people, Nariño (-1,273); Risaralda (-275), Córdoba (-150) and Meta (-150). On the other hand, the departments with the greatest increase were Cundinamarca (30,741), Antioquia (5,217), Atlántico (3,617) and Valle (2,748) (see graph 8).
The behavior of theft from people in 2018 indicated a monthly average of 21,413 cases; with reference to month, October (23,530) and August (23,317) were the periods with more cases reported; on the other hand, during January, February and March there was less participation (18,809, 19,006 and 19,758, respectively). During this year, on Sundays there were fewer cases (26,213) compared to Fridays (42,692) and Saturdays (39,208).
Following, we display the weekly behavior contrasting the 12 months of 2018 with the facts. Sunday is located at the top of the table and the first week on the left; in addition, the monthly average of theft from people (orange line) compared to the trend of cases per month, the lowest number are dark green and those of highest, dark red. Similarly, those months that exceed (orange) and remain below the monthly average (light green) (see graph 13 ).

Source: SIEDCO Information, National Police 2018. Own elaboration 2019.
Graph 13 Theft of people by day of the week vs months in Colombia, 2018
95.1% (244,466 cases) of thefts from people were carried out in urban areas, while 4.9% (12,492) in the rural sector; being the time interval from 06:00 to 11:59 hours the one with the highest registration in both sectors (69,470 and 3,613 respectively) (see graph 14).
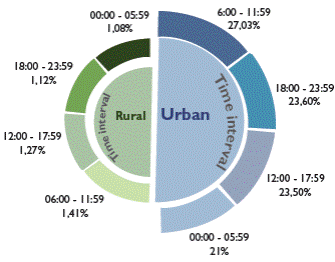
Source: SIEDCO Information, National Police 2018. Own elaboration 2019.
Graph 14 Theft from people by zone and time interval in Colombia, 2018
Public roads (43.01%) were the recurring scenario in which the perpetrators committed the crime (110,521); followed by alleys, which recorded 8,061 cases (3.14%). Regarding the sex of the victims, 56.21% (144,440) were men and 43.79% (112,518) women; 98.14% adults (252.178), 1.69% adolescents (4,354) and 0.17% minors (426).
Theft of mobile devices/cellphones
Considering that the phenomenon of theft from people is one of the main crimes that affects the safety of citizens in Colombia and knowing that the main object intended by criminals are the cell phones, following we conduct a characterization of this behavior with the administrative records of the SIEDCO database of the National Police by number of stolen cell phones.
During 2018, the theft of 171,267 cell phones was recorded, what represented an increase of 25.2% (34,496 more mobile phones), compared to the 136,771 cell phones stolen in 2017.
76% (130,165) of cell thefts were committed under the following modalities: robbery with 49.63% (84,996), picking pockets with 16.12% (27,608) and snatch with 10.25% (17,561); on the other hand, the factor of opportunity (neglect) concentrated 15.29% (26,187) and other forms of cell theft 8.71% (14,915).
Capital cities were characterized in concentrating the largest number of records; Bogotá, Medellín, Cali, Barranquilla, Bucaramanga and Cartagena grouped 62.63% (107,268) of cell phone thefts (see graph 15).
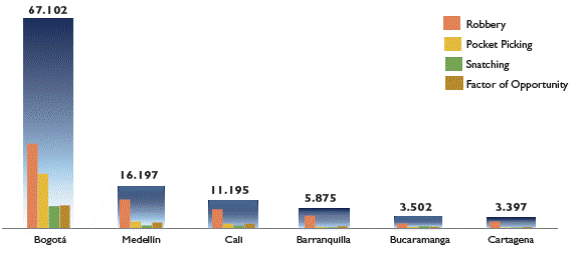
Source: SIEDCO Information, National Police 2018. Own elaboration 2019.
Graph 15 Cities with the highest registration and modalities in cell theft, 2018
44.65% were without the use of weapons (76,473), followed by sharp weapons with 23.60% (40,418), firearms with 21.19% (36,293) and blunt object 4.14% (7,090).
The month with the most cell theft was July (16,003); in addition, Fridays (16.24%) and Wednesday (15.87%) the most affected days.
The ranges of hours that showed greater criticality in the country were, between 06:00 and 11:59 hours, 28.45% (48,728 stolen phones) and between 18:00 and 23:59 hours 25.84% (44,251).
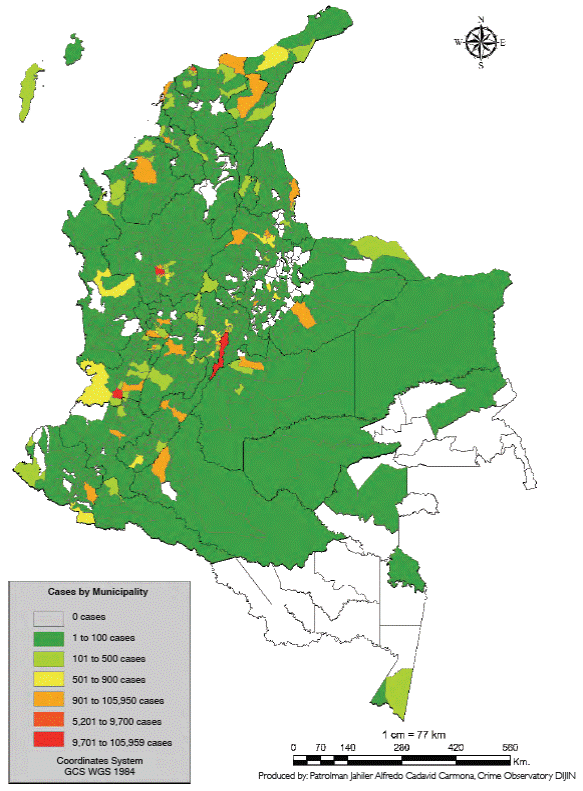
Map 3 Theft from people at national level by political department, 2018
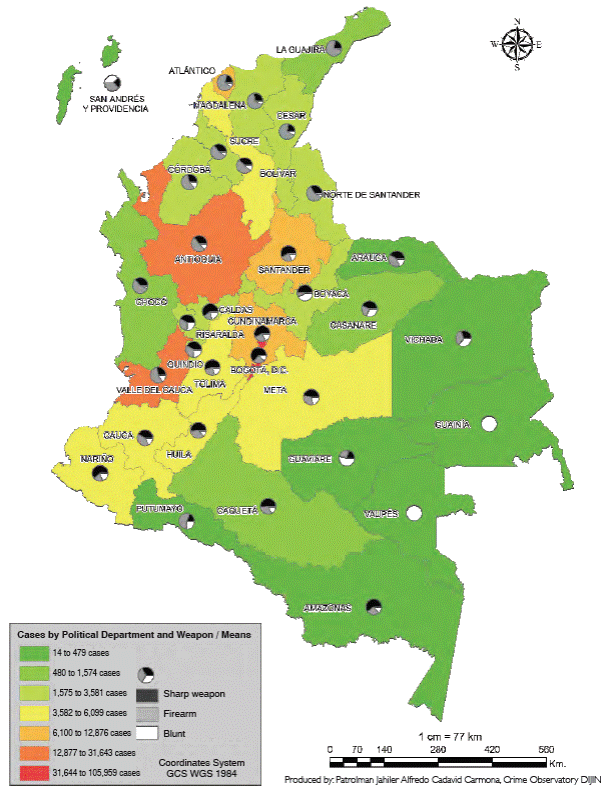
Source: Information SIEDCO National Police 2018. Own elaboration 2019.
Theft from residences
In 2018, an increase of 1.7% of this crime (795 more cases) is shown, compared to the previous year, going from 46,542 thefts in 2017 to 47,337 in 2018 (see Table 4). In a similar way, four municipalities registered a significant reduction in thefts, among them Pereira (169); Soacha (110); Pasto (101) and Quibdó (96).
The lock violation had a report of 23.72 % of cases (11,228), this was the modality of highest index, followed by the suction pad with 12.10% (5.730). The 42.32% of theft from residences (20,037) were recorded by factor of opportunity.
In 20.42 % of these thefts (9,669) the blunt weapons were with the highest record. In 30.49 % of thefts (14,435) no weapons were used.
86.59 % of theft from to residences (40,992 cases) occurred in urban areas and 13.39 % (6,339) in the rural sector.
For the year 2018, five departments presented a significant increase in this theft: Santander (539 more cases); Valle (404); Cundinamarca (251); Antioquia (229); and Atlántico (149). In comparison with the departments lower recording Risaralda (203); Nariño (116) and Córdoba (107) (see table 8).
Theft from commercial entities
During 2018, this theft increased 8.6 % (5,224 more cases) compared to the previous year, going from 60,312 thefts in 2017 to 65,536 in 2018 (see graph 4). On the other hand, three municipalities registered a significant reduction facing this crime: Pasto (176); Sabana de Torres (124) and Cúcuta (119)
The robbery was the modality of greatest recording with 18.49% of the cases (12,127), followed by shoplifting with 17.38% (11,401). 37.43% of thefts (24,547) were recorded by factor of opportunity.
In 14.61% (9584) of cases the firearms are the most used, then 8.83% (5788) with levers. In 57.12% of the thefts (37,458) no weapons were used.
At the end of 2018, three departments registered a greater increase in theft from commerce: Valle (1,661); Cundinamarca (1,643) and Antioquia (872). On the other hand, the departments with the lowest record were Nariño (229); Norte de Santander (185) and Tolima (87) (see table 8).
Theft of vehicles (motor vehicles and motorcycles): In 2018, a total of 42,510 vehicles were stolen, with an increase of l2 %, when compared to the cases registered in 2017, in which 41,710 cases were reported. Of the total cases, 77% were theft of motorcycles and 23% of vehicles (see table 9).
Automotive theft
In 2018, an increase of 1% (98 cases or more) was registered compared to 2017, from 9,746 thefts to 9,844 (see table 4). Likewise, three municipalities registered a greater increase in Bogotá (238 more thefts), Cali (124) and Bello (47).
Car theft was the modality with greater indicator 57.80% of cases (5,690), followed by carjacking with 29.20% (2875). 7.01% of the thefts (690) happened by factor of opportunity.
In 49.62% of the cases (4,885) the master key was the item used with the highest record. The firearm was used in 26.49% of thefts (2,608).
In the validity of year 2018, three departments registered a greater decrease in car theft, Antioquia (268); Atlántico (119 less) and Nariño (48). On the other hand, departments with a significant increase were Cundinamarca (218 more) and Valle (54) (see Table 9).
The most stolen make was Chevrolet with 33.7% (3318), followed by Mazda with 13.96% (1,375), Kia with 11.49% (1,131) and Renault with 9.24% (910).
Motorcycle theft
In 2018, the theft of motorcycles increased 2% (672 more cases) compared to the previous year, because it went from 31,994 thefts in 2017 to 32,666 by 2018. Similarly, four municipalities in the country had higher index: Medellín (827 more); Bogotá (575); Bello (159) and Bucaramanga (139).
The Modality with highest register was theft with 53.06% of the cases (17,337), followed by carjacking with 35.19% (11,498). In 9.86% of thefts (3,221) happened by factor of opportunity.
In 37.37% of cases (12.212) the master key was used. In 29.93% of the thefts (9778) firearms were used and in 23.85% (7792) no weapons were used.
The most stolen brand was Bajaj with 34.45% (11,257), followed by Yamaha with 21.26% (6946), Honda with 12.11% (3957) and Suzuki with 9.98 % (3,261).
By the end of the year 2018, three departments registered a decrease in theft of motorcycles: Antioquia (1,043 less thefts); Santander (283) and Magdalena (129). While the departments with the highest increase for that period were Valle (505); Guajira (252) and Atlántico (229) (see table 9).
Kidnapping
This crime recorded a decrease of 11.28% compared to 2018 (22 less cases), because it went from 195 kidnappings in 2017 to 173 in 2018 (see Table 4).
In the same manner, five municipalities show a significant increase in kidnappings: Medio Atrato (6), Santander de Quilichao (5); Cúcuta (4) Santa Marta (4) and Teorama (4).
With 61.93% of the cases (109), the kidnapping with economic demand was the modality with the highest rate, followed by the selective one with 27.27% (48).
In 75% of cases (132) the firearm was the most widely used means, while in 18.1% (32) no weapons were used.
53.98% of kidnappings (95 cases) were recorded in rural areas and 46.02% (81) in urban areas.
78.41% of the victims were men (138) and 21.59% women (38)
For the end of year 2018, three departments decreased in kidnappings: Valle (20); Caquetá (6) and Putumayo (4). While Arauca (8); Chocó (7) and Magdalena with (7) increased in the period of the analysis (see graph 7).
Extortion
This crime presented an increase of 27.44% (1,518 more cases), going from 5,532 cases in 2017 to 7,050 in 2018 (see Graph 4). 16.74% (1,180) of the complaints were registered in Antioquia and in the departments of Cundinamarca (14.60%) and Valle (9.72%). The department of La Guajira presented a significant reduction compared to 2017, from 132 cases to 97 (35 less), followed by Chocó (15 less) and Caquetá (14 less). Likewise, 80% (5,635) of the recorded cases concentrated in 14 political departments (see graph 16).
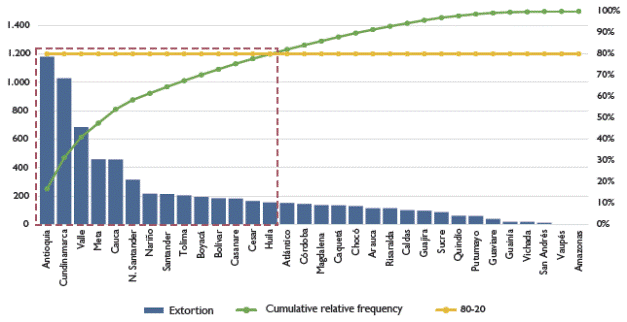
Source: SIEDCO Information, National Police 2018. Own elaboration 2019.
Graph 16 Pareto Chart - Extortion by political departments, 2018
Of the capital cities, 31 of them reported complaints of extortion (except Mitú) grouping 49.56% (3,494) of the cases nationwide; Bogotá with 10.81% (762 cases) had the highest participation, followed by Medellín with 8.21% (579), Cali with 4.31% (304), Villavicencio with 3.06% (216) and Popayán with 1.99% (140).
Comparing the months of January and December of the year 2018, from the 5 cities that registered the greatest number of cases by extortion, a displacement with a tendency to decrease between 14.29% (5 less) was observed, for the case of Medellín, and 54.84% (34 less) for Bogotá; moreover, in these cities, the total cases per month had a maximum of 91 (July in Bogotá) and a minimum of 6 events (December in Villavicencio) (see graph 17).
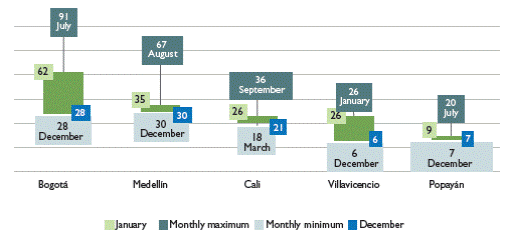
Source: SIEDCO Information, National Police 2018. Own elaboration 2019.
Graph 17 Extortion behavior in 5 capital cities, 2018
The means most used in the cases was the telephone call with 49.32% (3,477), followed by the direct one with 32.38% (2,283). The classical with 72.80% of cases (5130) was the modality of higher recording, followed by the one called uncle/aunt9 with 10.09% (711).
Private employees were the most affected with 45.45% (3,204), followed by merchants with 19.50% (1,375) and people with independent activities with 10.33% (728). In the same way, 84.82% (5,980 cases) of extortion were carried out in the urban area and 15.18% (1,070) in the rural sector.
Regarding sex, 62.65% (4,417) of the victims were men, and women with a 34.13% (2,406); In addition, 3.22% (227) did not establish the identity of sex. In the age range, a concentration was recorded in people aged between 35 and 44 years of age who represent 27.67% (1. 950) of the total cases (see graph 18).
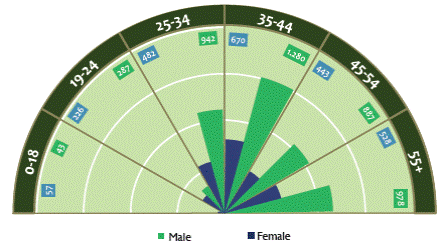
Source: Information SIEDCO 2018 National Police. Own elaboration 2019.
Graph 18 Age range and sex of extortion victims, 2018
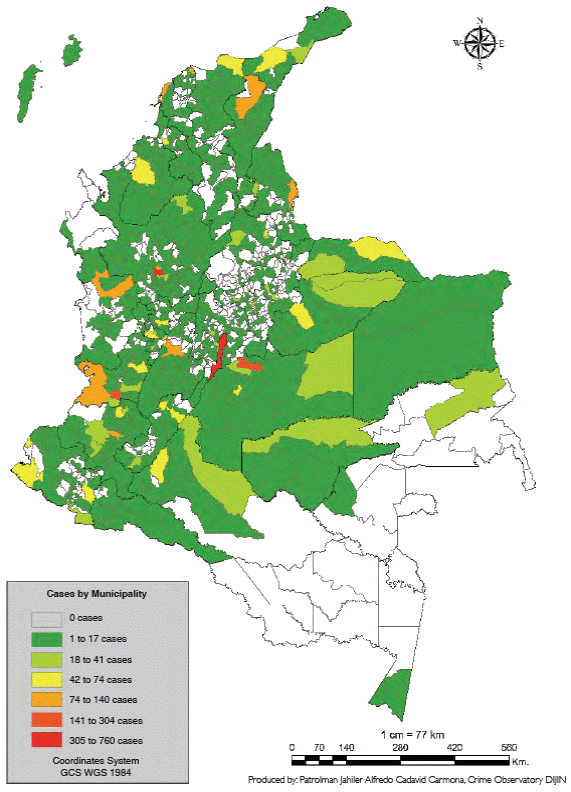
Map 5 Extortion at National level by political department, 2018
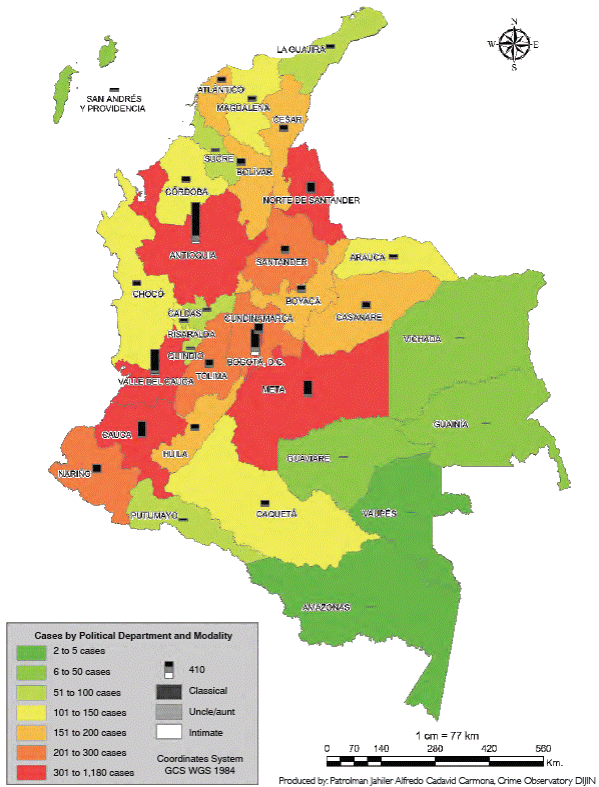
Source: Information SIEDCO National Police 2018. Own elaboration 2019.
Operational activity of the National Police of Colombia
The National Police reports for this period the operational activities deployed at the national level, as a result of institutional efforts and the implementation of strategies aimed at improving citizen security and the police service, together with it, reports the captures made under the titles of the Criminal Code and the results of actions implemented to recover automotive and motorcycles and the seizure of firearms and narcotics.
Captures
During 2018, the National Police registered 242,050 captures, of which 27.04% (65,444) were made for drug trafficking, manufacturing or carrying, 13.34% (32,301) for theft from people, 7.66% (18,542) personal injury, 6.23% (15,072) for manufacturing, traffic, carrying or possession of firearms, 5.87% (14,2019) for theft from commercial entities, 4.88% (11,806) for domestic violence, 4.15% (10,033) for receiving stolen property, 3.34% (8,080) for the use of fake document, 2.39% (5,777) for homicide and 2.29% (5,541) for conspiracy, what represents 77.18% of the total captures recorded in the analyzed period (see Table 20).
The city of Bogotá and 15 departments recorded 52.92% of the total captures: Bogotá 18.53% (44,861), Valle 6.86% (16,598), Santander 6.02% (14,574), Norte de Santander 3.03% (7,340), Huila 2.83% (6,858), Meta 2.57% (6,229), Tolima 2.48% (5,996), Nariño 2.46% (5,964), Magdalena 2.02% (4,894), Risaralda 1.89% (4,574), Sucre 1.75% (4,245), Quindío 1.53% (3,712), Putumayo 0.59% (1,431), San Andrés 0.17% (423), Vichada 0.10% (236) and Vaupés 0.06% (154) (see Table 20).
Firearms seized
For 2018, the National Police was able to seize 22,314 firearms. Of the weapons seized for the validity of the year of the analysis, 91.66% (20,454) were illegal and 8.34% (1,860) had the respective permit. This suggests that in comparison with the year 2017 (21,644) there is a decrease in 5% (1,190) of less seized weapons that had illegal origin.
Recovered Automotive
In 2018, the recovery of 3,661 automotive that had been stolen under different modalities nationwide was achieved (see table 21). Bogotá was the city that registered the highest recovery of automotive with 19.78% (724), as for the departments were: Antioquia 13.14% (481), Valle 11.58% (424) and Cundinamarca 8.88% (325) (see table 28).
The month with the highest number of automotive recovery was January with a 10.87% share (398), followed by February 10.11% (370).
Motorcycles recovered
During the term of 2018, the National Police achieved the recovery of 11,232 motorcycles (see table 21). The departments in which there was an increase in recovery were: Antioquia with 16.87% (1,895) of the total recoveries nationwide, Valle 10.66% (1,197) and Cauca 10.30% (1,157) (see table 29).
The months with a significant number of recoveries were January with 10.54% (1,184) and May 10.49% (1.178) (see table 29).
Final considerations
There is no single right way to fight crime. Neither is there a replicable theory that shows the absolute truth as for prevention of crime. What has no doubt is that violence and criminal activities entail a loss of welfare in society, resulting in a negative impact on quality of life of the inhabitants of each territory. It is also clear, that for Latin America and the Caribbean, crime is a growing problem with different dimensions in each of the countries and that if you want to think about the development of these economies, it is urgent to mitigate criminal activity to enjoy the benefits of peaceful territories, which attract foreign investment, which tend to reduce inequality and generate social mobility opportunities for the lowest levels of society.
In summary, in terms of criminality, the number of registered crimes has not had a growth proportional to the number of inhabitants; however, there is evidence of less respect for life, since the crime of homicide is more associated with other criminal behaviors.
In line with the above, Winton (2014) points out how in Central America, for example, it is considered that a first round of extremely drastic punitive measures has accelerated and diversified gang crime rather than reducing it. However, in recent years, there seems to be evidence that softer and more community oriented initiatives receive some support, in other words, more carrot than stick.
Among the interventions that appear to have had a positive impact, there are a range of activities, including the voluntary collection of weapons, temporary restrictions on carrying firearms and alcohol bans, improvement and new infrastructure projects in slums and education and public health initiatives focused on at-risk youth. These initiatives called "second generation” are based on a new conceptual consensus within the public policies, which are being promoted largely by development agencies working in the region.
Looking at a different from economic and social nature interventions perspective, which will have medium and long term effects for the mitigation of criminal actions in the short term, information and communication systems, as well as investment in technology are aspects that play an important role in formulating plans and programs for focusing and anticipating crime. Likewise, the need to continue feeding and supporting interinstitutional initiatives is highlighted, with an aim to improving underreporting in order to have elements which allow analyzing, focusing and making solidly informed decisions.
Moreover, this document leaves the curiosity for another investigation on how crimes should be analyzed in a not isolated manner, meaning it is not surprising that in places where micro-trafficking of narcotics stands out, it also coincides with homicide, different modalities of thefts, quarrels, among others. The strategies proposed to reduce, contain and prevent crime should focus on areas of criminal behavior and seek the possible correlation of behaviors that lead to the materialization of other illegal and even more serious acts in the Criminal Code.
On the other hand, information systems play an important role in the plans and programs formulation for targeting and anticipation of crime, which must continue to be nurtured and supported so interagency initiatives improve underreporting to analyze, focus and take informed decisions.
Therefore, in terms of criminality, the number of crimes has not increased proportionally with the number of inhabitants; however, there is less respect for life, since the crime of homicide is increasingly associated with other criminal behaviors.
The strategies proposed to reduce, contain and prevent crime should focus on areas of similar criminal behavior and the correlation of behaviors that lead to the materialization of other.
Common thefts (people, residences, commerce) and homicide are crimes that significantly affect citizens in all the cities of the country, both personally and economically and with this a decline in the perception of security, especially in the densely populated territories, where a large number of floating population stands presenting a myriad of unsatisfied basic needs, leading to a certain number of people being permeated by criminals and linked to crime.
Referencias
Alfaro-Beracoechea, L., Puente, A., Da Costa, S., Ruvalcaba, N. & Páez, D. (2018). Effects of fear of crime on subjective well-being: A meta-analytic review. European Journal of Psychology Applied to Legal Context, 10(2): 89-96. [ Links ]
Becker, G. S. (1968). Crime and Punishment: An Economic Approach. Journal of Political Economy, 76(2): 169-217. https://doi.org/10.1086/259394 [ Links ]
Chalfin, A. & McCrary, J. (2017). Criminal deterrence: A review of the literature. Journal of Economic Literature, 55(1): 5-48. [ Links ]
Cohen, J., Gorr, W. L. & Olligschlaeger, A. M. (2007). Leading indicators and spatial interactions: A crime‐forecasting model for proactive police deployment. Geographical Analysis, 39(1): 105-127. [ Links ]
Corman, H. & Mocan, N. (2005). Carrots, sticks, and broken windows. The Journal of Law and Economics, 48(1): 235-266. [ Links ]
Durkheim, Émile (1893). De la división del trabajo social. Schapire editor. Buenos Aires, 1973. [ Links ]
Eck, J. (2003). Police problems: The complexity of problem theory, research and evaluation. Crime Prevention Studies, 15, 79-114. [ Links ]
Ehrlich, I. (1973). On the relation between education and crime. Education, Income, and Human Behavior, 81(3): 313-338. https://doi.org/10.1086/260058 [ Links ]
Glebbeek, M.-L. & Koonings, K. (2016). Between Morro and Asfalto. Violence, insecurity and socio-spatial segregation in Latin American cities. Habitat International, 54: 3-9. [ Links ]
González Vidaurri, A. & Sánchez Sandoval, A. (2008). Criminología (2ª edición). México: Editorial Porrúa. [ Links ]
Jaitman, L. (2017). Los costos del crimen y de la violencia: nuEva evidencia y hallazgos en América Latina y el Caribe. Monografía del BID: New York. http://dx. doi. org/10.18235/0000615. [ Links ]
Jones, G. A. & Rodgers, D. (2015). Gangs, guns and the city: Urban policy in dangerous places. In The city in urban poverty (pp. 205-226). Springer. [ Links ]
Kuroki, M. (2013). Crime victimization and subjective well-being: Evidence from happiness data. Journal of Happiness Studies, 14(3): 783-794. [ Links ]
Mello, S. (2019). More COPS, less crime. Journal of Public Economics, 172: 174-200. [ Links ]
Paternain, Rafael (2007) La teoría de los cuatro escalones: Violencia, criminalidad e inseguridad. Documento de Trabajo 80, Facultad de Ciencias Sociales, Universidad de la República. Disponible en http://www.fcs.edu.uy/archivos/DocTrab80_La%20teor%C3%ADa%20de%20los%20cuatro%20escalones.pdf>. [ Links ]
Sherman, L. W., Gartin, P. R. & Buerger, M. E. (1989). Hot spots of predatory crime: Routine activities and the criminology of place. Criminology, 27(1): 27-56. [ Links ]
Winton, A. (2014). Gangs in global perspective. Environment and Urbanization, 26(2): 401-416. [ Links ]
Wolff, M. J. (2015). Building criminal authority: A comparative analysis of drug gangs in Rio de Janeiro and Recife. Latin American Politics and Society, 57(2): 21-40. [ Links ]
Received: June 25, 2019; Revised: July 02, 2019; Accepted: July 09, 2019


 texto em

