


Services on Demand
Journal
Article
 English (pdf)
 Article in xml format
 Article references
 Send this article by e-mail
Indicators
-
 Cited by SciELO
 -
 Access statistics
Related links
-
 Cited by Google
 -
 Similars in
SciELO
Similars in
SciELO -
 Similars in Google
Share

 Permalink
Revista Lasallista de Investigación
Print version ISSN 1794-4449
Rev. Lasallista Investig. vol.13 no.1 Caldas Jan./June 2016
Simulation-optimization model to determine the installed capacity of an educational services system*
Modelo de simulación-optimización para determinar la capacidad instalada de un sistema de servicios educativo
Modelo de simulação-otimização para determinar a capacidade instalada de um sistema dos serviços de ensino
Cristiam Andrés Gil González**, Pablo César Manyoma Velásquez***, Juan Pablo Orejuela Cabrera****
* The research article is derived from the master's dissertation.
** Doctorado en Sistemas de Ingeniería (e), Facultad de Ciencias Físicas y Matemáticas, Universidad de Chile. e-mail: cristiam.gil@ing.uchile.cl.
*** Doctor en Ingeniería Industrial. Universidad del Valle, Colombia. Profesor tiempo completo. Escuela de ingeniería Industrial. Co-Investigador. Grupo de Investigación: Logística y Producción. e-mail: pablo.manyoma@correounivalle.edu.co.
**** Magister en Ingeniería Industrial. Universidad del Valle, Colombia. Profesor tiempo completo. Escuela de Ingeniería Industrial. Co-Investigador. Grupo de Investigación: Logística y Producción. e-mail: juan.orejuela@correounivalle.edu.co.
Autor para correspondencia: Juan Pablo Orejuela Cabrera, e-mail: juan.orejuela@correounivalle.edu.co.
Artículo recibido: 09/06/2015; Artículo aprobado: 29/02/2016.
Abstract
Introduction. The problem of determining the capacity in service companies is the lack of clear methodologies. As for academic institutions, the research advances on the subject are even more reduced. The literature available has widely covered other problems affecting capacity, and also the programming and the planning of staff, facilities and schedules without directly measuring capacity. Objective. To create a generic methodology to determine the capacity of an educative services system (schools, universities, etc) in terms of the quantity of students to serve with the institution's infrastructure. Materials and methods. Firstly, a methodology to simulate the capacity used by the students throughout time is created. Then, with this information, an optimization model to calculate the maximum number of students that can be admitted is executed. Results. The model developed is applied in the Engineering School of Universidad del Valle, Colombia, where it was found that 25% more of students could have been admitted, using about 20 % of the capacity that can be potentially used. Conclusion. This methodological model is useful to know the capacity in terms of the number of students an institution can receive. It also facilitates midterm decisions, especially the measurement of the impact of the policies that can be formulated to favor the maximization of the service standards of the institution, and also, for instance, the impact of building new infrastructures.
Key words: Simulation, optimization, university, measurement, capacity.
Resumen
Introducción. El problema de la determinación de la capacidad en empresas de servicios, es la no existencia de metodologías claras. En cuanto a las instituciones académicas, los avances de investigación sobre el asunto son aún más reducidos. La literatura ha abarcado ampliamente otros problemas que afectan a la capacidad, así como la programación y planificación del personal, instalaciones y horarios sin llegar directamente a medir capacidad. Objetivo. Crear una metodología genérica para determinar la capacidad de un sistema de servicios educativos (escuelas, colegios, universidades, etc), en términos de la cantidad de estudiantes a atender con la infraestructura de la institución. Materiales y métodos. Primero, se desarrolla una metodología para simular la capacidad utilizada por los alumnos matriculados históricamente, posteriormente, con esta información, es ejecutado un modelo de optimización que calculará el número máximo de estudiantes a admitir. Resultados. El modelo desarrollado se aplica en la Facultad de Ingeniería de la Universidad del Valle - Colombia, donde se encontró que podría ser inscrito un 25 % más de estudiantes nuevos empleando alrededor del 20 % de la capacidad que potencialmente se puede utilizar. Conclusión. Este modelo metodológico es útil para conocer la capacidad en términos del número de estudiantes a atender por una institución, asimismo permite tomar decisiones en el mediano plazo, en especial medir el impacto de políticas a formular en pro de la maximización del nivel de servicio de la institución, como por ejemplo el impacto de la construcción de nuevos espacios físicos.
Palabras clave: Simulación, optimización, Universidad, medición, capacidad.
Resumo
Introdução. O problema de determinar a capacidade das empresas de serviços, é a ausência de metodologias claras. Quanto a instituições acadêmicas, o progresso da pesquisa nesta matéria é ainda menor. A literatura tem uma ampla cobertura de outras questões que afetam a capacidade, tais como programação e planejamento pessoal, instalações e horários, entre outros, sem chegar a medi-la diretamente a capacidade. Objectivo. Criar uma metodologia genérica para determinar a capacidade de um sistema de serviços de ensino (escolas, faculdades, universidades, etc.) em termos do número de alunos que podem ser servido pela infra-estrutura da instituição. Materiais e métodos. Em primeiro lugar, é desenvolvido um método para simular a capacidade utilizada pelos alunos matriculados historicamente. Com esta informação, é executado um modelo de otimização que calcula o número máximo de alunos a admitir. Resultados. O modelo desenvolvido é aplicado na Faculdade de Engenharia da Universidade do Vale - Colômbia, onde foi descoberto que podiam ser registados 25% mais estudantes utilizando cerca de 20% da capacidade que potencialmente podem ser utilizados. Conclusão. Este modelo metodológico é útil para conhecer a capacidade em termos de número de alunos que podem ser servidos por uma instituição, também permite tomada decisões ao médio prazo, especialmente medir o impacto das políticas formuladas no sentido de maximizando do nível de serviço da instituição, tais como o impacto da construção de novos espaços físicos.
Palavras chave: Simulação, otimização, Universidade, medição, capacidade.
Introduction
In 2000, Colombia had a higher education coverage rate above 13.82 % of the population (between 20 and 24 years of age); currently, this value is 36 % (Instituto Latinoamericano de Liderazgo, 2010). The proportion of higher education coverage by the public sector is merely 32 %, being the only option in many cases for most of the population (90.6 % of the inhabitants are classified with medium-low or lower socio-economic level), (Departamento Administrativo Nacional de Estadísticas, 2003). For the nation, the department of Valle del Cauca represents one of the most important regions in the development of higher education, given the fact it has 9.23 % of the total number of students enrolled in higher education programs and 8 % of the total number of students matriculated in the nation. Universidad del Valle outstands in the region due to its contribution along its 65 years of history, and until the second semester of 2008, it represented over 66 % of the requests for admission, 26 % of the total number of students enrolled and 44 % of the students graduated in the region.
Universidad del Valle has a headquarter and nine regional branches, comprised of seven faculties and two schools, which, by January 2010, contained around 70 academic programs and 29217 students enrolled; upon comparing this figure to that of the first semester of 2000 (17150 students), a 70.36 % growth can be observed. This growth was due mainly to changes in the student admissions process, from annual to biannual, since 2003. This decision did not necessarily mean increased investment in infrastructure, and this change generated problems in the offer of quotas per subject, in management of physical space and professors, thereby obligating the directors to discuss, again, the policy of semester wise admissions and to seek a methodology to measure its capacity.
Problem approach
In the service sector, companies are generally characterized by their diverse nature in terms of the amount of intangible products that can be offered and the variability in the use of resources for the operations involved in obtaining these products. Thus, techniques generally used for manufacture environments in most cases are not applicable to organizations dedicated to providing services on issues like capacity planning and control.
Specifically in the problem of determining the capacity in service companies, no clear methodologies exist. Important efforts have been undertaken in this topic, but the complexity of the service environment hinders the generalization of these works, even within the same production activities, making this a field with great potential for development. This phenomenon leads the necessity to discuss proposals that help to work in much more precise manner.
Regarding academic institutions, research progress on the matter is not broad. Literature has extensively encompassed other problems affecting the capacity, as well as programming and planning staff, facilities and production schedules without directly arriving to the measurement of capacity. Due this, a research initiative was originated to create a generic methodology to measure capacity in terms of the number of students that an educational service system can serve. This study only keeps in mind classroom resources and, thus, solves the following questions:
-
What is a student's capacity consumption?
-
What is the university's capacity availability for this resource?
By knowing these two elements, it is possible to answer the following research question: How many students can an educational service system serve with the physical resources available?
Capacity in educational institutions
Higher education is submitted to four levels: the central authority or national government, which restricts the budget, establishes strategic goals and governs the sector; institutions, which perform added capacity planning and seek the balance of services offered within the installations, according to budget limitations; basic units (faculties, departments, research centers) in charge of the administration of student quotas, according to a disintegration of capacity plans; and - lastly - individuals (students), who provoke the variability of the system and use up the capacity (Becher and Kogan, 1992).
The capacity in educational institutions is defined as the upper limit of the load in which a production unit can sustain its operation (Stevenson, 1999); understanding as production unit the faculties, schools, space in classrooms, available laboratories, administrative personnel, faculty personnel, and technological, computational, and bibliographical tools, among others (Johnson, 2001).
Institutions have a limited number of teaching facilities and resources that need to be efficiently used. This efficiency is generally referred as "utilization", which is basically the fraction of seat-hours or resource-hours currently in use (Burgess, 1996). According to Beyrouthy, Burke, Landa-Silva, McCollum, McMullan and Parkes (2006), in real institutions utilization can be surprisingly low, perhaps only 20 to 50%. To compensate this, when planning the amount of space capacity to be provided, directors overestimate the capacity, hence generating excesses.
According to Johnson (2001), the study of the capacity area in manufacturing is saturated by articles, while in the services sector the tendency has been growing, but it has initially only focused on administration of space and physical facilities. Regarding educational facilities, many proposals exist in literature with respect to investment in capacity: aperture, closure or expansion. Among these types of works we have: Greenleaf and Harrison (1987), Henig and Gerschak (1986), Pizzolato (1994), Tewari and Jena (1987), and Viegas (1987), but none of them seek to approach the term of capacity from their results but rather from the resources delivered as a multiple or a proportion of what is already built.
Usually, studies to determine capacity in educational institutions explore the capacity up to the departments or cost centers, without delving into the processes. It is evident that the problem of planning the capacity in departments is because these are broken down into more concrete specializations and disciplines, which are often rejected by the nature of the hierarchical and/or aggregated planning (Burgess, 1996).
Administration of educational institutions needs to estimate the demand to determine the number of students to serve during the following academic period, thus seeking to assign the budget for space in classrooms, new buildings, new personnel hiring and acquisition of bibliographic material, among others (Mueller and Rockerbie, 2005).
Organizations must plan on time for the acquisition, availability and use of the capacity, given the fact that this will lead to their mid- to long-term success. Frequently the fact of making decisions with respect to broadening the capacity requires strong capital investments to avoid competitiveness deterioration, but for this it is necessary to be especially careful because the new resources acquired may be underutilized at any moment (Krajewski and Ritzman, 2002).
Material and methods
To the next section, Methodology of measuring capacity, a Microsoft Excel (Version 2010) spreadsheet was structured to facilitate the simulation by using Microsoft Visual Basic (Version 7.0). Afterwards, the obtained data feed the resource optimization model described at the section called "resource optimization model", and programmed in the mathematical modeling software (LINGO 8.0). The computational time was around 10-hour in an equipment with Intel Core 2 Duo processor (2.2 GHz and 3 Gb RAM memory).
Methodology for measuring capacity
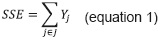
The elaboration of this methodology helps to determine of the adequate number of students an educational service system (SSE) can serve. This study is a refinement of the methodological model presented by Manyoma, Orejuela, and Gil (2011), which establishes the current capacity of an academic program, now thought for its application at a higher level (the Faculty of Engineering at Universidad del Valle).
To perform this estimation it is initially necessary to determine the number of students enrolled in each of the academic programs belonging to this faculty, as presented in equation 1 where each sub-index j represents an academic program.
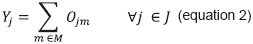
Also, the number of students enrolled in each academic program j will be defined as the sum of the number of students belonging to each academic semester m (0jm). As presented in Equation 2 the professional careers offered by the Faculty of Engineering imply taking subjects that are clustered into 10 semesters, which determines the range of sub-index m.
In determining the capacity in service systems, time is usually the resource limiting their offer. The adequate number of users that the system is capable of serving may be known through the quotient between total availability of time and the unit load that a typical user employs of the system. Within this context, in order to know the number of students enrolled in each semester of the academic program j during the period in course (0jm), in the first place we calculate the total capacity of resources used up by the students during the semester m (CTRjm) and then find the consumption of resources of a student belonging to that semester (CTRjm) as shown by the equation 3:
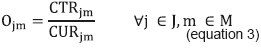
To solve the research problem, not only is it necessary to calculate these two elements (CTRjm and CURjm), but we must also find the number of students that could be admitted with that capacity that has not been employed to serve the users currently in the system (in the academic period in course).
Determination of the unit consumption of resources (CURjm)
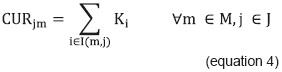
The unit consumption of resources of a student belonging to the academic program j and attending semester m, is composed of the sum of the unit loads of the subjects belonging to semester (Ki), as shown in equation 4:
At Universidad del Valle no standard exists in the capacity used up per student. Additionally, the flexibility presented by this institution hinders the calculation of the unit consumption of resources (CURjm). Capacity consumption does not occur per student, but per group enrolled in each subject (Gi), allowing each student to have a fragment of the weekly time required (Ti). This fragmentation may be carried out because predetermined group sizes exist for each subject (Gi), which means that each group programmed by subject is generally composed by a quota limit for students who can matriculate in it.
It is assumed that all groups have the same number of students. If the data of each group from the same subject are equal in their majority, the model is used and, in case the groups are similar but not equal, then the average is used, eliminating those data that deviate considerably from the mean. Under this postulation, the calculation of the unit load of a student in subject i (Ki) is expressed as the fraction of time corresponding to each student enrolled in a group of subject i, as shown by the equation 5:
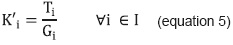
However, this expression in the way it is expressed is not sufficient to find the unit consumption of resources, because it would only represent those students who opted to register all the subjects belonging to that semester (ideal case) and in reality that event is not predominant; therefore, it is important to find typical students or students who are more representative of the system.
The methodology to measure the capacity of a faculty is based on the behavior of what is denominated as a "representative student" This individual personifies the average behavior of the population of students. This behavior is reflected in the processes of registering subjects in different semesters; the student uses the flexibility permitted by Universidad del Valle (fails subjects and/or makes decisions with respect to the mixture of subjects to take). Therefore, the capacity needed by the student is less than ideal.
To obtain the unit load of a representative student (Ki), as presented in Equation 6 it is necessary to understand that such student consumes capacity even if he/she has not enrolled subject i, given that he/she is an average student and, therefore, he/she gets the corresponding capacity fraction with respect to an "ideal student".

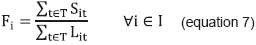
This fraction has been defined as the effective rate of enrollment of the subject i (Fi). It is the percentage of students who enrolled in the subject with respect to those students who had the possibility to enroll. The "effective rate of enrollment" of subject i (Fi) is estimated from historical data. For its calculation (equation 7), the information required is the number of students who have enrolled in subject during different academic periods (Si) and the number of students with potential to register that subject in the same academic periods (Li).
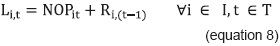
Students fit to register subject i (Li) is the number of students who satisfy all the requirements (pre-requisite subjects) to register subject i. To calculate this parameter, we need to know both the amount of repeating students (Ri) and the amount of students who have the option of registering the subject for the first time (NOPi), and the equation 8 is used:
"New students", with option (NOPi), consists of the amount of students who can matriculate subject i for the first time. This means they had not enrolled and/or passed, so far, all the prerequisite subjects of subject i (equation 9). For subjects belonging to the first semester, given that they do not have pre-requisite subjects that restrict their registration, all of the students who have the option for the first time to register them are those admitted to the academic program (equation 10).
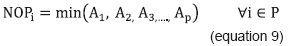
where p ∈ P (i) is the set of prerequisite subjecs of subjec i.
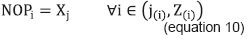
where Z is the set of subjec belong to academic semester 1.
It must be clarified that parameters Li and Si are, initially, data gathered from records (information system). However, these parameters need to be calculated in order to be subsequently used in the process to simulate the capacity in the Faculty of Engineering at Universidad del Valle. "Passing students" (Ai) means the expected amount of students who took subject i during period t and passed it at the end of the period. It is obtained from the difference between students enrolled (Si) and students who did not pass the subject (Ri) (equation 11).

"Repeating students" (Ri) is the amount of students who were enrolled during the previous period in subject i (for better clarity use subindex t-1) and did not pass it. For effects of the methodology, this value (equation 12) is a fraction of the students enrolled in the subject and it is denominated as "percentage of failures" (Pi).

The "percentage of failures" (Pi) is the rate of students failing the subject i (Ri) with respect to all those students who enrolled the subject (Si). Pi, as well as the "effective rate of enrollment" (Fi), is data based on records, which is why for its calculation information is gathered from different academic periods, as shown in the equation 13:
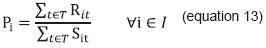
Si represents all the students enrolled in a subject, all those individuals who actually consume capacity. Therefore, this parameter will be explained in the component of the total capacity consumed per semester, in the following section.
Determination of the total capacity consumed per semester (CTRjm)
Many resources exist in an educational system that could limit its capacity. The most important are probably hours-professor and the physical spaces allocated for teaching (commonly classrooms, although this classification may also include sports scenarios and laboratories, among others).
The development of this study focuses on the restrictions of capacity in physical space under which the educational system is subordinated, given the fact that it is the resource with the lowest flexibility. This means that the investment in infrastructure that the faculty should make is high, in order to adapt itself or to increase its capacity. Even if the availability of capital was not an inconvenience, the availability of facilities in the short term is indeed inconvenient, because their construction time lapse is not immediate. Hence, the system cannot respond rapidly to the needs of its demand.
Physical spaces are conditioned by two characteristics: the first is the capacity in terms of time availability and the second is the capacity of users that can be taken in by each facility, which is generally measured by the number of seats. These characteristics, altogether, generate inconveniences for the maximum use of the facilities, as the number of students programmed by a subject in one of these physical spaces is a selection process that has passed by different filters (pre-requisite subjects during different time periods) increasing the heterogeneity of the students entering together.
These particularities evidence the importance of having an optimization tool that guarantees the satisfaction of the needs in terms of resources (physical spaces) of the individuals in the system, while estimating the highest number of new individuals who could enter the system.
Therefore, the total resources capacity consumed for the subjects associated to each semester m for the academic program j depend on the number of hours these subjects are programmed in all the physical spaces, and its equation as presented in Equation 14:
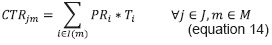
Ti means the weekly hours required for a professor to teach class sessions of subject i in a classroom and PRi is the amount of groups to be programmed, during the current academic period, of subject i. This number can be a decimal number because many academic programs share subjects in their curriculum and a fraction corresponds to each one; it is determined as the quotient between the expected number of students enrolled (Si) and the "group size" (Gi) of subject i, as shown in the following equation 15:
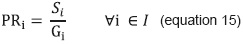
The expected number of students enrolled (Si) is the predicted amount of students taking subject i during the academic period in course; hence, they will use up hours of classroom and a professor, as resources. It is estimated from the equation 16:
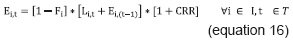
CRR is a percentage, which seeks to correct estimation in the methodology; it is calculated as the value that minimizes the variation between the actual data of those enrolled in academic programs versus the data found in the simulation.
The expected number of students not enrolled (Ei) is the amount of students who, complying with all the pre-requisites of subject I, decided not to register it during the academic period in course equation 17.
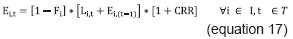
The initial values of Si and Ei during the simulation process are zero, because the lack of students enrolled during the first admission period of an academic program.
The development of the methodology upon finding both the total resource capacity consumed (CTRjm) and the unit consumption of resources (CURjm), are helpful to find the number of students enrolled in each academic semester (Ojm), these students should be guaranteed sufficiency in resources (physical spaces) and thereby determine those resources that could be employed to serve new students. However, until now we have no knowledge of the availability of these resources (capacity in seats and hours), which is why its measurement should be made as an input for its optimization.
Measurement of the resources available for a Faculty (RDFz)
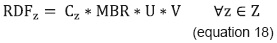
The physical spaces can be clustered into sets according to the characteristics they share, such as technological components, scientific components and, mainly, their capacity to take students inside (Wz). Each set is represented by sub-index z, which is a class mark. Clustering these elements helps to diminish the complexity of assigning hours, because this will allow the use of the optimization model in the physical spaces, with a lower number of elements and manage them in the best manner in terms of availability of time. The number of hours available per type of physical resource z for students in the Faculty of Engineeringis (RDFz) calculated by means of the Equation 18:
Where:
-
The amount of physical spaces type z (Cz) available is the set of classrooms and/or laboratories suitable to dictate class lessons of one or several subjects, which have similar characteristics.
-
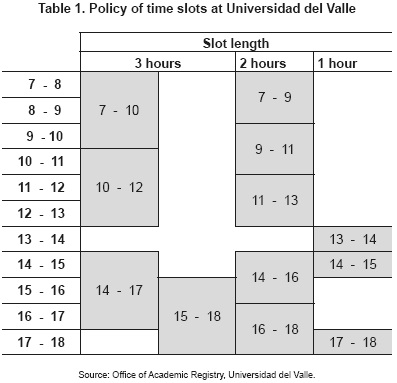
The "time threshold" (MBR) is the total of hours available on weekdays for a physical space type z. At Universidad del Valle, subjects can be programmed from Monday to Friday between 7am and 10pm (15 hours/ day). On Saturdays, classes are usually programmed between 7am and 1pm (6 hours/day). The value calculated for the time threshold (MBR) in our case study is 81 hours/week.
-
The "percentage of capacity available" for the Faculty of Engineering (V) is a parameter calculated from historical data and it is the proportion between the hours programmed of subjects for students belonging to the academic programs in the Faculty of Engineering, with respect to the hours programmed for students from all the academic programs that can use every physical space in the University.
-
The "global utilization rate" (U) is a para-meter based on the historical behavior of assigning hours to physical spaces. It is the percentage of total classroom-hours available that are used or could be used to program subjects from all of the faculties of the University.
The capacity of a system offering a mixture of products and/or services is clearly affected by their programming process in their production units; this research problem has been extensively studied by academics; however, it is not part of this project's research problem, for which parameter U is used to profile the efficiency of programming hours in classrooms.
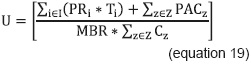
This implies including in the calculation of the parameter the total load generated by the academic programming of the institution studied (first sum of the numerator in equation 19), plus the sum of all those hours that had not been programmed but could be potentially used to give class sessions (it is called PACz); this has to be done following the university's policy of time slots (Table 1).
The calculation of the number of hours available per type of physical resource z for students from the Faculty of Engineeringis (RDFz) is one of the fundamental parameters that will feed the resource optimization model that will be discussed in the following literal, which seeks to maximize efficiency in the use of resources for the students currently in the system and, thus, offer greater coverage with students that could be admitted to the first semester of the same period.
Resource optimization model
The intention herein is to carry out the verbal and mathematical formulation of the model employed to optimize the capacity of the facilities of the educational services system and, also, describe and explain the model from the analysis of the objective function and constraints.
Parameters
Gi = Maximum size of a group to be programmed of subject i, determined by number of students to be enrolled.
Ti = Number of weekly class hours required by each group to be programmed in subject i in a physical space.
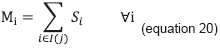
Mi = Expected number of students who will enroll in subject i. Are added all quotas required by the students belonging to all academic programs that must take the subject I (equation 20) are added.
Hiz = 1, if a physical type z is suitable (its capacity in terms of chairs and equipment) to schedule a group of subject i at. It is 0, if otherwise.
Bi = Minimum number of hours that must be programmed of a class session of subject i in a physical space.
Dj = Balance factor among academic programs to enroll students to semester 1. This parameter has the function of weighting student admissions to keep the mathematical model from assigning the remaining resources to only one or to a few academic programs.
PSij = 1, if the subject i must be enrolled by students of first semester of the academic program k. It is 0, if otherwise.
Fi = Effective rate of enrollment of subject i.
Variables
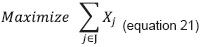
Xj = Number of students who can be enrolled to the first semester of academic program j.
Niz = Amount of time fractions of subject i that must be programmed to a type z physical space.
Li = Number of groups opened for new students from first-semester subjects.
HGiz = 1, if the subject i will use of the available hours of a physical type z. 0, otherwise.
Objective function
Constraints
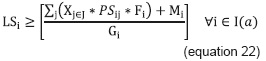
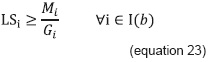
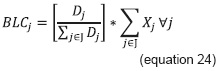
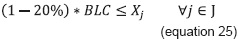
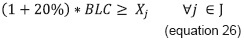
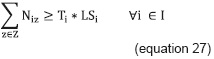
The objective function (equation 21) maximizes the number of students to be admitted in all the academic programs belonging to the educational system under study. Opening groups to satisfy the demand for places in subjects is guaranteed for the set belonging to the first semester I (a) with equation 22 and for the other subjects of the curriculum I(b), with equation 23. To avoid allocating resources available only to those academic programs with lower load consumption, equations 24, 25 and 26 are proposed, which seek to maintain a balance among academic programs in student admissions; arbitrarily, clearance of 20 % has been added for greater efficiency of resources in favor of the objective function.
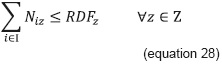
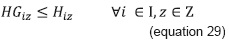
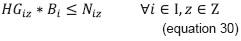
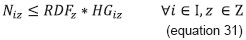
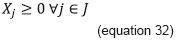
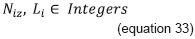
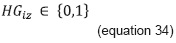
Equation 27 satisfies the hours required by all the groups programmed for subject i. Equation 28 limits the hours to be programmed in each type of physical resource with respect to the hours available therein. Equation 31 permits allocating hours of a type z physical resource whenever equation 29 permits its use due to its suitability in capacity and equipment. Equation 30 avoids the allocation of lower time fraction than those permitted for a class session, when a type z space is to be used. Equations 32, 33, and 34 represent the obvious constraint of nonnegativity and the type of expected value in the variables.
Case study
The Faculty of Engineering at Universidad del Valle is comprised of seven schools, one department, and one research institute, all of which offer 18 undergraduate programs, 13 of which are at the professional level and five are at the technological level.
The investigation conducted herein -methodology to measure capacity in educational services systems -focuses on the 13 professional programs offered by the Faculty of Engineering at Universidad del Valle, in order to determine the unit consumption of resources (CURjm) and the total capacity used up per program (CTRjm).
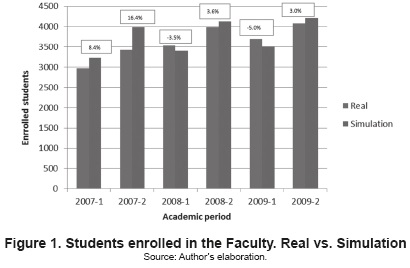
Prior to starting the simulation process along with the optimization model designed, a warmup process where cycles were executed to test the reliability of the methodological model developed was carried out. The routine used, as main input, the actual admission figures in each academic program of the Faculty of Engineering, seeking to compare the actual data of students enrolled to the data obtained through simulation. This information was obtained from the application of the system to prevent desertion of higher education (SPADIES), of the National Ministry of Education. A simulation cycle represents the transition between academic periods and processes implied therein like enrollment, failure of subjects and student admissions.
After reiterated tests, the CRR correction factor has been estimated at 1 %; with this value, it can be observed that after simulating the admissions process during the last 20 academic periods (since August-December/1999 until August-December/2009), the gap between the actual data and the simulated data stabilized and did not go above 5 % since the January-July 2008 period (figure 1).
Subsequent to each simulation cycle, the expected number of students enrolled in each subject i (Si) is consolidated in parameter Mi, to feed the resource optimization model (remember that many academic programs have common subjects). This consolidation helps to reduce the number of elements in set i from almost 600 to 392 subjects.
Universidad del Valle has 177 physical resources (classrooms and laboratories) available to program class sessions (data furnished by the Office of Academic Registry at Universidad del Valle). According to its capacity measured in seats (Wz), 15 types have been established along with their respective mavailability in number of spaces (Cz).
At Universidad del Valle subjects can be programmed from Monday to Friday, between 7am and 10pm (15 hours/day). Saturdays are usually programmed between 7am and 1pm (6 hours/day). Therefore, the value calculated for the time threshold (MBR) in our case study is 81 hours/week.
The value of the percentage of capacity available for the Faculty of Engineering was determined as 40.14 % of the total number of hours programmed; it was determined as the average value accumulated over the last 15 academic periods. This value varied during this time lapse between 36.58 % and 43.04 %, being quite consistent. The value of the global utilization rate was established as 92.69 % of the total available hours, where 19.65 % corresponds to time with the potential to program classroom hours (PACz) established from the policy of time slots.
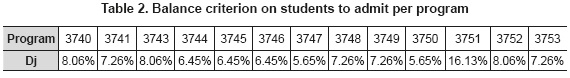
The balance criterion in student admissions to the first semester is shown in Table 2 and it is computed from the percentage weighting of new students from each program.
Hereinafter, we describe the main results obtained from the application of the methodology to measure capacity in a faculty in the detailed case study.
Results and discussion
After the warm-up process, where a state of the students enrolled through simulation similar to the actual state of the system is reached, 106 iterations were performed.
Each iteration was a simulation process that involved the transition of students enrolled in all of the subjects of an academic period to the following. Thereafter, the resource optimization model is activated where the number of groups to be opened for each subject is determined, the adequate physical spaces are allocated and the time available in them is distributed to maximize the admission of new students and the results are stored.
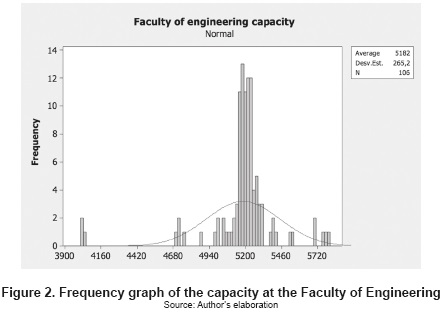
The main result yielded by the simulation optimization process can be observed in figure 2, which solves the main research question: can the Faculty of Engineering with the current available physical resources serve an average of 5182 students with a standard deviation of approximately 265 students? It is important to highlight that 85 % of the iterations were within the range of [4972; 5413] students, without significantly changing the mean found.
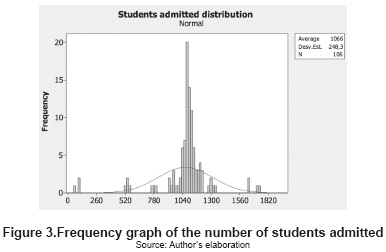
Whereon the average 1066 individuals of the students enrolled in each academic period in the Faculty of Engineering are recently admitted students. These data have a standard deviation of 248 individuals (figure 3).
The number of students with two or more periods in Universidad del Valle may be observed in figure 4, discriminated by professional academic programs. This data item is presented as a 95 % confidence interval.
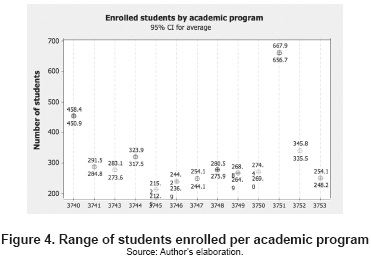
It may be noted that these intervals are stable, given the fact that the biggest difference presented between the upper limit and the lower limit does not surpass 11 students (Industrial Engineering Program) and where the program with the least number of students enrolled is Agricultural Engineering, with at least 212 individuals, suggesting that an estimation error would not be above 5 %.
Figure 5 shows the number of students admitted, discriminated by academic program; it is also shown a 95 % confidence interval. The magnitude of the number of students admitted is under the model of resource optimization and it is regulated by the constraint of the admissions equilibrium, which allows a proportional approach to the number of students admitted historically and diverging 20 %.
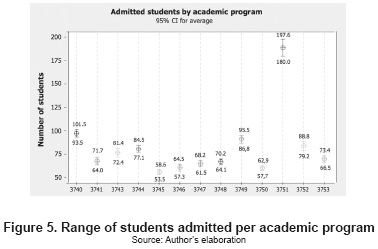
It is striking that a positive correlation exists between the number of students enrolled and the number of students admitted, which leads to the assumption that any increase in the amount of students admitted must be carefully pondered because the capacity to serve these new students within the system is not merely required during the current period, but necessary in future periods.
It must be defined if there are guarantees exist concerning the availability of resources (physical or financial) during following academic periods and, thus, carry out prospective actions to avoid negative repercussions at the service level.
Conclusions
In educational systems the problem of determining the capacity is approached by studying the institutions infrastructure capacity. However, other components exist, such as faculty staff, laboratories, libraries, university cafeterias, sports centers, medical service and technological equipment, among others, which must be considered when planning the educational service, as they are important for the quality associated to the service.
This research adopts the concepts of a type of student (which consolidates the population's consumption of capacity as an average behavior for undergraduate programs) and the concept of utilization developed by Manyoma, Orejuela, and Gil (2011), which deal the problem of programming time and spaces without addressing it, showing that these elements continue being measures in line for studies at higher levels (faculties). Additionally, it opens the possibility for subsequent research in other types of service industries.
Having capacity available during the current academic period to serve students enrolled at the university does not guarantee availability of capacity in the future; conscientious actions should be made, such as defining the volume of students to be admitted, their periodicity and opening subjects in terms of that periodicity.
This methodological and mathematical model is a good approach to the problem of a university's installed capacity, useful for decision making in the short- and mid-term, especially to measure the impact of formulating diverse policies to maximize the institution's level of service, like the construction of new physical spaces, appropriate capacity in seats of those physical spaces and group sizes for the subjects.
The development of this document is based on the analysis of a specific case: the Faculty of Engineering at Universidad del Valle. However, the methodology developed has been thought in a generic manner and may not only be applied to other faculties and universities, but also to educational establishments of diverse types like elementary schools, high schools and technical and technological formation institutions that may have limitations in managing physical resources.
This paper is presented as a robust tool with basic information requirements, which can be obtained from the information system in any institution wishing to apply it and which has some history with data such as: number of students enrolled, number of failed students, pre-requisites of courses or subjects, amount of physical spaces available, and its capacity to accept a number of students.
Bibliographic references
Becher, T. and Kogan, M. (1992). Process and Structure in Higher Education. London: Routledge. [ Links ]
Beyrouthy, C., Burke, E., Landa-Silva, D., McCollum, B., McMullan, P. and Parkes, A. (2006). The teaching space allocation problem with splitting. The 6th international conference for the practice and theory of automated timetabling. Czech Republic: Brono. [ Links ]
Burgerss, T. (1996). Planning the academic's workload: different approaches to allocating work to university academics. Higher education, 32, 63-75. [ Links ]
Departamento Administrativo Nacional de Estadística (2003). Encuesta calidad de vida 2003. Recuperado el día 22 de septiembre de 2009. www.dane.gov.co. [ Links ]
Greenleaf, N. and Harrison, T. (1987). A mathematical programming approach to elementary school facility decisions. Socioeconomic planning sciences, 21, 395-401. [ Links ]
Henig, M. and Gershak, Y. (1986). Dynamic capacity planning of public schools in changing urban communities. Socio- economic planning sciences, 20, 319-324. [ Links ]
Instituto Latinoamericano de Liderazgo (2010). Evolución de la Educación Superior en Colombia en la última década. Recuperado el día 21 de septiembre de 2010, www.universidad.edu.co. [ Links ]
Johnson, D. (2001). Lessons learned from industry: applying capacity planning in an institution for higher education. Managerial finance, 27, 17-32. [ Links ]
Krajewski, L. and Ritzman, L. (2002). Operations management: strategy and analysis (6th edition). Prentice-Hall. [ Links ]
Manyoma, P., Orejuela, J., and Gil, C., (2011). Methodology to determine the installed capacity in an academic program. Estudios gerenciales, 27 (121), 143-158. [ Links ]
Mueller, R. and Rockerbie, D. (2005). Determining demand for university education in Ontario by type of student. Economics of education review, 24, 469-483. [ Links ]
Pizzolato, N. (1994). A heuristic for large size p-median location problems with application to school location. Annals of operations research, 50, 473-485. [ Links ]
Stevenson, W. (1999). Production operations management (6th edition). Boston: McGraw-Hill. [ Links ]
Tewari, V. and Jena, S. (1987). High school location decision making in rural India and location-allocation models. In: Ghosh, A. and Rushton, G., Spatial analysis and location-allocation models (137-162). New York: Van Nostrand Reinhold. [ Links ]
Viegas, J. (1987). Short and mid-term planning of an elementary school network in a suburb of Lisbon. Sistemiurbani, 1, 57-77. [ Links ]

