


 Inglés (pdf)
 Articulo en XML
 Referencias del artículo
 Enviar articulo por email
 Citado por SciELO
  Citado por Google
  Similares en
SciELO
Similares en
SciELO  Similares en Google
 Permalink
Introduction
Companies develop actions that affect internal and external users with accurate, timely, and important information that supports organizational decision-making. This also helps to identify and manage numerous interrelated processes, analyze and consistently follow up the development of the processes as a whole. It also enables the continuous improvement of results in the different functions of the organization through elimination of errors and redundant processes (Orellana, Sanchez & Gonzalez, 2015).
There are mining techniques that provide new means to discover, monitor, and improve processes in a variety of application domains (Van Der Aalst, 2013). The selection of the techniques for data analysis that allows the delivery of information to be converted into knowledge for decision-making requires deep knowledge of the properties or characteristics of each of the techniques and of when to apply them to a particular set of data.
This is why it is necessary to implement a conceptual model that shows the features and functionality specific to the most relevant techniques for associating or relating variables.
The model shows each technique's fundamental properties and their functionality for discovering frequent and interesting patterns or variables relationships. The model was obtained with the characterization of two techniques, apriori and logistic regression, establishing their fundamental attributes or characteristics, and the flow of information from the methods in each case.
Knowledge Discovery in Databases (KDD) is composed of three stages: the understanding of the business and its data, the carrying out of the pre-process tasks, and the actual data mining and reporting. KDD is an interesting process of extraction of useful and valid patterns from data. The large volume of data makes KDD and data mining a matter of great importance and necessity. Given the recent growth of the field, it is not surprising that a wide variety of data mining methods are now available to be applied by researchers and practitioners (Graco, Semenova & Dubossarsky, 2007). As an example, association rules constitute an important data mining task (Yang, 2013). DM is a particular step in KDD process involving the application of specific algorithms for extracting patterns (models) from data (Vashishtha et al., 2012). This is an essential process where intelligent methods are employed to extract data patterns (e.g., association rules, clusters, classification rules, etc.) (Xu et al., 2014). Data mining is defined as an automated process of knowledge discovery from large volumes of data. The process involves three disciplines: the databases that provide complex data structures, Statistics, and Artificial Intelligence (AI). It also includes obtaining prior knowledge and recognizing patterns hidden in the data. This refers to finding hidden or implicit information that cannot be obtained using conventional statistical methods. The mining process is based on the analysis of records from operational databases, also known as Data Warehouses (DW) (Moine et al., 2011). Data mining is the process of establishing extraction patterns, often previously unknown, which are found in large amounts of data, using the technique of matching similar data or other reasoning techniques. It has many applications in the field of national security, and is also applied in providing solutions such as intrusion detection and auditing (Singh et al., 2011). The resulting set of data is far too big for manual analysis; then, algorithms for automatically discovering potential information are developed. One of the major tasks in this DM area is association rules. An association rule (AR) is an implication of the form X Y, where X and Y are two item sets (Schluter & Conrad, 2010). In the process of data analysis, data mining seeks to organize the relationships identified by patterns between the relational fields of large databases. It leads to the discovery of knowledge and is composed by business intelligence, data requirements identification, modeling and verification (Marban et al., 2009). In general, data mining is considered to be the complex form of extraction of implicit, previously unknown and potentially useful information from data. It is also understood as a process of transforming existing knowledge into data in other understandable formats, such as association rules (Luo, 2008). Data mining techniques include classification, association and grouping, which are used to extract data from norms and clearly defined patterns. These techniques involve specialized algorithms, responsible for facilitating exploration, processing and generation of specific models (Wang et al., 2010). Data exploration and processing involve data mining algorithms that can interrogate the meta-data and the meta-knowledge that are linked to the data points. This requires two key components: a series of tools and techniques, and the knowledge of experts. Data mining is the core of the KDD process, which implies the inference algorithms that explore data, develop the model and discover already known patterns. The model is used to facilitate data analysis, and to make predictions of future events (Li & Ye, 2006). Data mining techniques can be used to discover useful patterns which, in turn, can serve for the classification of new data, among other purposes. The data mining algorithms for processing large amounts of data must be scalable (Yang, 2010). Association rules are a powerful data mining technique, which, by means of data sets, are used to search for rules that reveal the nature of the relationships or the nature of the associations between the data of entities. The resulting association can be used to filter and analyze the information, and possibly to define a prediction model based on behavior observation (Thuraisingham, 2009). The discovery of association rules is an important task. The most common methods to do this are Apriori, FP-growth and genetic algorithms. In general, these algorithms focus on discrete information, although, in reality, most data sets are made up of both discrete and continuous attributes (Bora, 2011). An association rule is composed of a premise and a conclusion. Both the premise and the conclusion are variables, i.e., an identifier or a code to a variable or attribute of a set of transactional data. The number of variables that appear as premise or conclusion can be one or N, but a rule of association must not be zero both in its premise and its conclusion.
The premise is always set to the left side of the rule, and the conclusion to the right side. Both variables are related to an implication, for example: A as a premise, and B as a conclusion. This reads as A implies B.

The process of exploring, processing and generating models with association rules can result in the loss of original information, known as missing data, and generate errors in the rules (Storti, 2010).
Materials and methods
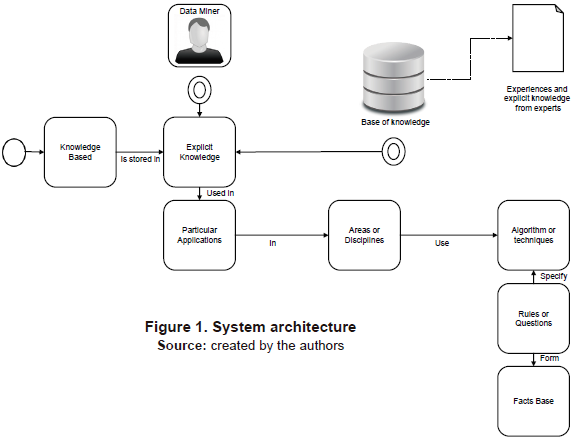
This model is the input for the implementation of a knowledge-based system that allows to emulate a human expert's knowledge related to decision-making when choosing a data mining technique for a particular problem. It specifically provides the knowledge basis with the explicit knowledge of some techniques and their application in different areas (Figure 1).
Apriori Algorithm
This technique takes the set of registers (training data) and explores them to determine which have frequent patterns and generate association rules. Firstly, data is selected from the initial transactional set. Subsequently, the system determines the individual frequencies of each element in the database, i.e., each Item. This is done until all the Item Sets are evaluated. After discarding the less frequent items, the system works with the more frequent ones, generating a new database (new collection of transactions). The next step is to establish relationships (couples) between the items not discarded, i.e., the more frequent ones. With the couples thus generated, frequencies are determined again, i.e., which couples have a higher frequency; then those with a lower frequency are discarded, and a new collection of records with those that have not been discarded is generated. The process continues creating relationships between three items and evaluating those relationships until it has cleared the entire set of transactions.
The rules are easily interpreted by using YES/NO decision-making levels. They complement each other as a good visualization tool, giving the user the possibility to reconstruct the "reasoning" of the results. After setting the confidence parameter to generate the Rules model, the user will notice - most of the times-that the partial loss of understanding will be more than compensated by the quality of the predictions (Vashishtha et al., 2012).
Association rules analysis is a technique to uncover how items are associated to each other. There are two common ways to measure association:
Support: this indicates how popular an itemset is, as measured by the proportion of transactions in which it appears.
Support {item} = Itemset appears / Itemset Confidence: this indicates how likely item Y is purchased when item X is purchased, expressed as {X -> Y}. This is measured by the proportion of transactions with item X, in which item Y also appears. Confidence {X -> Y} = support {X -> Y} / support {item}
Logistic regression algorithm
Data processing with the logistic regression technique starts by identifying the dichotomous variable and the independent variables. This data is stored in a data structure or table. Then the values for the dependent variable are established, and the data is sorted from lowest to highest according to the independent variables that are part of the process.
Input values (x) are combined linearly using weights or coefficient values (referred to as the Greek capital letter Beta) to predict an output value (y). A key difference from linear regression is that the output value being modeled is a binary value (0 or 1) rather than a numeric value.
Below is a logistic regression equation example:

Where y is the predicted output, b0 is the bias or intercept term and b 1 is the coefficient for the single input value (x). Each column in the input data has an associated b coefficient that must be learned from the training data.
A graph allows us to identify, at a glance, trends in time or relationships between two measurements of a phenomenon. Further, it is not clear that our own abilities can achieve, with the same efficiency, the task of analyzing the trillions of electronically stored data when monitoring commercial transactions in a database (Xu et al., 2014).
Results
KNOWLEDGE-BASED MODEL
The model is presented as a guide for data mining project analysts and creators, specifically as a support in deciding which algorithmic data mining technique (association technique) to apply according to the characteristics or nature of the project.
The contribution of the model appears in the operational phase of the KDD life cycle information. At this stage it is necessary to apply a technique to perform the information analysis process found in the Analytical Database, or Data Warehouse.
The model facilitates understanding of the functionality and features of the two association techniques described in this work, their components, their information flows, and their relationships between objects. Therefore, it benefits those involved in and responsible for the project to decide which algorithmic technique is well suited to obtain a model and interpret the data and statistical graphics generated by the technique.
The mere fact of discovering the most appropriate technique requires the project analysts to test data from different algorithms and subsequently analyze the results to see if they are successful with respect to the requirements. In case of failure to comply with the requirements, it is necessary to apply another technique and repeat the process.
Model Components
The conceptual model is composed of objects. Each object has an identifier, attributes and methods. The identifier permits the specification of each item; the attributes enable to establish the characteristics or nature of the object; and the methods determine the actions carried out by the objects within the model. That is what determines the data flows coming in and out of those objects (Figure 2).

The model is equally composed of information flows, through which the necessary data can travel to feed other objects. Another component of the conceptual model is the diamond-shaped decision maker, which allows to decide whether to use the objects that describe the features and functionality of the logistic regression algorithmic technique or the Apriori technique.
Functionality of the Model
The conceptual model shows the flow of information between the techniques offered by the two algorithmic data mining models: association rules and logistic regression. The conceptual model is composed of objects, each one of which indicates the name, features, and functionality of the techniques.
Each of the algorithmic models has techniques as options, which allow to view the data in statistical or graphic terms.
The object located at the upper left corner corresponds to the data source. This indicates the population-based sample or the training sample to feed one of the two algorithms from the selection made by the user. This object is characterized by its DBMS nature (database management system); i.e., the data is contained in a database administrator. The object is fed by two flows coming from the population and the interface objects.
The flow that provides the population object corresponds to the data of characteristics, values, and records that will be stored in the database. Since the interface object provides the necessary parameters to establish connection with the database, the view is user friendly. The user can also configure or choose different types of connections, according to the training data source.
The logistic regression model allows to generate a mathematical model and a graphic model which show the probabilities with respect to the dependent and independent variables. The graphic model generates the chart called Lift. That is the model generated with respect to the ideal model proposed by the system. There the fields or variables can be selected to be taken into account when generating the graph. This is achieved from the structure of the algorithmic technique. Additionally, this algorithm allows to observe the behavior of the variables across the graph, on the X and Y axis, as well as a matrix of probabilities.
The Apriori algorithm allows to generate two models. One of them is generated in terms of association rules which show the relationship between attributes or variables from two sets of statistics, Support and Frequency. The other model is generated in terms of a graph or Network of Dependencies. This network allows to display the most relevant variables for the algorithm, also based on the classification of input and predictive variables, or dependent and independent variables. When the algorithm determines the strength or the relationship between the variables, it then makes decisions as to which have more support and more confidence. This is reflected in the final models.
Discussion
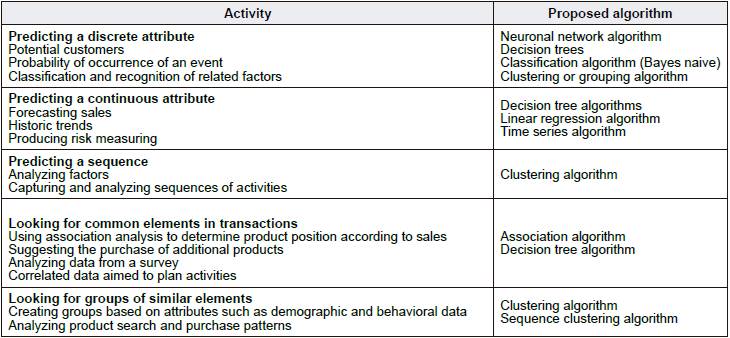
Even though an experienced analyst has the knowledge and experience on data mining techniques, selecting the best algorithm for a specific analytical task could be a challenge. Although analysts may use different algorithms to perform the same task, each one of them produces a different result, and some of them could produce more than one type of result. It is important to highlight that there is no reason to limit an algorithm in its solutions since analysts will sometimes use an algorithm to determine the most efficient input (independent and dependent variables), and then, they will apply a different algorithm to predict a particular result, based on such data. This shows that in some cases, the analysts' experience is not enough to determine the data source that will feed the model. That means the selection of dependent and independent variables sometimes needs an algorithmic model to help in the selection of such parameters. After the variables selection and classification, a more specific mining technique can be applied. Also, even though the classification of data mining techniques is framed in two general groups, supervised and unsupervised, each group is composed of a high number of algorithms or mining techniques, which becomes a knowledge restriction for analysts. Within the general classification of supervised techniques and those for obtaining knowledge, some of the most important regarding their application are shown (Table 1).
The proposed model has a component based on the explicit knowledge of some techniques and their application in cases or activities of different areas.
This allows to support decision-making when choosing a data mining technique related to a specific type of activity, considering the classification of the variables that feed the model, which are predictive or dependent variables, and input or independent ones.
APPLICATION OF THE CONCEPTUAL MODEL IN A KBS
Data flow diagram
The diagram below shows the specific data flow between the systems processes, starting with user interaction and ending with the systems interaction (Figure 3).

Interfaces
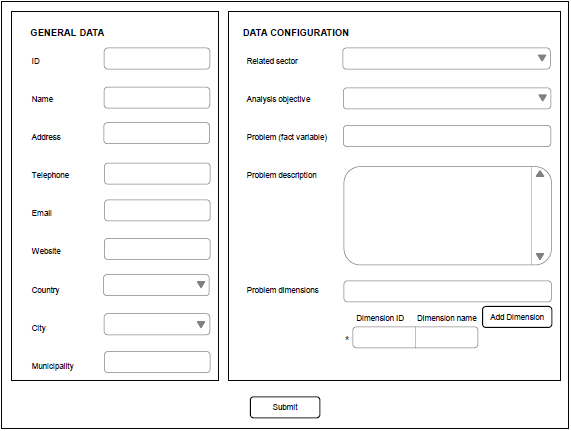
In this interface the general data is provided which corresponds to the organization, or institution related with the data mining problem. It is asked to define identification, company name, address, telephone, email and website. Then, the system permits to specify the sector or area which is related with the problem or object of the study. Similarly, it is necessary to select the object of analysis, i.e. if the user only needs to obtain data knowledge from the relation of input variables, one must select the option: obtain knowledge. In case the user needs a prediction with the input variables, then the user must select the option prediction. The system allows to specify a variable called facts, on which the problem is analyzed; and a list of dependent variables which behaved as determinant factors for the internal relations performed by the selected technique. These factors are independent variables. Once the data are configured, they are sent to the system to let it advance to the next interface (figure 4).
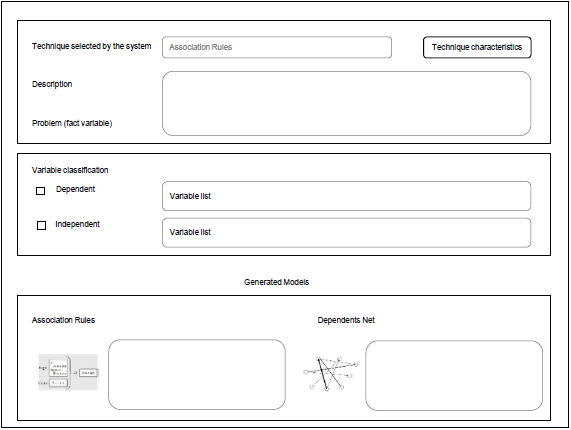
After configuring the organization's general data and the specific data related to the context of the problem, the system has the necessary inputs to choose the right technique. In this case the selection between association rules and logistic regression is carried out.
The selected technique in the user interface, the features of the model and the expected resulting data are shown. Also, the user can see the list of variables classified as dependent and independent of the mining model.
The obtained models as well as their functionality are presented to the user in the final stage of the interface (figure 5).
Conclusions
This is a conceptual model that will support decision-making, according to the data mining techniques available to be applied. With this, a reduction in the time and cost of data mining projects will be obtained, and the understanding and functionality of some techniques described in this work will be facilitated.
There are many data mining techniques that can be studied and translated into a conceptual model, together with its features and functionality, thus facilitating analysis and decision-making processes in the exploitation phase of KDD life-cycle information. The application of the model reduces the times during the execution of a data mining project, allowing to choose the most appropriate technique, and avoiding having to test other algorithmic techniques.
Data mining is an important step in the KDD process. This is an interdisciplinary field with an overall objective of carrying out predictions and establishing relationships between data, through automated tools that employ sophisticated algorithms. Data mining consists in the generation of models based on specific patterns. It is also an iterative process supported by automatic techniques or manual methods, aimed at finding interesting and valuable information in large amounts of data. It is a great effort of human experts and computers, enabling us to provide solutions to problems. Its aim is to obtain knowledge and make predictions.

