


Servicios Personalizados
Revista
Articulo
 Inglés (pdf)
 Articulo en XML
 Referencias del artículo
 Enviar articulo por email
Indicadores
-
 Citado por SciELO
 -
 Accesos
Links relacionados
-
 Citado por Google
 -
 Similares en
SciELO
Similares en
SciELO -
 Similares en Google
Compartir

 Permalink
Earth Sciences Research Journal
versión impresa ISSN 1794-6190
Earth Sci. Res. J. v.11 n.1 Bogotá ene./jun. 2007
GEOINFORMATION DENSITY: A criterion on ANH Block Negotiation
Carlos A. Vargas J.1,2 - Armando Zamora R. 1 - Andres Pardo 1,3
1 Agencia Nacional de Hidrocarburos - ANH
2 Departamento de Geociencias, Universidad Nacional de Colombia - Sede Bogotá
3 Departamento de Geología, Universidad de Caldas
Corresponding author: Carlos A. Vargas J., e-mail:cavargasj@unal.edu.co
Manuscript received March 13 2007. Accepted for publication June 20 2007.
ABSTRACT
Based on the general information included within the ANH Exploration and Production Information Service, the information distribution densities of the Colombian territory were determined. These densities are referred in seismic length per square kilometer and amounts in magnetic-gravimetric and geochemical information data or drill-hole length per sq. km. A probabilistic distribution was assessed along the density distribution and cost distribution for each variable. The variables, as information layers, were cross-referenced in order to define relative weights that assess information with respect to the presence or absence of information in the treated area.
This procedure could be regarded as a methodological support proposal for area negotiation of the oil industry. A better approach to the quandary should include: new input of data into the system, a division of the territory in smaller areas adjusting to complex geometries, and considering the particular market conditions for each basin. Nevertheless, it is apparent that the obtained results favor the consolidation of a conceptual framework that at medium term will allow a conscious approach towards block negotiation between the petroleum industry and the ANH.
Key words: Density of Information, Oil Exploration, Negotiation, Colombia.
RESUMEN
La clasificación automática de señales sísmicas se ha llevado a cabo típicamente sobre representaciones El uso de la información de carácter general incluida dentro del Servicio Informativo de la Exploración y de la Producción de ANH permitió la determinación de densidades de distribución de información del territorio colombiano. Estas densidades se refieren a longitud de sísmica por el kilómetro cuadrado, cantidades de datos de información magnético-gravimétrica y geoquímica, así como longitud de perforación por kilómetro cuadrado. Una distribución probabilística fue entonces estimada para la distribución de la densidad y de la distribución de costos para cada variable. Las variables como capas de información fueron pesadas relativamente para determinar la presencia o ausencia de la información en el área tratada.
Este procedimiento se podría mirar como una propuesta metodológica para la ayuda en la negociación de áreas de interés en la industria del petróleo. Un acercamiento mejor al problema debería incluir: nueva entrada de datos en el sistema; una división del territorio en áreas más pequeñas que se ajusten a las geometrías complejas; y considerar las condiciones de mercado particulares en cada cuenca. Sin embargo, es evidente que los resultados obtenidos favorecen la consolidación de un marco conceptual que en el mediano plazo permitirá un acercamiento consciente hacia la negociación de bloques de interés exploratorio para la industria petrolera y la ANH.
Palabras claves: Densidad de Información, Exploración de Petróleo, Negociación, Colombia.
INTRODUCTION
A negotiation is a communication framework where the assessed object considers an interaction between value estimations of each participating transaction party. This practice may become subjective, as each participant may imprint a differential value based on its own cognizance. Evidently, he who has the utmost knowledge of the object will have a better position to assess the cost - benefit relationship and go appropriately further in the negotiation.
The strategy is to set up a large sum of negotiation criteria to establish block allocation mechanisms within the practice of exploratory promotion developed by the ANH. One of these criteria may be supported on the hypothesis of geoinformation density, that is, "the possibility that information distributed in a specific area may be considered as typical and a criterion to quantify its relative investment". Accepting this statement as starting point, it can be demonstrated that geological, geophysical, geochemical, and in general all geospatial information, may be conceived as an objective tool for block appraisement. In this line of thought, the goal of this paper is guided towards defining a conceptual tool that will allow supplementing block negotiation undertaken by the ANH within its mission outline.
METHODOLOGICAL ASPECTS Based on the general information included within the ANH Exploration and Production Information Service - EPIS such as longitude and location of several seismic programs, gravimetric, magnetometric, and geochemical location coverage along with well distribution performed during the exploratory history of Colombia, information distribution densities have been determined from territory area discretization (e.g., 25km x 25km). These densities are referred in seismic length per square kilometer and magnetic-gravimetric and geochemical information data amounts or drillhole length per square kilometer.
Once the information densities have been established for the area, the probabilistic distribution is assessed along with the inferred relative weighing factors to the density distribution and cost distribution for each variable. The variables, as information layers, have been cross-referenced in order to define relative weights that assess information weighters with respect to the presence or absence of information in each treated area. Figure 1 depicts a synthetic outline establishing the procedures followed on this paper.
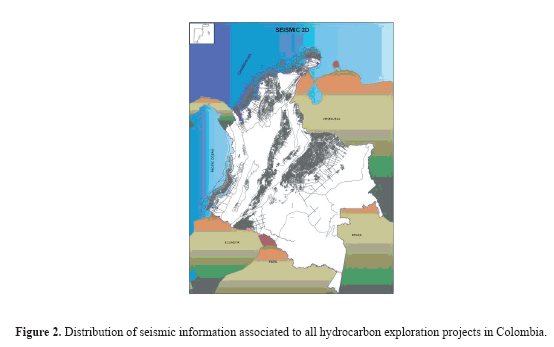
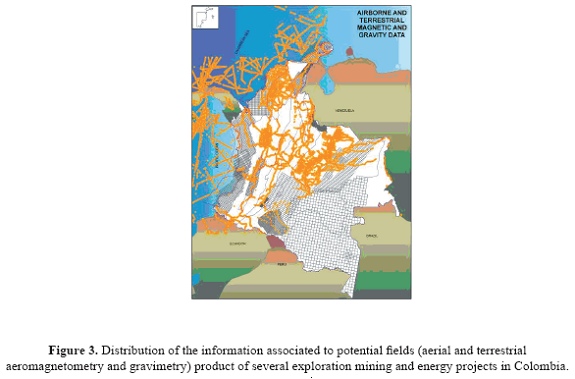
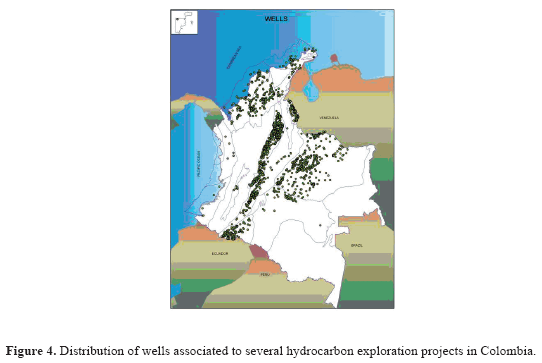
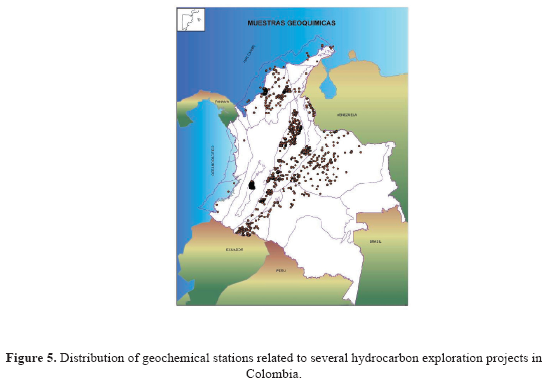
DATA It could be stated that a number of the geospatial variables analyzed show strong contrasts with respect to their distribution in Colombia. Figure 2 shows the location of seismic information depicting a dense coverage towards the Eastern plains (Llanos Orientales) basin including the Eastern Mountain Range foothills, Putumayo and Magdalena Valley (high, medium, and low), Pacific off-shore coast (central and south region), Atlantic off-shore coast, and Sinú-San Jacinto and Cesar-Ranchería basins. In contrast, low information densities are seen towards the Orinoquía and Amazon regions, north of the Department of Chocó, and along the mountain range axis. A similar situation is seen with the magnetic and gravimetric information, well distribution, and geochemical controls (Figures 3, 4, and 5).
Even though the EPIS database has information voids in some periods and there are time differences in data entry in the same database, probably as a testimony of the change of administration, its current structure and contents remains representative and may guarantee that the database is suitable to assess the exploratory tendencies and ensure an appropriate criterion for block negotiation.
ANALYSIS AND RESULTS DISTRIBUTION FUNCTION
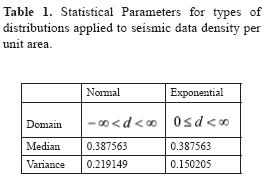
To understand how spatial distribution of geoinformation density could be analyzed, it is necessary to begin from an analysis of the distribution function that better suits the observations. For instance, seismic density registered in Colombia could be used as a representative variable for this procedure. Figure 6 shows the distribution of density frequencies and the best fit representing two models of statistical distribution: Normal and Gamma. For the first event, a strong unbalance is seen, suggesting that the distribution could not comply with a normal distribution process.
Usually, offer and demand processes follow normal distributions. In this event, although it is a similar scenario for area allocation, it follows a Gamma pattern fit, specifically an exponential distribution (Ayyub and McCuen, 2003). Exponential distributions are useful to assess processes through time (Blaesid and Granfeldt, 2003). However, this condition is not reflected in our issue because this is a data set encompassing the whole observation period, and illustrates a scenario where the main biasing frequency almost dominates the distribution below the mode and in turn allows values greater than frequency. A checkmark for this distribution may be seen in the simple and cumulative probability curves (Figures 7 and 8). The behavior is similar to "club admittance", in other words there is a minimum fee to be a member, but any sum above the minimum is also admissible and very exceptionally members below the fee will be presented.
This is situation fundamentally imposed by the petroleum industry, which possibly will promote increases in admission quotas when the business tends to be more attractive. In effect, for a greater observation time and under the same energy requirements in Colombia, it could be expected that the seismic information density as a criterion for block allocation (admission quota) tends to be greater. Table 1 shows the parameters for each distribution.
A similar situation is seen in distribution functions for information densities associated to the amount of magneto-gravimetric points and drill-hole length (Figures 9 and 10). For well data (m/km2), this index depicts in certain degree, the inversion rate executed to know a given area. Likewise, information density related with the number of geochemical stations should take into account the dissimilarity in the level of tests for each station (TOC, pyrolysis, organic petrography, sulphur content, metal content, rock extracción, liquid gas chromatography, and biomarkers). This information is conditioned to the existence of an analysis sequence protocol as a function of the results obtained from certain initial testing such as TOC and Pyrolysis. Therefore, its representability only grants a partial nature (Figure 11). A representation of these variables in the Colombian territory is shown in density information maps associated with the analyzed variables (Figures 12, 13, 14, and 15).
Table 2 summarizes the exponential distribution parameters converted into relative weights, describing all the observed information. Generally, empirical adjustments with confidence levels can be seen, widely reproducing the behavior for the amount of data for the observed period.
ESTIMATION OF A RELATIVE WEIGHTING FACTOR FOR AREA NEGOTIATION
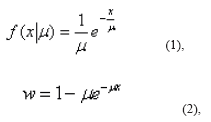
The exponential probability distribution function and probability estimation have been defined as (Blaesid and Granfeldt, 2003):
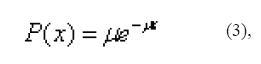
where µ is the arithmetic mean and x the discrete value of the distribution of the estimated probability. For all previously analyzed information densities, it is necessary to shorten the equation (2) to a relative weight factor that promotes the generation of new knowledge in areas where data is scarce:
The weighting factor (w) is a tool that relatively contemplates initiatives directed towards new surveys under different block contracting employed by ANH. According to equation (3), areas with plenty of information will be penalized with low weighting factors and viceversa. Obviously, upon promoting strategies encouraging enforcement of new scientific and technological procedures on areas of interest, the need to estimate other weighting factors with the equation (3) is a must.
INFORMATION LAYER WEIGHTING
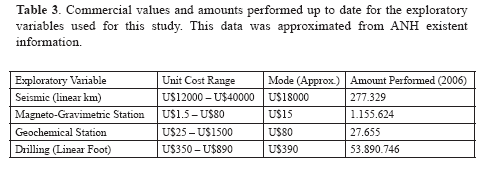
As can be expected, the relative sum of related weights with all variables, allows having an approach to the spatial distribution of information density. Although average costs for each variable are very different and entail another relative weighting to market averages. Table 3 shows Colombian seismic kilometer average costs, unitary values for each magneticgravimetric and geochemical point and linear drill-hole foot (with more frequent analyses), as developed approximate amounts. It could be seen that seismic is the most expensive exploratory variable, apart from being the most widely used. Likewise, the technical link between seismics and wells is noticeable, being these two representable variables of areas where the major exploration investments have been executed.Therefore, superimposing the drill-hole density map on top of the seismic density information map, or at least one of these two variables, may be a criterion enough to estimate a map of information density relative to the weighting providing support for block negotiation processes.
Nevertheless, equation 4 is an empirical approach that assumes the superimposition of all variables taken into consideration and weighting the relative cost of each variable.
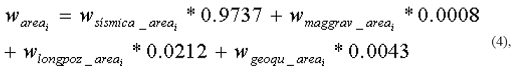
The estimates seen in equation (4) enabled performing a weighted geoinformation density map (Figure 16). This map highlights the areas where the effect of new exploratory information has less effect. Possibly, the current setting may vary as new data is added to the information foundation that engineered it.
According to Figure 16, there are areas where no exploratory efforts have been undertaken as those analyzed, namely those in the Colombian eastern border, the borders with Venezuela and Brazil, in the Serranía of San Lucas, the Junction of the Pastos, the Sierra Nevada of Santa Marta, and the lower Cauca river valley. This state of affairs can be explained in view of the current geological knowledge. These areas do not seem to be favored by their inherent geological conditions and possibly have no mineral-energy potential of interest. In contrast, some areas have vast amounts of information density, evidenced by the widespread of exploratory activity such as the Eastern plains, Putumayo, and the Magdalena Mid-Valley.
On the other hand, some belts and areas with high information density are suddenly interrupted making it uncertain to know the potential continuity of the prospects that have not been adequately analyzed as the northern part of the pacific coast and towards the north of Putumayo. Although it is necessary to further analyze the information densities of these areas, it is also clear that the socio-environmental conditions of these areas are intricate and have hindered the possible development of potential prospects.
CONCLUSIONS
The development of the present knowledge management assignment based on the EPIS database should be regarded as a methodological support proposal for area negotiation whose quantitative results rise above the preliminary results. A better approach to the dilemma should include:
1. New input of data into the system as a consequence of an exhaustive search of data to complement the current petroleum knowledge of the country. 2. The discretization of the territory in smaller areas adjusted to complex geometry, showing the current conditions for block negotiation. 3. An approach of the problem considering the particular market conditions for each basin. 4. Data entry that establishes new information layers allowing to improve the relative weighting of geoinformation such as seismic information reprocessing and dating. 5. Breaking up information in basic data that allows to establish information layers with differing weights (e.g., differentiation of stratigraphic wells into different diameters and considering supplementary surveys such as electrical registry and petrophysical testing).
Nevertheless, it is apparent that the obtained results favor the consolidation of a conceptual framework that at medium term will allow a conscious approach towards block negotiation between the petroleum industry and the ANH.
ACKNOWLEDGMENTS
To the staff at Schlumberger, particularly to Edgar Medina and Liliana Salcedo, for enduring two months of my intense requirements over the available EPIS system information.
REFERENCES
1. Ayyub, B.M. and McCuen, R.H. (2003). Probability, statistics, and reliability for engineers and scientists. New York: Chapman & Hall/CRC Press. [ Links ]
2. Balakrishnan, N. and Basu, A. P. (1996). The Exponential Distribution: Theory, Methods, and Applications. New York: Gordon and Breach. Blaesild, P. and Granfeldt, J. (2003). Statistics [ Links ]
3. Blaesild, P. and Granfeldt, J. (2003). Statistics with applications in biology and geology. New York: Chapman & Hall/CRC Press. [ Links ]
4. Spiegel, M. R. (1992). Theory and Problems of Probability and Statistics. New York: McGraw- Hill, p. 119. [ Links ]

