


Serviços Personalizados
Journal
Artigo
 Inglês (pdf)
 Artigo em XML
 Referências do artigo
 Enviar este artigo por email
Indicadores
-
 Citado por SciELO
 -
 Acessos
Links relacionados
-
 Citado por Google
 -
 Similares em
SciELO
Similares em
SciELO -
 Similares em Google
Compartilhar

 Permalink
Earth Sciences Research Journal
versão impressa ISSN 1794-6190
Earth Sci. Res. J. v.11 n.1 Bogotá jan./jun. 2007
CROSS-SECTION GENERATION OF VARIOUS GEO-SCIENTIFIC FEATURES WITHOUT CONTOUR DIGITIZATION USING A VISUAL C++ BASED SOFTWARE APPLICATION 'VIGAT 2005'
Naveenchandra N. Srivastava, Brijesh G. Rathod, Ajay M. Solanki, Suresh P. Machhar, Vivek R. Patel and A. R. Dasgupta
Bhaskaracharya Institute for Space Applications and Geo-informatics Nr. Ch-0 Circle, Indulal Yagnik Marg, Nr. Info city, Gandhinagar - 382 007 (Gujarat) India Fax: +91-079- 23213091
Corresponding author: Naveenchandra N. Srivastava, e-mail: naveen0504@yahoo.com
Manuscript received October 24 2006. Accepted for publication June 20 2007.
ABSTRACT
Cross-section can be described as a two dimensional dataset where the horizontal distances are represented on the x-axis and the depth on the y-axis. A cross-section is a window into the subsurface. This work presents the construction of cross sections with the help of 'Vigat 2005' - a Visual C ++ based software application. Its main purpose is to provide cross section views of geoscientific features and to interpret their variation within the area of study. In geological context, profile or cross section is an exposure of the ground showing depositional strata. Geological cross sections are very powerful means of conveying structural geometries. They are planar, usually vertical, graphical representations of earth sections showing stratigraphical successions, age, structure, and rock types present in the subsurface. Geological cross sections allow a better conceptualization of the 3-D geometry of the structures. By using 'Vigat 2005', a cross section graphic can be displayed by the user with a simple click of the mouse. It offers much easy to use functionality to facilitate the completion of desired tasks. Specific boundary conditions to represent the movement of rock block over the fault can be displayed using the graphical user interface. Relief or slope variation of the study area can also be viewed. A topographical map provides an aerial (overhead) view of a landscape. It is possible to create a more pictorial representation of the landscape by making a topographic profile of the region. A topographic profile is a cross section showing elevations and slopes along a given line. A precise method to determine slope variations is to construct a profile or cross section through the topography. The most important advantage of 'Vigat 2005' is that users do not need to digitize contours. This work focuses on the design and implementation of an optimized interpretive environment that have been built using Visual C++ tools. Strong programming capabilities of Visual C++ have been utilized, at its full extent, for the development of 'Vigat 2005'.
Key words: Vigat, 2005, Visual C++, Cross Section, Contour, Profile, Software, Digitization.
RESUMEN
Un perfil puede ser definido como un conjunto de datos bidimensional donde las distancias horizontales son representadas en el eje x, y la profundidad en el eje y. Un perfil es una ventana al subsuelo. Este trabajo presenta la construcción de perfiles con la ayuda de 'Vigat 2005' - aplicación basada en Visual C++. Su propósito principal es proveer perfiles mostrando características geo-científicas que permitan interpretar la variación de las mismas dentro del área de estudio. En un contexto geológico, los perfiles son una exposición del suelo mostrando rocas sedimentarias. Estos perfiles son muy útiles para determinar las geometrías de los cuerpos. Ellos son representaciones gráficas planares, usualmente verticales, de la Tierra mostrando sucesiones estratigráficas, la edad, estructura y tipos de rocas presentes en el subsuelo. Los perfiles geológicos permiten una mejor conceptualización de la geometría tridimensional de las estructuras. Al usar 'Vigat 2005', un perfil puede ser mostrado por medio de un simple clic del ratón por parte del usuario. Este provee una mejor funcionalidad para completar las tareas deseadas. Las condiciones límites específicas para representar el movimiento de un bloque de rocas sobre una falla pueden ser mostradas usando la interfaz gráfica del programa. También puede ser mostrado el relieve o las variaciones de la pendiente el área de estudio. Un mapa topográfico permite ver vistas aéreas del terreno. Es posible crear una representación más gráfica del terreno al hacer un perfil topográfico de la región. Un perfil topográfico muestra elevaciones y pendientes a lo largo de una línea determinada. Un método preciso para determinar las variaciones de la pendiente es construir un perfil a través de la topografía. La mayor ventaja de 'Vigat 2005' es que los usuarios no necesitan digitalizar contornos. Este trabajo se enfoca en el diseño e implementación de un ambiente interpretativo optimizado que se construyo con las herramientas de Visual C++. Las fuertes capacidades de programación de C++ han sido utilizadas completamente para la construcción de 'Vigat 2005'.
Palabras claves: Vigat, 2005, Visual C++, Perfil, Contorno, Software, Digitalización.
INTRODUCTION
The term 'Vigat ' means profile or information in Gujarati language. Profiles or cross-sections are constructed across a contour map to provide a three-dimensional view of the topography. Cross-sections construction is a technique used to obtain accurate and consistent information from field, seismic or well data. This is an interactive technique and it depends largely on human interpretation. Here, each operation has to be decided by the user (Geophysists /Geologist). An important method of topographical map analysis is the construction of topographic profiles, which are the graphic representation of graduated elevations along a line segment drawn on a map. The profile view shows the "shape" of the land and demonstrates a line-of sight perspective.
The main feature of topographic maps is their representation of topography such as ridges, valleys, mountains, plains and other earth surface features, and natural as well as man-made features. A Topographic profile is a cross section of the terrain surface along a given line. Some maps also show a cross-section view of the area. A cross-section depicts how features look like below the Earth's surface. A Geological crosssection can be termed as a vertical slice through the earth, projecting the dip of the rock units into the subsurface and sometimes above surface. Cross-sections are generated from geological maps and can be thought as vertical slices through a map area showing a profile view of subsurface structures. Drawing geologic crosssections is not a trivial task and methods for their generation have become very sophisticated because interpretations are made on geometrical features (e.g. bedding and faults) at depth on the basis of surface geometries. Some aid in this regard may exist in the form of borehole or geophysical data (University of Southern California, 2002). Above ground, contour lines represent elevations, or heights. Below ground, they represent depths below the surface (The Paleontological Research Institution, 2003).
Geological cross-sections are useful for visualizing spatial and temporal relationships of units occurring in an area. Steep river canyons, sea cliffs and mountain sides, and roadcuts yield natural cross sections, but most cross sections are made by projecting surface features into the Earth. If included, cross-sections are usually printed on the same page of the geological map. They are important accompaniments to geological maps, especially if the map focuses on the geology of the bedrock underneath the soil and loose sediments. Topography - the elevation of the earth's surface - is represented on topographical maps by contour lines. A profile is unexaggerated if the horizontal and vertical scales are the same. To emphasize the differences in relief in a comparatively flat area, the vertical scale may be expanded relatively with the horizontal scale, producing a cross-section with vertical exaggeration. Geological maps generally contain the standard topographical information, overlain by the geology of the area. Geological maps are often compilations of detailed information gathered from many individuals' field work over many years. Topographical maps depict the terrain of an area as viewed from above. It is possible to convert the aerial view of a topographical map into a view that shows the topography along a given line as viewed from ground level by constructing a topographic profile. The profile is a cross-section with elevation plotted vertically and distance plotted horizontally, and it clearly outlines the relief and slope along a given line on a topographical map.
OBJECTIVE
Cross-sections often accompany geological, geo-morphological, engineering, tectonic, and other maps in scientific and technical bulletins, open file reports, and professional and industrial organizational proceedings. They can be helpful to determine fossil fuels and aquifers, and to locate and describe potential geologic hazards. They can also be utilized to locate subsurface minerals, hydrocarbons, geothermal areas, and construction materials (Defense Environmental Network & Information Exchange, 2005).
The primary way to portray geologic data is through a map. A good geological map shows the types of rocks present in a given area, the nature of the contacts between them (e.g., depositional, intrusive, or fault), and the bedding orientations of the rocks. The problem is that maps present only what is on the surface. Often, the main interest lies on not only in the surface geology, but in the subsurface as well. There may be oil and gas or economically valuable deposits or may be in what the subsurface geology can tell about the structural evolution of an area. Ideally, it is a picture of what one would see, given a vertical slice through the Earth's crust. In practice, it is not a true picture but an interpretation an educated guess of what that slice would look like. It is constructed on the basis of the surface geology (the map) and any borehole and/or seismic data that may be available. Often, the available data are insufficient to constrain a unique interpretation. If a cross-section is constructed perpendicular to the strike of bedding, the dip of beds in the cross section will be the same as the dip measured in 3-D. One of the basic assumptions in drawing cross-sections is that the rock is neither created nor destroyed in other words, the volume of rock remains constant. Often the best way to visualize a structure on a geological map is with a vertical cross-section. With a cross section view geological principles can be applied - - superposition, original horizontality, crosscutting relationships, ... -- and the sequence of events that produced the materials beneath the surface can be analyzed (Butler, 2000).
MANUAL TECHNIQUE FOR CROSSSECTION CONSTRUCTION
These are the suggested steps by Maher (2002) to draw a cross-section:
- Choose a cross-section line.
- Sketch out the structure in the cross-section. Choose appropriate vertical and horizontal scales. A 1:1 scale provides no distortion.
- Draft the topographic profile. The topography is important for some maps and not as much for others. Often, there is no need to plot in every contour, but larger increments can be used.
- Place the surface geological boundaries along the profile and cross section line alongwith dip lines, at the appropriate angle, where available from the map.
- Extrapolate units to depth.
- Reinterpret and revise cross section where inconsistent with the map or other data. Extrapolate into the air with dashed lines.
- Place finishing explanatory touches.
SOFTWARE FUNCTIONALITY
The initial screen of 'Vigat 2005' has been shown in Figure 1.
The manual technique for drawing cross-sections described by Maher (2002) can be performed by 'Vigat 2005'. This task can be completed by implementing the following steps:
- First of all, the user loads a scanned map or image file of the map (Figure 2) as an image in bmp file format (Figure 3).
- Now, the user takes a section line on the loaded image file.
- The user can take a section line in any direction.
- Different colors and thickness can be assigned to a section line.
- The user enters contour values of parameters along the section line (Figure 4).
- The values of parameters are automatically stored in a database.
- The user clicks on the display menu to view the cross section.
- Facility for vertical exaggeration is also provided. • Different profiles can be saved.
TOOLS AND TECHNOLOGY
Visual C++ has evolved into an incredibly powerful programming environment (Young, 2003). It is one of the most comprehensive and sophisticated software development environments available. It has consistently provided a high level programming power and convenience, while offering a diverse set of tools designed to suit almost every programming style. Its features include easier application coding, building and debugging, greater support for ActiveX and Internet technologies, additional database development options, and new application architecture and user interface elements (Solanki et al., 2005). It makes Windows programming far easier by introducing many programming tools such as the menu editor for designing menus and the dialog editor for designing dialog boxes (Holzner, 1998). Visual C++ consists of the C/C++ compiler, the incremental linker, the resource compiler, and other tools required to generate the 32 bit Windows programs. Visual C++ manages programs through projects. A program may consist of many different files, and these are all combined into a project (Gersting, 1997). The central part of the Visual C++ package is Developer Studio. Developer Studio is used to integrate the development tools and the Visual C++ compiler (Williams, 1999). 'Vigat 2005' requires Windows operating system (95/98/2000/XP), Microsoft Visual C++, and Microsoft Access for proper functioning. Hardware requirement consists of 4 GB hard disk and 64 MB RAM.
SOFTWARE LOGIC
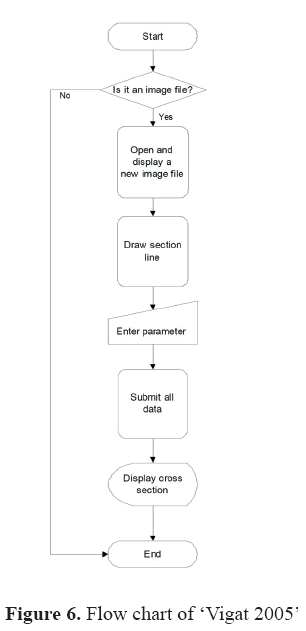
Logical inter-relationships of the different functions to be performed by the software are shown in the flowchart. A flowchart is nothing but a pictorial representation of algorithmic steps involved in software development, which helps in systematic analysis and organization of a problem. A flowchart remains as the best choice for communicating the steps needed to solve a problem and the order in which those steps must be executed (Rider, 2004). It is an essential and integral part of software development. A flowchart for 'Vigat 2005' is shown in figure 6. It shows various steps like loading (open and display) image file in bmp file format, drawing section lines, entering contour values, submission of contour values, and display of cross sections.
ADVANTAGES OF 'VIGAT 2005'
- It is completely an interactive software, which provides users with full control over all the operations.
- It provides a graphical representation of parameters and easy to derive relevant information.
- No need for digitization of contours.
- 'Vigat 2005' does not use DEM (Digital Elevation Model).
- Accurate output is provided.
- Task can be performed repetitively.
- Contrary to 'Vigat 2005', creating and plotting cross section profiles in Geographic Information Systems (GIS) requires the following steps:
- Creating a Digital Elevation Model.
- Creating a Section Line.
- Creating Cross Section Profiles.
- Plotting Cross Section Profiles.
In Vigat 2005, instead of contour digitization, users enter contour values from an image file of the map. Hence, the number of tasks is reduced considerably, as the user does not need to digitize contours in the map and perform the above mentioned operations. Hence, 'Vigat 2005' is having an edge over available software like 'Quick Section', 'RockWorks2004', 'Petra', and 'TerraStation'.
LIMITATIONS OF 'VIGAT 2005'
- 'Vigat 2005' is only compatible with Microsoft Windows operating system.
- Multiple operations cannot be performed at once.
- Multiple cross sections cannot be displayed simultaneously.
- No extrapolation into air.
- It supports image files with .bmp extension only.
- Developers are trying to modify 'Vigat 2005' to add more features.
- Microsoft Paint may be used at the final stage of the output.
UTILITY
In constructing the topographic profile, it is easy to exaggerate the vertical dimension by enlarging the vertical scale while keeping the map scale constant. The effect produces profound geometrical changes. This is sometimes useful in geomorphologial or stratigraphical studies to allow greater space for plotting vertical detail. It should never be done for serious structural work because the attitude and form of the structures are also exaggerated thus, destroying the veryinformation the structure section seeks to show namely, the true structural relationship at depth. If more space is required to plot a wealth of data, the whole section should be enlarged uniformly. Geologists sometimes exaggerate the vertical dimension by enlarging the scale while keeping the horizontal scale the same.
APPLICATION IN GEO-SCIENTIFIC STUDIES
As an illustration of 'Vigat 2005's capabilities, a gravity profile has been generated from gravity interpretation publication. A published residual gravity map of Auckland Volcanic Field, New Zealand is used to generate a cross-section using 'Vigat 2005'. This residual gravity map (Figure 2) is characterized by a series of short-wavelength anomalies that correlate only partially with the mapped geology. To the south of Mt Eden, an elongate gravity high, indicating the presence of dense subsurface rocks, coincides with the location of the former Te Pouhawaiki scoria cone, which extends and narrows to the south (Affleck et al., 2001). Small negative anomalies, indicating the presence of low-density deposits, surround this gravity high to the west, south, and east. In the southeast of the region, there is a complex gravity high showing that dense lava flows are probably thick in this region, consistent with the deepening Waitemata surface to the south of the ancient divide. Figures 1 , 2, 3, 4 and 5 illustrate the capabilities of 'Vigat 2005' by showing the construction of a gravity profile. The west-east cross-section AA' shows shallow basalt flows in the far west. They get thickened towards east. This gravity profile can be used to make a comparison with observed gravity and borehole data.
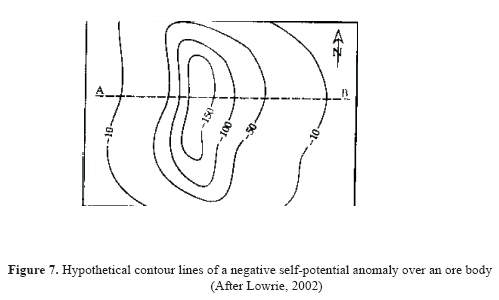
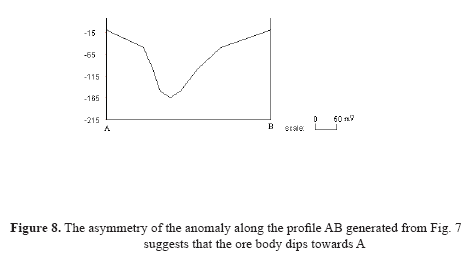
The surveying techniques, regarding electrical properties, consist of measuring potential at discrete stations along a profile. As in gravity and magnetic surveys, the data are mapped and interpretations of anomalies are based on their geometry. Methods used to interpret selfpotential anomalies are often qualitative or based on simple geometric models. Visual inspection of mapped anomalies may reveal trends related to elongation of the ore body and crowding of contour lines can indicate its orientation (Lowrie, 2002). Profiles plotted in knowndirections across the anomaly can be compared with curves generated from simple models of the source. An example of hypothetical contour lines of a negative self-potential anomaly and a cross section generated by 'Vigat 2005' has been shown in Figures 7 and 8. The asymmetry of the anomaly along the profile suggests that the orebody dips towards.
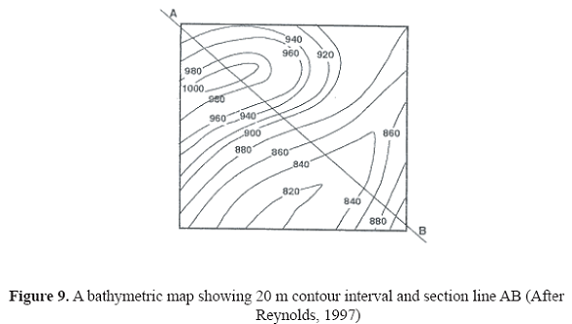
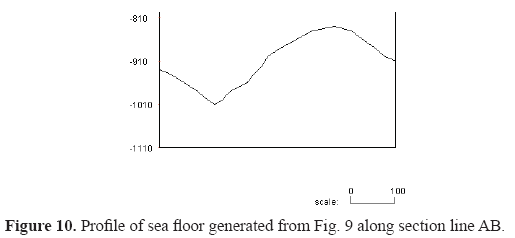
Often in oceanography, there is the need to view the overall relief across the sea floor. It helps to get a sense of its ruggedness. This is best determined by making a bathymetric profile or cross section (Reynolds, 1997). Depth is always negative below sea level. A bathymetric map is shown in Figure 9, Figure 10 shows a bathymetric profile generated along section line AB by 'Vigat 2005'. It shows relief across the sea floor and provides a sense of ruggedness.
Groundwater depth plays a key role in liquefaction evaluation because it results in increased saturation and reduces the effective vertical stress. Shearing disrupts the depositional grain packing and results in a more closely packed grain structure, forming a denser material (Mansoor, 2004). From the groundwater contour map (Figure 11) and the cross sections (Figure 12), it can be observed that Groundwater movement is mainly from the northeast to the southwest in the northern parts of the city and from east to west in the southern parts of the city.
SUMMARY
Cross sections are a valuable method of displaying geological, structural, and other type of information. Geological cross-sections show a profile view of subsurface structures. Topographical maps present the landscape from a vertical (overhead) point of view. Often, it is necessary to know what the landscape looks like from a horizontal perspective in a map (e.g., as though they were standing in the field looking at a vertical section through the landscape). This third dimension is illustrated using a topographical profile. Topographical profiles are a special type of cross-section and can easily be constructed. A topographical profile is a two-dimensional diagram that describes the landscape in vertical cross-section. Topographical profiles are often created from the contour information found on topographical maps. It represents graphicallythe skyline viewed from a distance. 'Vigat 2005' helps to view slope variation along topographic profile. Despite of certain limitations, 'Vigat 2005' offers user friendly interactive Graphical User Interface (GUI) to construct cross-sections and its smooth functioning is a great attraction for the user. As there is no need for digitization of contours, it reduces the number of tasks done by the user considerably. Examples of cross section generated from gravity anomaly maps, self-potential anomaly maps, bathymetrical maps, structural maps, and ground water maps specify the vast scope of application of 'Vigat 2005'. It will be of significant use to geophysicist and geologist in various research and application projects.
ACKNOWLEDGEMENTS
The authors express gratitude to Shri T. P. Singh, Director, Bhaskaracharya Institute for Space Applications and Geo-informatics, Gandhinagar for his encouragement, keen interest, necessary guidance, and permission to publish this work. Thanks are also due to reviewers for providing valuable inputs for improvement of quality of manuscript.
REFERENCES
1. Affleck, D. K., Cassidy, J., and Locke, C. A. (2001). Te Pouhawaiki Volcano and pre-volcanic topography in central Auckland: volcanological and hydrogeological implications. New Zealand Journal of Geology & Geophysics. 44. 313-321. http://www.rsnz.org/publish/nzjgg/2001/24.pdf [ Links ]
2. Butler, J. C. (2000). Interpreting Earth History. http://www.uh.edu/~jbutler/physical/ interpearthhistory.html [ Links ]
3. Davis, G. H. and Reynolds, S. J. (1996). Structural Geology. Wiley. http://earth.usc.edu/ geol321/labs/prelab2.pdf [ Links ]
4. Defense Environmental Network & Information Exchange (2005). Methods of Acquiring and Inventorying Earth Resource Data. https://www.denix.osd.mil/denix/Public/ES-Programs/ Conservation/Stewardship/chapter4.html. [ Links ]
5. Gersting, J. (1997). Microsoft Visual C++ 4.0. A very basic guide. http://www.cis.temple.edu/ ~koffman/cis67/vcenvirn.doc [ Links ]
6. Holzner, S. (1998). Visual C++ 6. BPB Publication. New Delhi, 3. [ Links ]
7. Lowrie, W. (2002). Fundamentals of Geophyics. Cambridge University Press. 210 pages. [ Links ]
8. Mansoor, N. M., Niemi, T. M., and Misra, A. (2004). A GIS-Based Assessment of Liquefaction Potential of the City of Aqaba, Jordan. Environmental & Engineering Geoscience. 10 (4). 297-320. http://geology.newark.rutgers. edu/Grad%20students/Mansoor/Mansoor%20N iemi%20&%20Misra%202004.pdf [ Links ]
9. Reynolds, B. (1997). GS 108 Oceanography, http://web.cocc.edu/breynolds/classes/GS108/ Lab%201%20ocean%20floor%20topo-geol.htm [ Links ]
10. Rider, J. W. (2004). Control Flow Fundamentals, http://www.jwrider.com/lib/ ControlFlowFundamentals.htm [ Links ]
11. Solanki, A., Rathod, B., Patel, V. and Machhar, S. (2005). Tectonic Profile Viewer, B.E. Project Report, Unpublished, Bhaskaracharya Institute for Space Applications and Geo-informatics, Gandhinagar [ Links ]
12. The Paleontological Research Institution (2003). Contour Maps Explained, http://www.priweb. org/ed/pgws/geology/contour_maps.html [ Links ]
13. University of Southern California (2002). G321 Structural Geology Cross sections and Isostasy, http://earth.usc.edu/geol321/labs/prelab2.pdf [ Links ]
14. Williams, M. (1999). Introducing Visual C++ 5, http://cma.zdnet.com/book/visualc/ch01/ch01. htm [ Links ]
15. Young, M. J. (2003). Mastering Visual C++ 6, http://www.mjyonline.com/MMVC.htm [ Links ]

