


Serviços Personalizados
Journal
Artigo
 Inglês (pdf)
 Artigo em XML
 Referências do artigo
 Enviar este artigo por email
Indicadores
-
 Citado por SciELO
 -
 Acessos
Links relacionados
-
 Citado por Google
 -
 Similares em
SciELO
Similares em
SciELO -
 Similares em Google
Compartilhar

 Permalink
Earth Sciences Research Journal
versão impressa ISSN 1794-6190
Earth Sci. Res. J. v.11 n.1 Bogotá jan./jun. 2007
METHODOLOGY IMPLEMENTED FOR THE 3D-SEISMIC MODELLING USING GOCAD AND NORSAR 3D SOFTWARE APPLIED TO COMPLEX AREAS IN THE LLANOS FOOTHILLS
Carlos Piedrahita1, Clara L. Montaña2.
1 Instituto Colombiano del Petróleo, ECOPETROL. Piedecuesta - Colombia. E-mail:carlos.piedrahita@ecopetrol.com.co Phone Number: (577) 6847104
2 Instituto Colombiano del Petróleo, ECOPETROL. Piedecuesta – Colombia. E-mail:clara.montana@ecopetrol.com.co Phone Number: (577) 6847199
Manuscript received July 10 2006. Accepted for publication May 2 2007.
ABSTRACT
A methodology has been applied in order to use seismic modeling and generate synthetic data which are compared with results from field data. This methodology has been applied to the Sirirí area and subsequently it has been extended to other geographic areas. To fully develop this methodology, the GOCAD and 3D NORSAR software packages were used to build respectively the geological and 3D seismic models. This methodology involves making structural modeling by edition of the different objects (horizons and faults) in the structural module of GOCAD, with the help of available seismic and well data, in order to be consistent with reality. From this result a valid seismic model is imported to NORSAR 3D for making the seismic modeling, using ray tracing to get synthetic data. Finally, this information is compared with field data that has been processed.
Key words: Seismic Modeling, Structural Modeling, Sirirí, Gibraltar.
RESUMEN
Se ha elaborado una metodología con el fin de integrar el modelamiento sísmico y generar datos sintéticos que se comparan con los resultados a partir de datos de campo. Esta ha sido aplicada al área de Sirirí y posteriormente se ha extendido a otras áreas geográficas. Para desarrollarla se utilizó el software GOCAD y NORSAR 3D en la construcción de modelos y el modelamiento sísmico 3D, respectivamente. Esta metodología consiste en la elaboración del modelamiento estructural mediante la edición de los diferentes objetos (horizontes y fallas) en el módulo estructural de GOCAD, ayudados de la información existente de sísmica y pozos para que los datos sean coherentes con la realidad. De este resultado se importa un modelo sísmico válido dentro del NORSAR 3D, en el que procedemos a hacer el modelamiento sísmico utilizando trazamiento de rayos para obtener datos sintéticos. Finalmente esta información es comparada con datos reales que se hayan adquirido y procesado anteriormente.
Palabras claves: Modelamiento Sísmico, Modelamiento Estructural, Sirirí, Gibraltar.
INTRODUCTION
The exploratory activity in the country must add new reservoirs to satisfy the national consumption beyond 2008 and to obtain incomes by exploitation of hydrocarbons to help stabilize the national economy. All the efforts are concentrated in increasing the productivity and the lower risk factor that the new prospects must have. New locations have been proposed and already explorated areas have been reinterpreted. In the same manner, new seismic 2D and 3D programs have bee acquired implementing the latest technology regarding design, acquisition, and processing.
Seismic modeling has turned into the new option for designing acquisition parameters, being able to simulate the whole seismic experiment before acquisition. This is very convenient for testing many alternative designs, in which the lowest exploratory risk and the best seismic quality are expected, especially in such complex areas like the Llanos Foothills in Colombia, characterized by its abrupt topography and geological complexity.
The degree of information available in the Foothill area is appropriated to perform seismic modeling tests, because deep interpreted structural-crossings and some previously performed seismic 2D lines are available.
This methodology was implemented, in this case, on the Siriri block located in the area known as the Sarare region between Arauca, Boyacá, and Norte de Santander departments, specifically in the Gibraltar structure (Figure. 1).
In a regional and geological context, the Siriri block is located in the folding and the thrust fault area of the foothills of the Colombian Eastern Mountain Range. The current morphology and geology is the result of several phases of changes in the tectonic style varying from extensive to compressive. The Siriri block is an area affected by the subduction of the Nazca plate in the west and the Caribbean plate in the north. The Mirador formation's quartz sands are the main reservoir in the area. Rocks in the structural section, ranging from Quaternary to Cretaceous (Campanian), are found in faulting areas, in which parts of the Paleocene and Cretaceous sections are repeated. The main generator rocks in the region are shale and clay of the La Luna formation (Cretaceous and Turonian). The Tertiary section is considered as having some possibilities as a generator rock.
METHODOLOGY
Figure 2 is showing a flow-chart of the methodology followed to realize the modeling
A structural model was realized based on the knowledge of the area and the available seismic data using the time interpretation on the software Landmark's Seiswork 2D. Figure 3 shows the Gibraltar Structural Model, which was imported into Paradigm's Geosec 2D Geophysical Software, to be converted from time to depth.
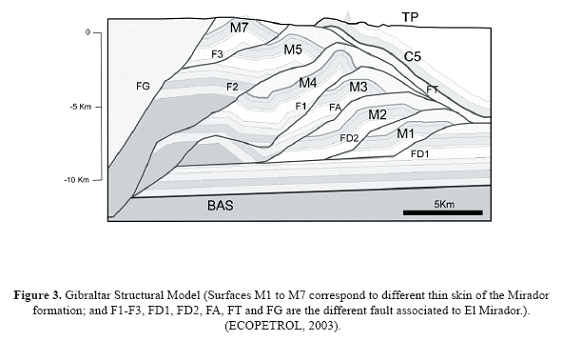
The exploratory objective was to illuminate the Gibraltar structure in the Mirador formation. Initially, the horizons and interpreted faults were imported and associated to the different thin skins of the Mirador formation, in the Earth Science Decisions' GOCAD software. GOCAD is one of the latest state-of-the-art computational integrated applications, in which advanced capacities for 3D modeling, visualization, and geoanalysis are offered. This software has a huge advantage in the integration of information from external sources, and possesses the capacity to export into other applications such as the NORSAR's NORSAR 3D software, where seismic modeling is realized (Earth Science Decisions, 2005).
The construction of the 3D model begins by importing the different horizons and faults, editing all the surfaces, assigning the category of fault to each corresponding fault and horizon, and using the algorithms of GOCAD´s structural software module to obtain the correct relationships between the fault-horizon intersections and the skips of the fault. The final product is a valid three-dimensional model, which will be exported to NORSAR 3D software (Figure 4).
NORSAR 3D is a software for seismic modeling in three dimensions. The method used for modeling is the ray tracing to wave front construction. This algorithm was developed by NORSAR´s researchers (Vinge et al., 1993).
It has the capacity of exchanging data models with other software and importing or exporting in different formats (NORSAR, 2003a). A description of the ray tracing method is presented by Lecompte et al. (2004).
The first step to start the modeling is to define the working environment (e.g., choosing the Project's name and defining its extension and coordinate system). The 3D Model constructed with GOCAD is imported to proceed with the geometrical modeling, in which, the blocks are constructed taking into account that each surface or interface has a positive side, specified in this case for the direction of the basement, and a negative side (atmosphere). The system performs this procedure automatically, meaning that false blocks will be generated, making necessary to redraft the model to adapt it to the reality.
Another important step in the validation of the model in NORSAR 3D is the assignment of the properties of the rocks such as the velocity. These velocities were taken from the Vertical Seismic Profile (VSP) of the Gibraltar-1 well and from geological interpretation as well. This allows the model to become suitable for the ray tracing by the wave front method.
With a valid seismic model for the ray tracing, it proceeds to generate the seismic design for each one of the lines of the Sarare Seismic Program that passes near the exploratory objective (six 2D lines in total). In the application of the Common Shot Wave front Tracer of NORSAR 3D, all the shots of the design were modeled for each line, obtaining events as a result (databases of all the propagations in the Common Shot domain), which register the attributes of each ray traced.
The Common Shot Wave front Tracer is based on a concept developed by NORSAR called wave front construction. This modeling method is based on ray tracing to interpolate a wave front in intervals of a given time. The purpose of this method is to simulate the seismic wave field and placing a number of shots on the surface, with a certain number of receivers associated to each shot. To execute this tool, three elements were used: (1) A valid seismic model generated in NORSAR's Model Building tool, which should be validated and have assigned properties such as the velocity and the density; (2) a survey,designed from the seismic parameters used, and (3) the Ray Code, which specifies the trajectory of the rays through the model (Norsar, 2003b).
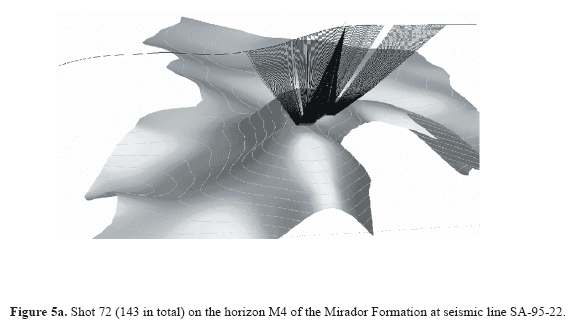
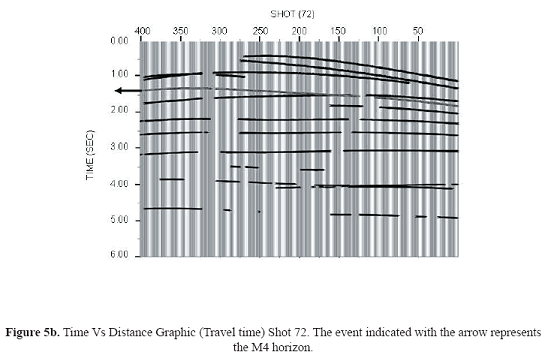
The tracer was configured to simulate the wave propagation of the Mirador horizon (M4 and M2 mainly) and the deeper (Figure 5). This configuration is called signature and usually uses the velocities of the P waves. Only waves reflected by this horizon are used.
RESULTS
The final product of the seismic modeling was the generation of illumination maps and synthetic seismograms.
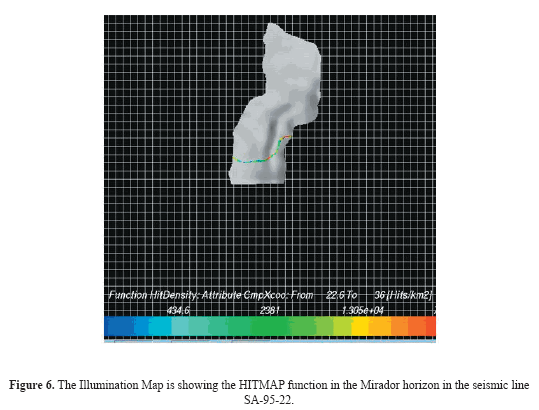
The illumination maps evaluate the design of seismic acquisition on the horizon of interest (e.g., the Mirador Formation). These maps are built in the NORSAR 3D using the events registered in the seismic modeling. Several functions can be visualized on the illumination maps like the HITMAT function, equivalent to the seismic fold, which shows the effectiveness of the seismic design according to the parameters required (Figure 6).
Another of the final products of the seismic modeling is the generation of synthetic seismograms. The result of the Wave front Tracer is stored in files corresponding to Events. A trace type and the frequency can be assigned to these events such as a wavelet (ricker of 30 Hz). The software generates two types of SEG-Y files, one internal, for display locally in the project and another external that can exported to Landmark´s ProMAX 2D Software for processing. A subsoil image is obtained, which can be compared with acquisitions already processed or to propose new seismic prospects (NORSAR, 2003b). Figure 7 shows a comparison among real data (Sarare 2004 Seismic Program) and the synthetic data in the seismic lines on the Sirirí block. It can be observed that in the seismic line with real data there is no continuity on the reflectors, being notorious in the right side of the seismic section. This deficiency in the quality of the data is product of the structural complexity presented in the Llanos foothills. This is one of the most important uses of this methodology for complex areas because some information of the reflectors in the synthetic lines is more notorious, and information of the field data can be enhanced, which is not visible in the field data by itself, because it can be mixed with many types of events.
The seismic modeling permits to simulate the effects of the illumination for lines previously acquired and for new lines to be acquired as well. These illumination studies will be utilized for the design of future 3D projects to be executed in the Siriri block.
CONCLUSIONS
Seismic modeling using the methodology described is an excellent tool for the validation of the 2D or 3D seismic designs and it is adequate to use it on complex areas, as the Colombian Llanos foothills. The complexity of this area makes necessary to use this method. An example of this is observed on the comparison between the images obtained from field data and the ones obtained from synthetic data (Figure 7).
Ray tracing is a tool of great computational efficiency, a very important aspect to be considered, because of the great deal of data that has to be calculated, especially 3D data.
The poor knowledge of the seismic velocities on the deep structures is one of the key issues that have to be improved to use the model without limitations.
The different variations on the seismic design offer a lot of possibilities of experimentation like testing the illumination of the horizons of interest, especially on geologically complex areas such as the ones located on the Colombian foothills (Alvarez et al., 2004).
ACKNOWLEDGMENTS
The authors are deeply grateful with the Research division (UIN) of the Instituto Colombiano de Petroleo (ICP), for the opportunity of having access to the different types of tools and data required on the research.
REFERENCES
1. Alvarez, G., Pereira, V., and Carcione, L. (2004). Model-based 3-D seismic survey design as an optimization problem. SEG Int´l Exposition and 74th Annual Meeting. Denver, Colorado. [ Links ]
2. Earth Sciences Decision (2005). Introducción al Módulo Base de GOCAD. Houston. [ Links ]
3. Lecompte, I., Gjoystdal, H., and Drotining, A. (2004). Efficient and flexible seismic modeling of reservoirs: A hybrid approach. The Leading Edge. 23 (5). [ Links ]
4. NORSAR (2003a). NORSAR 3D Ray Modeling. User's guide Version 4.0. Kjeller, Norway. [ Links ]
5. NORSAR (2003b). NORSAR 3D Ray Modeling. Interactive ray modeling by NORSAR-3D, version 3.0.2. Course Manual. Kjeller, Norway. [ Links ]
6. Piedrahita, C. and Salinas, T. (2005). 3D seismic modeling on the Sirirí Block, Colombia: Case History. Memorias del Congreso Colombiano del Petróleo. ACIPET. Bogotá-Colombia. [ Links ]
7. Vinje, V; Iversen, E., and Håvar, G. (1993). Traveltime and amplitude estimation using wavefront construction. Geophysics. 58 (8). 1157-1166. [ Links ]

