


Serviços Personalizados
Journal
Artigo
 Inglês (pdf)
 Artigo em XML
 Referências do artigo
 Enviar este artigo por email
Indicadores
-
 Citado por SciELO
 -
 Acessos
Links relacionados
-
 Citado por Google
 -
 Similares em
SciELO
Similares em
SciELO -
 Similares em Google
Compartilhar

 Permalink
Earth Sciences Research Journal
versão impressa ISSN 1794-6190
Earth Sci. Res. J. v.11 n.1 Bogotá jan./jun. 2007
THE CAMAQUÃ BASIN MODELLING : TECTONOSTRATIGRAPHY THROUGH INTEGRATION OF GEOPHYSICAL (GRAVIMETRY, WELL LOG) AND REMOTE SENSING DATA
Thais de Souza Kazmierczak1, Luis A. Castillo2, Farid Chemale Jr3, Sérgio Florêncio de Souza3, Ernesto Gómez Londoño4.
1 Professora Universidade Federal do Rio Grande do Sul. E-mail: thais.kazmierczak@ufrgs.br; thaissk@cpovo.net
2 Professor, postgrado de Geofisica, Departamento de Geociencias, Universidad Nacional de Colombia, Bogotá. E-mail: lacastillol@unal.edu.co, lacastillol@yahoo.com.br, lacastillol@ufrgs.br
3 Professor Universidade Federal do Rio Grande do Sul. E-mail: farid.chemale@ufrgs.br,sergio.florencio@ufrgs.br
4 Ingeominas E-mail: egomez@ingeominas.gov.co.
Manuscript received May 17 2006. Accepted for publication May 14 2007.
ABSTRACT
A tectonostratigraphic study of the Camaquã Basin, formed by Neoproterozoic to Eopaleozoic volcano-sedimentary units, is herein presented. Based on lineaments obtained through LANDSAT TM images and geophysical methods, four structural domains were recognized. The depositional and deformational sequences of the Guaritas and the Bom Jardim Formations were identified on well logs, where the fluvial deltaic system and brittle to brittle-ductile tectonic evidence is preserved. Differential compaction of sedimentary rocks was recognized using geophysical information (electrical (well log) and potential methods (gravimetry)). The sedimentary package presents variable thickness, increasing to the NE portion of the basin, and a compartmentalization in echelon subbasins, delimited by NW-trending structures is observed. A 3D schematic model of the Camaquã Basin was built based on the geophysical and satellite image data integrated to the Digital Terrane Model.
Key words: Camaquã Basin, Geophysics, Remote Sensing, Lithostratigraphy, Well Logs
RESUMEN
A continuación es presentado un análisis tectonoestratigráfico de la Cuenca Camaquã. Esta Cuenca presenta una secuencia volcano-sedimentaria del Neoproterozoico al Eoproterozoico. Basado en lineamentos obtenidos de análisis de imágenes LANDSAT TM y análisis geofísico, donde son reconocidos cuatro dominios estructurales. Las secuencias deposicional y deformacional de las Formaciones Guaritas y Bom Jardim, son descritas a partir de registros de pozo y la gravimetría, comprendiendo depósitos deltaicos y tectónica dúctil y frágil. Variaciones en profundidad y los análisis de los registros sugieren compactación diferencial en la roca, a partir de la información Geofísica (métodos eléctricos y potenciales). En el análisis de imágenes fueron consideradas características con la misma composición, brillo y transformada. El último paso incluye filtros que ayudan a analizar los lineamentos estructurales y el modelo de la cuenca. Se observaron diferentes espesores sedimentarios, una división en diferentes sub-cuencas, y un incremento de espesor al noreste. Es presentado un modelo esquemático 3D de la Cuenca de Camaquã basado en la geofísica de pozos e imágenes de satélite, integrados al modelo digital del terreno.
Palabras Clave: Cuenca de Camaquã, Geofísica, Sensores Remotos, Litoestratigrafía, Registros de Pozo.
INTRODUCTION
Areas located to the southern of Brazil, with alterated rock, are very difficult to map due to poor outcrop exposure. To get more subsurface information, other tools have to be used. Geophysical techniques and remote sensing, combined with drill core information, were applied to obtain a 3D schematic interpretation of the Camaquã Basin. The geophysical mapping, spectral analyses, and well log information will help to provide a model of the basin.
STUDY AREA
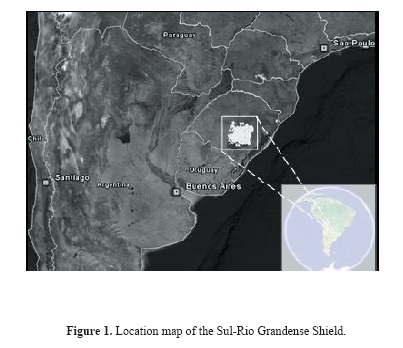
The Camaquã Basin area is located on the Sulriograndense Shield (Figure 1), southern Brazil and limited (i) to the North by Phanerozoic units and the Vila Nova Belt (700-850 Ma), (ii) to the East, by the Tijucas Belt (850-540 Ma) and Dom Feliciano Magmatic Arc (650-540 Ma), and (iii) to the south by Santa Maria Chico Granulitic Complex (Paleoproterozoic), Phanerozoic rocks and the Tijucas Belt. The Camaquã Basin is formed by volcano-sedimentary sequences (620 and 500 Ma), during the late stages of the Neoproterozoic to Eopaleozoic Brasiliano-Pan- African Cycle (Paim et al., 2000).
The Camaquã Basin is characterized by at least four major volcano-sedimentary sequences that are recognized showing (Figure 2): magmatism of calc-alkaline, shoshonitic to alkaline affinities, and a siliciclastic sedimentary infill of shallow marine, alluvial-fluvial, deltaic and lacustrine deposits. The basin is affected by deformational events of brittle to brittle-ductile conditions and the development of complexes.
REMOTE SENSING
Satellite images were used for quantifying and drawing the main structures (Crosta, 1993). The area was studied by assessing the relationships between length, azimuth, and density lineaments into a structural model (Figure 3).
Image processing includes data conversion, image generation (smoothing and filtering) and sampling. Then, a Principal Component Analysis (PCA) was realized to highlight landforms and drainage. The processing of the image applies principal component analyses and image combination of color visual transformation. The transformation (linear) maximizes the variance to convert to a new coordinates system. This process produces a new set of images. The PC1 band was of 3-4-7 composition use in grey scale for highlight of the structural features and vectorization (Vieira, 1998).
1959 lineaments were demarcated by considering: Azimuth, Distance, Continuity, and Position into the Coordinate System.
GEOPHYSICAL METHODS
Geophysical data (Gravimetric Survey and Well log profiles) provide information about subsurface geology and thickness.
GRAVIMETRICAL METHODS
Gravimetrical methods include: Acquisition, Processing, Integration with other studies and Interpretation to obtain profiles, and a Bouguer map (Figures 4 and 5).
Acquired data permit to characterize areas of major lineaments, being demarcated the CanguaçuRidge, the Central Gravimetry anomaly, and the structural gravimetry lineaments (e.g., principal structures domains associated to the Central Gravimetry anomaly). Four structural domains were delimited: (i) Northwest lineaments (Paraná basin sediments), (ii) northeast domain parallel to Caçapava Suture; (iii) a third domain with north, northeast and northwest orientations, with a predominant north direction; and (iv) Northeast and northwest domains occurring in equal proportions, and influenced by the Ibaré lineament and Caçapava lineament.
Local gravimetrical profiles divide the Camaquã Basin in a south region, along with a basement, and the Paraná Basin showing the possible density relationships between different sediments of Godwana with low density (0 and +1), and the sediments of the Guaritas Formation in the Camaquã Basin. Granitic rocks, with anomalous values of -4, were also correlated with volcanic rocks and the Bom Jardin Alloformation (+2 and +3,5). Gravimetrical values in the basement are high (+12).
WELL LOG PROFILES
The well log profiles have permitted to: (i) individualize the depositional sequences in a part of the basin, (ii) correlate sedimentary packages, and (iii) complement the litho-stratigraphic units within the regional geology.
To identify the geometry and thickness, spontaneous potential (SP) and ray gamma (RG) registers from the wells CQP-01-RS (1200m), CQP-02-RS (1200m) and CQP-03-RS (1250m) were described.
The consideration of lithological, electrofacies description, and deformation degree characteristics allows proposing two depositional types of sequences: Depositional Sequences (Sq) and Deformational Sequences (SD).
WELL DESCRIPTION
The description of well logs allows the recognizance of eight electrofacies (Table 1). The electrofacies association permits to obtain depositional and deformational sequences according to the influence of tectonic events, being SD1, SD2, and SD3 deformational systems affected by those events. The electrofacies associations without deformation are described by Sq1 and Sq2.
The CQP-01-RS well (Figure 5)located at the center of the study area was divided into four sequences and limited by two discontinuity surfaces highlighting different tectonostratigraphic episodes:
(i) The upper portion, described from SP, presents two depositional sequences: Sq1 and SD2 in the limit between Guaritas and Bom Jardim Formations; (ii) in the half part (480- 810m), SP and GR log coarsening up cycles have been identified and grouped in a deformational sequence SD1 (A1, F1, and V1 electrofacies association). This interval is characterized by andesites belonging to the Bom Jardim Formation and limited by an unconformity; (iii) the last well log measure (810m to 1200m), interpreted like serrated signature in the GR log, represents the depositional system Seq1 (A1 and S1 electrofacies association).
The CQP-02 RS well (Figure 5) is located at the west of study area. In the top interval (0- 420m) only the GR log was recorded. The log is characterized by deformational (SD1 and SD2) and depositional (Sq2) sequences, including fining upward cycles belonging to the Bom Jardim Allogroup.
Three intervals could be described: (i) Conglomeratic electrofacies (C1 and A2) on the upper and intermediate intervals (55m- 150m and 170m-300m) ; (ii) This interval (300 to 800m) is characterized by the presence of a deformational sequence (breaches, friction plans, and deformational structures). It is associated with tectonic events. (iii) In the final part (850m to the bottom of the drill core), the values of the GR curve change from a positive pattern to an irregular and serrate pattern.
The CQP-03-RS well log (1250m), displays three dominant intervals characterized by high values (Figure 5):
(i) In the first interval, from (0 to 450m), the SP record varies from 25 to 40cps; (ii) in the second interval (600m-950m), SP values go up to 60 cpswith a great deflection at 950m (GR and SP); (iii) The lower interval has a more homogeneous SP behavior with a slight fining-upward to siltstones. The A1, S1, F1, and F2 facies in this well belong to the Bom Jardim Formation and correspond to deformational facies associations (SD1 and SD2).
INTERPRETATION OF THE ELECTRICAL AND POTENTIAL GEOPHYSICAL METHODS AND REMOTE SENSING
Geophysical methods permit to obtain gravimetrical, density, and physical information. Lithostratigraphic bodies and units delimitation could be done by integrating products such as remote sensing studies, along with correlation of ancient geophysical survey information (Crosta, 1993).
The geology of the Camaquã Basin, integrated into the image interpretation (structural domains), provides structural information and a model of the basin.
Four structural domains could be identified by correlating tectonic and stratigraphic events of the Camaquã Basin. Areas of larger concentrations were characterized in the lineament maps, emphasizing on those areas closer to the main structures of the region (Figure 5).
The wells analyzed include units from the Guaritas and the Bom Jardim Formations. The CQP-01-RS well presents a discontinuity between the Guaritas (alluvial deposits) and the Bom Jardim Formations (deltaic deposits). Deltaic and alluvial deposits of the Bom Jardim Formation can be observed in the CQP-02- RS well, whereas the CQP-03-RS well only comprises deltaic deposits of the same formation. Evidence of tectonic events with brittle to brittle- ductile deformations (frictions planes and deformational structures) is described in the CPQ-02-RS and CPQ-03-RS wells (figure 7).
DISCUSSION AND CONCLUSIONS
The tectono-stratigraphic features, obtained by the integration of satellite images (LANDSAT TM) and the gravimetric data, suggests that the NE-elongated Camaquã Basin is formed by blocks compartmentalized by NW-lineaments. There is an increase of the thickness to the NE portion of the basin, where the Guaritas Alloformation depocenter is delimited by the NE-trending master fault (located to the east of the CB).
Most tectonic features of the basin such as NNE and NW-trending structures, arose during the latest stages of the Brasilian Cycle when the basin was formed. These structures were reactived by younger tectonic events through the Mesocenozoic (e.g., those related with the South-American and African fragmentation). The tectonic processes in the Neoproterozoic were dominated by ductile-brittle to brittle behavior during the formation of the Camaquã Basin. NW-trending lineaments in the Camaquã Basin trought the NE-trending structures were also observed. The NW structures, delimiting different compartments of the Camaquã Basin (sub-basins) (Figure 6), were distributed in echelon with thickness of the sedimentary package increasing to the NE. Structural compartments were identified from the variation of preferential direction of lineaments taken from LANDSAT TM images analyzed through preferential lineaments and gravimetrical contrast values. Well logs describe the Guaritas and Bom Jardim Alloformations, showing tectonic events with brittle and brittle-ductil deformations establishing deformational and depositional sequences. A change of density with depth within the well log evidences the presence of two alloformations. Local and regional gravimetrical profiles limited basement gravimetric anomalies along with the increasing of sediment thickness to the NE in the compartmentalized Camaquã Basin.
Computational tools, complementing gravimetrical analysis and geophysical profiles, make possible the technical integration and edition of schematic relationships that demarcated structural limits of the basin, allowing a general visualization.
REFERENCES
1. Crain, E. R. (2003). Petrophysical Handbook Stratigraphic Analysis part 1. Depositional Environment, Alberta, Canadá,. Cap. XIII. [ Links ]
2. Crosta, A. P. (1993). Processamento Digital de Imagenes de Sensoramento Remoto. Ed. Rev. - Campinas, SP: IG/ UNICAMP,. 170 p. [ Links ]
3. Paim, P. S. G., Chemale JR, F., and Lopes, R. C. (2000). Bacia do Camaquã. In: Holz, M., De Ros, L. F. (Eds). Geología do Rio Grande do Sul. Porto Alegre, Centro de Investigação do Gondwana. Universidade Federal do Rio Grande do Sul, p. 231-274. [ Links ]
4. Vieira, M. N. (1998). Vetorização e análise de tendências de cartas de lineamentos geológicos.. 97 f. Dissertação (Mestrado em Ciências da Computação), Universidade Federal de Minas Gerais, Belo Horizonte. 1998. [ Links ]
5. Walker, R. G. and James, N. P. (1992). Facies Models: response to sea level change. St. John's: Geological Association of Canada. 509 p. [ Links ]

