


Services on Demand
Journal
Article
 English (pdf)
 Article in xml format
 Article references
 Send this article by e-mail
Indicators
-
 Cited by SciELO
 -
 Access statistics
Related links
-
 Cited by Google
 -
 Similars in
SciELO
Similars in
SciELO -
 Similars in Google
Share

 Permalink
Earth Sciences Research Journal
Print version ISSN 1794-6190
Earth Sci. Res. J. vol.11 no.2 Bogotá July/Dec. 2007
ACURATE GRAVITY ANOMALY INTERPOLATION: A CASE-STUDY IN CAMERRON, CENTRAL AFRICA
J. Kamguia 1, C. T. Tabod 2, J. M. Tadjou 1, E. Manguelle-Dicoum 2, R. Nouayou 2 and L. H. Kande 1
1 National Institute of Cartography (NIC) - Cameroon, PO Box 157, Yaounde - Cameroon
2 Department of Physics, Faculty of Science, University of Yaounde - Cameroon
Corresponding author: Joseph Kamguia: kjerryfr@yahoo.fr; j.kamguia@geomaticsystem.com;
0023799440426
Manuscript received July 15, 2007. Accepted for publication December 5, 2007.
ABSTRACT
Many treatments in geodesy and geophysics require regularly gridded gravity anomalies. The gridding of gravity data needs interpolation. For the predicted data to be accurate, the smoothest type of gravity anomaly should be used along with the most indicated prediction method. This paper presents the comparison of various prediction methods applied on different types of gravity anomalies and considering the relative geological complexity of the study area. Many algorithms are tested and
the suitability of each type of anomaly and each prediction method discussed in a case-study in Cameroon (Central Africa), using a set of 43,000 gravity data points to determine the must accurate prediction technique.
Key words: Prediction, Gravity anomaly, Residual free-air anomalies, Global geopotential model, Complex geology, Geophysics.
RESUMEN
Muchos tratamientos en geodesia y geofísica requieren que las anomalías gravimétricas se encuentren en grillas regulares. Esta disposición de los datos de gravedad requiere interpolación. Para que los datos predichos sean exactos, la anomalía gravimétrica más fina debe ser utilizada junto con el método más indicado para predicción. Este artículo presenta la comparación de varios métodos de predicción aplicados a diversos tipos de anomalías gravimétricas y considerando la relativa complejidad geológica del área del estudio. Se probaron una gran cantidad de algoritmos y la conveniencia de cada tipo de de anomalía y método de predicción fueron discutidos en una aplicación en Camerún (África central), usando un conjunto de 43.000 datos gravimétricos para determinar la técnica de predicción más adecuada
Palabras claves: Predicción, Anomalía Gravimétrivca, Anomalías Residuales Libres de Aire, Modelo Geopotencial Global, Geología Compleja, Geofísica.
INTRODUCCIÓN
Interpolation is a process widely used in earth science. It estimates the value of a parameter at a point from neighbourings. The process may be extrapolation in some areas (Heiskanen and Moritz, 1967). In Geodesy, gravity anomalies are interpolated when computing geoid undulations or the quasi-geoid height anomalies. In Geophysics, prediction is used to compute regular grids of gravity anomalies required for presentation purposes or further treatments. The accuracy of the predicted gravity anomalies depends mainly on their smoothness and on the method used. It also depends the data density, their geographical distribution and the grid intervals. In general, the smoother the gravity anomalies, the more accurate the predicted values. Many interpolation methods are now proposed (El Abbas et al., 1990), with some algorithms available in open sources such as the Generic Mapping Tools or GMT (Wessel and Smith, 1995).
Comparisons have already been made between surface fitting algorithms, in order to check their reliability in predicting Bouguer gravity anomalies (El Abbas et al., 1990). However, many types of gravity anomalies are routinely used in geodesy and in geophysics. It may sometimes be difficult to determine which type is a priori suited for prediction. A constant crustal density value generally used in different computations might be too far from the reality below the earth topographic surface in complex geological areas. Residual anomalies that are deduced from free-air (FAA), simple Bouguer (BA), complete Bouguer (CBA) and isostatic (IA) anomalies might also be smoother than the original anomalies in some areas. These anomalies are now easily computed using the spherical harmonic coefficients of a global geopotential model (GGM) (Kamguia et al., 2007).
This paper presents the results of comparison of various types of gravity anomaly predicted with some methods commonly and in different areas of Cameroon . These anomalies were computed from a homogeneous database containing 43,000 data points. The aim is to give some hints as to the most appropriate gravity anomaly prediction strategy according to the density of the gravity net, their geographical distribution and the relative complexity of the geology of the study area. To achieve this, four areas with different geological characteristics are chosen. In these areas of different extension and gravity net density, six prediction algorithms are tested: the Minimum Curvature Splines in Tension (Smith and Wessel, 1990); the Least Square Polynomial Fitting (two variants); Krigging (Krige, 1978) and the inverse distance to a power method (two variants).
2. Gravity anomaly prediction
2.1. Characteristics of gravity anomalies
Different types of gravity anomaly are used in earth sciences. Gravity data recorded on land must be adjusted for elevation above or below sea level to yield the free-air anomalies (FAA). They are nearly equivalent to what would be observed if all the topographic masses were condensed onto this reference surface (Blakely, 1996). Simple and complete Bouguer gravity anomalies (BA and CBA) are obtained by completely removing the masses that exist between the level of observation and sea level. They are in theory smoother and then more suitable for prediction than the FAA (Heiskanen and Moritz, 1967). However, in complex geological contexts, the gravity field may have special characteristics. Therefore, BA and CBA may be rougher than FAA. The isostatic reduction regularizes the earth’s crust according to a model of isostasy. Depending on the complexity of the geology of the study area, these anomalies may be less or more suited in prediction processes than FAA, BA and CBA.
From spherical harmonic coefficients of global geopotential models (GGM), the long wavelength components of FAA, BA, CBA and IA are easily computed. After subtraction from respective total field gravity anomalies, the residual anomalies obtained may be smoother in some areas. The long wavelength anomalies (ΔgGGM) are computed from the harmonic coefficients of the GGM using equation (1) and subtracted from the total field gravity anomalies (Δg) (Heiskanen and Moritz, 1967):
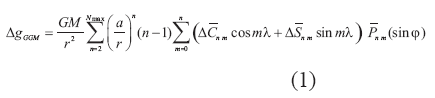
where GM is the geocentric gravitational constant; (r, λ,θ) the spherical coordinates of the computation point; g the normal gravity on the reference ellipsoid; a the equatorial radius of the earth; Pnm(sin θ) the fully normalized associated Legendre functions for degree n and order m ; ΔCnm and ΔSnm the normalized EGM-GGM harmonic coefficients, reduced for the even zonal harmonic for the ellipsoid and complete to degree and order Nmax= 360 .
2.2. Prediction of gravity anomalies and statistical analysis
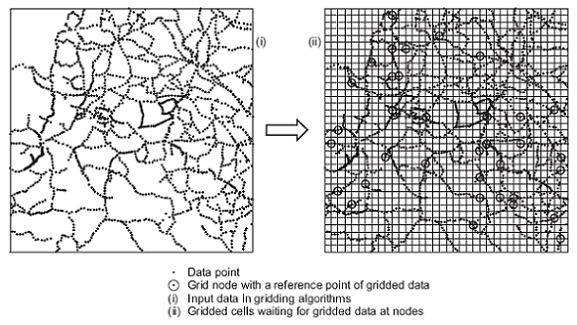
The gravity is a regionalized field, since it varies from place to place in a continuous manner but with no possibility of associating a specified mathematical function. The most accurate gravity anomaly prediction technique is the one that maintains the broad and fine features of the original gravity data processed, without introducing undue distortions. Therefore, the predicted and the measured values must at the same point should be mathematically and/or physically related. To achieve this, the criterion of Crain and Bhattacharyya (1967) is important.To apply the criterion, some data points must be selected to serve as reference points (Fig. 1). A reference point is a data point with coordinates nearly coinciding with those of a grid node. The predicted and known values are therefore comparable in a simple statistical analysis of their differences.
3. A case-study in Cameroon (Central Africa)
3.1. Characteristics of the gravity field in Cameroon
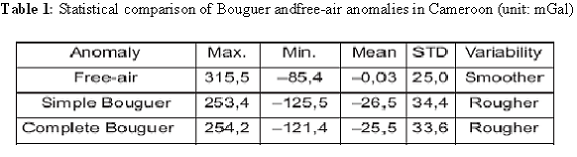
Free-air gravity anomalies are smoother than BA and CBA in Cameroon , as is indicated in Table 1. In this table, the standard deviation (STD) of the BA and CBA are nearly 10 mGal greater than the FAA’s. This means that the gravity field in Cameroon possesses special features. One can therefore conclude that:
● A constant density 67(r = 2.67 g.cm-3) used in the Bouguer reduction does not effectively suppress the effect of the topography above the reference surface in Cameroon ;
● The disturbing geological masses responsible of the observed gravity anomalies cannot be easily determined here;
● The geology of Cameroon is more complex than it looks like.
In this context, interpolation of gravity anomalies may be subject to many errors if the more indicated method and especially the suitable type of gravity anomaly are not used.
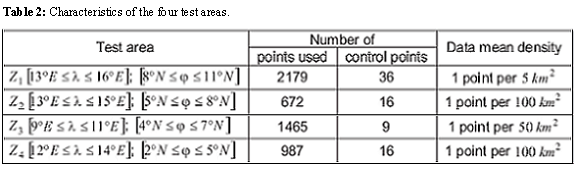
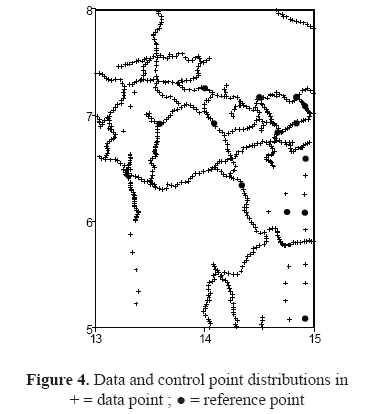
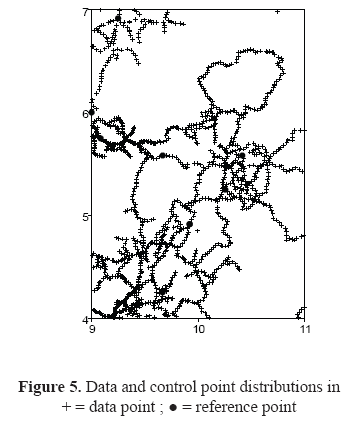
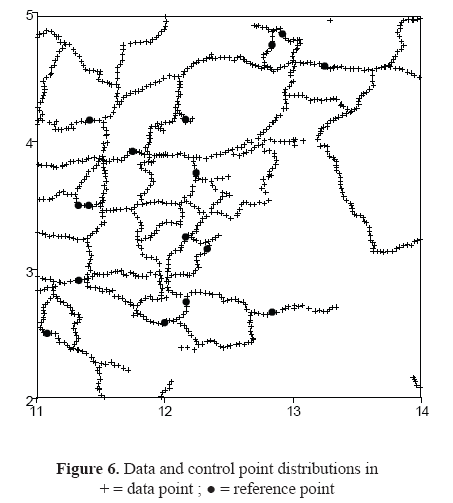
Four test areas (Z1, Z2, Z3, Z4) (Fig. 2) were selected in order to precise the special features of the gravity field and its behaviour in predictionprocesses. Their selection is based on the differences in geological characteristics, the density and distribution of the data points, and the relative roughness of the topography relief of the area. The principal characteristics of these areas are summarized in Table 2.
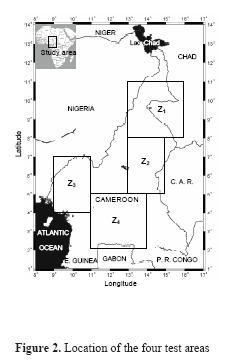
The first test area Z1 is located in the northern sedimentary region of Cameroon . The area is characterized by a long wavelength relatively positive Bouguer anomaly attributed by Adighije (1981), and Fairhead and Okereke (1987) to an uplift of the Moho. The topographic relief has a mean orthometric height of about 1000 m. Gravity data are more denser in this test area. The second test area Z2 is situated on the North eastern extension of the Cameroon volcanic line (CVL). It is characterised by large negative Bouguer anomalies oriented E-W from western Cameroon to western C. A. R. These are attributed to a light mass anomaly structure in the upper mantle beneath the Adamawa uplift (Fairhead and Okereke, 1987; Poudjom et al., 1992). The mean elevation is greater than 1000 m. The gravity data density is the smallest in this test area.
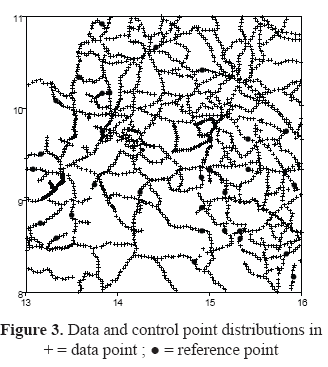
Z3 is located on the continental part of the CVL. This line is associated with a series of NESW trending gravity lows not well defined by the reconnaissance survey of Collignon (1968). The mean height of the area is nearly 2000 m, with a maximum of 4010 m for Mount-Cameroon. The gravity data density is intermediate to those of Z1 and Z2 . The area Z4 is situated in southern Cameroon . The mean height is lower than in theprevious test areas and the gravity data density is comparable to what is observed in Z3 . The distributions of data in each test area are shown in figures 3 to 6. The reference points are well distributed in Z1 . The numbers of these points in the test areas are enough for an informative analysis of predicted gravity anomalies.
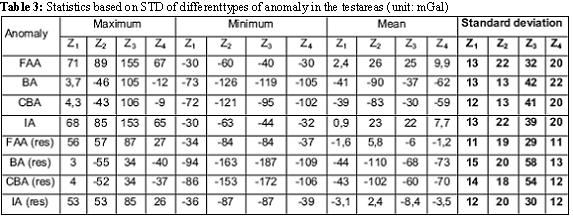
Table 3 shows the statistics of the anomalies to be interpolated in the test areas. From the analysis based on the STD, one can see that the total field Bouguer and isostatic anomalies are not always the smoothest. The gravity field has special characteristics in Cameroon and its surroundings. The high frequency components of this field, created by the topography relief, are not entirely removed after the Bouguer and isostatic reductions. By smoothing FAA, BA, CBA and IA with subtraction of the longer wavelength components computed using equation (1), four residual types of anomaly specified by (res) in table 3 are computed.
The differences between the measured and interpolated anomaly at the reference points are computed in each area and for each type of anomaly. A statistical comparison is made. The analysis is made on the standard deviations (STD) of the differences between anomalies. Where the STD are small, the interpolation technique is said to be most accurate. The GGM used in residual anomaly computations is EGMGGM,the most representative of gravity data in the central African subregion (Kamguia et al., 2007).
The residual free-air anomalies FAA(res) are smoother than all the other types of anomaly, except in area Z2 where the total gravity Bouguer anomalies (BA and CBA) are the smoothest (STD = 13 mGal). The difference between the STD of the residual anomalies is nearly 1 mGal. The STD of residual Bouguer and isostatic anomalies are greater than the STD
of total gravity Bouguer and isostatic anomalies and than the STD of residual free-air anomalies in some areas.
In conclusion, CBA and BA are the smoothest anomalies in Z2 while FAA(res) is the smoothest in Z1 , Z3 and Z4 . FAA(res) is therefore smoothest type of anomaly in Cameroon . It is the only residual anomaly used in the analysis made below.
3.2. Comparison of prediction results
The FAA(res) were treated with the total gravity free-air, Bouguer (simple and complete) and isostatic anomalies with the above interpolation methods (and their variants). Table 4 shows the results of statically analysis based on STD of the differences between predicted and known data at the reference points.
Table 4: Summary of the STD of interpolation results in test areas (unit = mGal)
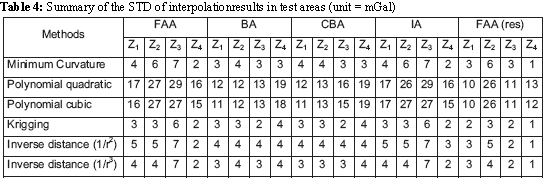
From Table 4, one can conclude that the accuracy of predicted anomalies depends bothon the interpolation method, the variability of the anomaly used and the test area considered. However, the choice of the type of anomaly to interpolate is more pertinent than the method and the area. The smoother the anomaly interpolated, the less are the interpolation errors, represented here by the STD. For the same type of anomaly interpolated, the krigging and the inverse distance to power 3 methods gave the most accurate results, with approximately the same precision. The best precisions are 2 mGal, 3 mGal, 2 mGal and 1 mGal in test areas (Z1 , Z2 , Z3 , Z4 ) respectively. Hence, when the best gridding method is used in conjunction with the smoothest anomalies, a precision of about 2 mGal is obtained after interpolation.
4- DISCUSSIONS AND CONCLUSIONS ACCURATE INTERPOLATED GRAVITY ANOMALIES
are needed in geodetical and geophysical analyses. These anomalies are obtained if the interpolation method and the type of anomaly used are carefully selected. Theoretically, Bouguer gravity anomalies are smoother and therefore suited for prediction processes than free-air anomalies. However, this is only true in an area with simple geology where a constant crustal density of 2.67 is nearest to the real value. For specific geological, geophysical and geodetical studies in such areas, if Bouguer anomalies are interpolated, the information deduced from the gravity interpretations (such as subsurface modelling, basin exploration, geoid computation …) will be biased.
Residual free-air anomalies can be smoother than total gravity free-air, Bouguer and isostatic anomalies in many areas. They are easily computed using the spherical harmonic coefficients of a global geopotential model. After reconstruction of the total gravity free-air anomalies from interpolated residual anomalies, any type of gravity anomaly may be deduced. These residual free-air anomalies are associated to smaller errors in gravity anomaly prediction in Cameroon . The krigging method and the inverse distance to power 3 performed approximately equally as best prediction methods.
The geology of Cameroon seems more complicated and only a digital density model may introduce adjusted crustal density values into Bouguer gravity reductions. The number of interpolation methods tested is very limited, just for clarity reasons. If the data were very dense in Cameroon , many grid intervals would have been tested.
ACKNOWLEDGMENTS
The authors would like to thank the following individuals and organizations: Mr. Sylvain Bonvalot of IRD (Institut de Recherche pour le Developpement), for giving the IRD gravity data during the computation of the first geoid model of Cameroon, and Mr. Bernard Langellier of BGI (Bureau de Gravimetrie International) for making these data accessible.
REFERENCES
1. ADIGHIE, C. I., 1981. A gravity interpretation of the Benue Trough, Nigeria. Tectonophysics, 79, pp. 109-128. [ Links ]
2. BLAKELY, J. R., 1996. Potential theory in gravity and magnetic applications. Cambridge University Press. 441 pages. [ Links ]
3. COLLIGNON, F., 1968. Gravimetrie de reconnaissance, Cameroun, Rapport ORSTOM , 35 p. [ Links ]
4. CRAIN, I. K. and BHATTACHARYYA, B. K., 1967. Treatment of non-equispaced two dimensional data with a digital computer. Geoexploration, Vol 5, pp. 173-194. [ Links ]
5. EL ABBAS, T., JALLOULI, C., ALBOUY, Y. and DIAMENT, M., 1990. A comparison of surface fittingalgorithms for geophysical data. Terra-Nova, Vol. 2, N° 5, pp. 467-475. [ Links ]
6. FAIRHEAD, J. D. and OKEREKE, C. S., 1987. A regional gravity study of the West African rift system in Nigeria and Cameroon and its tectonic interpretation. Tectonophysics, 143, pp. 141-159. [ Links ]
7. HEISKANEN, W. A. and MORITZ, H., 1967. Physical Geodesy. Freeman, Sanfrancisco, 364 pages. [ Links ]
8. KAMGUIA, J., TABOD, C.T., NOUAYOU R., TADJOU, J. M., MANGUELLE-DICOUM, E. and KANDE, H. L., 2007. The local geoid model of Camerron, CGM05. Nordic Journal of Survey-ing and Real Estate Research, Vol.4 ( 2), pp. 7-23. [ Links ]
9. Krige, D. G., 1978. Geostatistics for ore evaluation. South African Institute of Mining and Metallurgy, Johannesburg, South Africa. 50 pp. [ Links ]
10. Poudjom-Djomani, Y. H., Diament, M. and Albouy, Y., 1992. Mechanical behaviour of the lithosphere beneath the Adamawa uplift ( Cameroon , West Africa) based on gravity data. Journal of African Earth Sciences, 15 ( 1), pp. 81-90. [ Links ]
11. Smith, W. H. F. and Wessel, P., 1990. Gridding with continuous curvature splines in tension. Geophysics, Vol. 55, N°3, pp. 293-305. [ Links ]
12. Wessel, P. and Smith W. H. F., 1995. New version of GMT released: Transactions of the American Geophysical Union 72 ( 441), pp. 445-446. [ Links ]

