


Serviços Personalizados
Journal
Artigo
 Inglês (pdf)
 Artigo em XML
 Referências do artigo
 Enviar este artigo por email
Indicadores
-
 Citado por SciELO
 -
 Acessos
Links relacionados
-
 Citado por Google
 -
 Similares em
SciELO
Similares em
SciELO -
 Similares em Google
Compartilhar

 Permalink
Earth Sciences Research Journal
versão impressa ISSN 1794-6190
Earth Sci. Res. J. v.11 n.2 Bogotá jul./dez. 2007
HYDRAULIC PROPERTIES OF SEDIMENTARY DEPOSITS AT THE CONSTRUCTION SITE OF A PROTON ACCELERATOR (J-PARC), JAPAN
Adrian H. Gallardo 1,2,*, Atsunao Marui 1
1 AIST, Geological Survey of Japan, Quintessa Japan , Yokohama 220-6007
2Hytec Co. Yodogawa-ku, Miyahara 2-11-9, Osaka 532-0003, Japan
*Corresponding author. A. H. Gallardo. Tel/Fax: +81-29-861-3684
E-mail: ad.gallardo@aist.go.jp
Manuscript received June 30, 2007. Accepted for publication November 20, 2007.
ABSTRACT
Hydraulic characteristics of sediments were investigated at J-PARC for the purpose of site characterization in relation with the construction of Japan ’s largest proton-accelerator. A total of 340 samples extracted from 9 exploratory wells were examined by standard laboratory tests and complemented with statistical analyses to quantitatively determine the main terrain attributes. Two main hydro-geological units were recognized, although a number of embedded layers defined a multilevel aquifer. Grain-size distribution derived from sieve analysis and the coefficient of uniformity showed that soils are poorly sorted. On the other hand, hydraulic conductivity was measured by a number of parameters such as a log-normal distribution. Conductivity was also predicted by empirical formulas, yielding values up to three orders of magnitude higher. Discrepancies were explained in terms of soil anisotropy and intrinsic differences in the calculation methods. Based on the Shepherd’s approach, a power relationship between permeability and grain size was found at 2 wells. Hydraulic conductivity was also correlated to porosity. However, this interdependence was not systematic and therefore, properties at many parts of the profile were considered to be randomly distributed. Finally, logs of electrical conductivity suggested that variations of soil hydraulic properties can be associated to changes in water quality. In spite of the remaining uncertainties, results yielded from the study are useful to better understand the numerical modelling of the subsurface system in the site.
Key words: drill core, soil properties, heterogeneity, site characterization, proton accelerator.
RESUMEN
Las características hidráulicas de los sedimentos fueron investigadas en J-PARC con el proposito de caracterizar sitios relacionados con la construcción del acelerador de protones más grande de Japón. Un total de 340 muestras extraídas a partir de 9 pozos exploratorios fueron examinadas a partir de pruebas de laboratorio estándar y complementadas con análisis estadísticos para determinar cuantitativamente las cualidades principales del terreno. Dos unidades hidrogeológicas principales fueron reconocidas, aunque un número de capas encajadas definieron un acuífero de niveles múltiples.
La distribución del tamaño del grano derivada de análisis de tamices y del coeficiente de uniformidad demostró que los suelos están mal clasificados. Por otra parte, la conductividad hidráulica fue medida a partir de un número de parámetros tales como una distribución logarítmica normal. La conductividad también fue predicha por medio de fórmulas empíricas, mostrando valores de hasta tres órdenes de magnitud. Las discrepancias fueron explicadas en términos de la anisotropía del suelo y diferencias intrínsecas en los métodos de cálculo. Basados en la aproximación de Shepherd, se encontró una fuerte relación entre la permeabilidad y el tamaño de grano en 2 pozos.
La conductividad hidráulica también fue correlacionada con la porosidad. Sin embargo, esta interdependencia no era sistemática y por lo tanto, propiedades en muchas partes del perfil eran consideradas como distribuidas aleatoriamente. Finalmente, los registros de la conductividad eléctrica sugirieron que las variaciones de las propiedades hidráulicas del suelo se puedan asociar a los cambios en la calidad del agua. A pesar de las incertidumbres restantes, los resultados del estudio son útiles para entender mejorar el modelamiento numérico del sistema subterraneo en el sitio.
Palabras claves: Nucleos, Propiedades del suelo, Heterogeneidad, Caracterización del sitio, Acelerador de protones.
1.INTRODUCTION
Construction of the world-largest high-intensity proton accelerator has been initiated within the denominated J-PARC facilities (Japan Proton Accelerator Research Complex) at the coasts of Tokai village, about 100 km from Tokyo. In this context, a detailed study of the hydraulic conditions of the main sedimentary units was carried out to latter simulate the groundwater flow at the site. Groundwater is the primary pathway by which radionuclides can migrate from the underground to the biosphere (Fairhurst, 2004), so understanding the flow, and the type and characteristics of the geologic medium plays a fundamental role to assess the safety of the accelerator.
Soils are heterogeneous systems with regions more or less favorable to flow distributed spatially in intricate patterns (Giménez et al., 1999). Lithofacies usually show high spatial variability and as a result, the associated hydrologic and physical properties can be of appreciable different character. As the problem of adequately modeling subsurface becomes more difficult with increasing heterogeneity, determinations based on a large amount of samples have great importance to draw reliable conclusions. An extensive analysis of drill cores appears to be a powerful way to delineate sedimentary structures and to define the formation properties.
Impervious materials are the most favorable for radio-nuclides isolation and consequently, determination of hydraulic conductivity becomes of paramount importance. Pumping and slug tests are frequently used to measure it in porous media; however, the analysis of textural parameters is a comparatively cost-effective and quick technique which has also the advantage of providing information at a more detailed scale. In this line of thought, saturated hydraulic conductivity can be approximated either from laboratory measurements or by empirical formulas derived from the size of the granular sediments (Vukovic and Soro 1992). Moreover, Shepherd (1989) derived a power function between permeability and particle size which does not depend on the temperature of the medium, Thus, one of the main concerns in this work was to find an adequate relationship to improve the predictability of the hydraulic conductivity, being at the same time of simple application. Data on the grain size distribuition must necessarily be taken into account to purse the analysis.
The hydraulic conductivity of the soil is determined by the arrangement of the solid and void spaces (Vervoort and Cattle, 2003) which means, porosity changes will influence permeability and hence the possible transport of the radionuclides (De Craen et al., 2004). For soils of similar origin, the relationship of permeability to porosity can be strong (Ahuja et al., 1989) however, the studied field is complex and substantial deviations can be expected. To improve the site characterization, the possible interdependence of both hydraulic properties will be also examined.
Summing up, the present work presents the results obtained from nine exploratory boreholes within J-PARC, evaluating the sedimentary sequence and investigating the main soil properties to effectively characterize the hydrogeology of the site. Attempts are also made to correlate the observed parameters, and to establish the existence of meaningful patterns. The study provides relevant information for the construction and safety assessment of the proton accelerator.
2. Site Location and Geological Setting
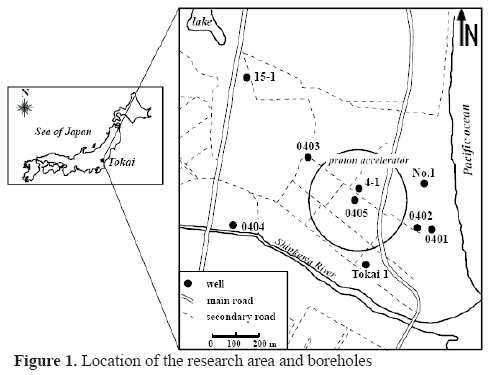
The J-PARC complex locates at Tokai village, Ibaraki prefecture, approximately 100 km northeast of Tokyo. Investigated wells are essentially concentrated around the proton accelerator, a circular area of about 500 m of diameter close to the mouth of the Shinkawa River(Fig. 1).
The regional geology has been extensively studied by Sakamoto et al. (1972), who identified the basement of the area as a marine sequence of turbidite and slump deposits from the late Cretaceous. The strata reach up to 1,500 m of thickness. Above it, the Neogene Tertiary is occasionally exposed on sea and terrace cliffs. The Taga formation from the late Miocene outcrops along the Shinkawa River, and was reached by drilling at about 50 m below the ground. This unit consists mainly of marine siltsones or sandy siltstones with abundant molluscan fossils. Intercalated tuffs would correspond to subaqueous pyroclastic flows. Their thickness ranges from nearly 10 m at the inland wells, progressively reducing to a minimum of 1mtowards the seaside. In discordance, the base of the Pleistocene is given by the Miwa formation, deposited during the last interglacial transgression. In the site, its lower part reaches a maximum of 30 m in thickness, and is composed of gravels and mud that filled the valleys at the early phase of the sea level rise. On the other hand, the upper end has a thickness between 15 and 20 m and consists mainly of sands and pebbly sands deposited at the maximum stage of the transgression. Overlying the Miwa formation, the fluvial gravels of the Nukada Terrace were deposited in unconformity during a regressive period in a transient standstill. Further regression was responsible of the formation of subsequent terraces (Takai and Tsuchi, 1963). Finally, recent deposits of alluvium are present along the streams and river, while a belt of sand dunes extends along the shoreline.
3. Material and methods
3.1 Monitoring wells and coring
Nine exploratory wells were developed around the accelerator ring, and soil specimens were recovered continuously at intervals of 1 m by the hybrid boring method (Hytec Co, 2004). This technique was originally designed for subsurface exploration in damns and is currently being tested in many other underground works in Japan . As in standard methods, sampling consists in driving a hard bit into the desired depth and coring the material directly into a double steel tube with an internal diameter of 68 mm. However, the success of the hybrid boring relies in the circulation fluid. A dry foam based on air bubbles originates a fluid that improves considerably the cores recovery even in non-cohesive sediments as beach sands. Soil recovery was close to 100% up to depths of 200 m. After retrieving, soils were removed from the barrels and wrapped in humid polyethylene to prevent desiccation, and finally packaged in sealed wooden-boxes. While all cores were numbered, logged and photographed, a subset of about 340 representative samples was used for the physical analyses.
3.2 Soils physical analysis
The grain-size distribution in soils was determined by sieve analysis for particles above 63 μm, and by an analyzer Shimadzu SA-CP3L for finer sizes. The coefficient of uniformity (Cu) was derived from the formula:
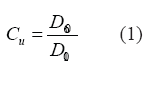
where D60 and D10 represent the diameters corresponding to the percent finer of 60% and 10% respectively.
For conductivity measurements, a 100 cc can was driven into the cores avoiding fracturing or shrinkage. It was left overnight in water to reach saturation, weighted, and finally tested by the falling head method. The results were corrected to a water temperature of 15 ºC in accordance with standard methods. After the analysis, samples were oven-dried at 105 ºC during 24 h, re-weighted, and total porosity (n) was calculated by the relation:

where n: total porosity of the sediment (as percentage); Vw: volume of water filling the sample voids; and Vs: total volume of the sample. The weight of the water removed was converted to volume considering its density as 1 g/cm3. Although it is quite difficult to completely saturate a sample (Freeze and Cherry 1979), this simple method produced quick and satisfactory results.
For control and comparison purposes, hydraulic conductivity was also calculated from the grain-size distribution. The method of Creager et al. (1945) provided a straightforward relation between the effective grain-diameter of 20% weight content (D20) and conductivity. Kasenow (2002) the formulas of Slichter and Sauerbrei were also considerated appropiate for the analysis. The Sauerbrei formula is applicable when the grain-size diameter is no greater than 0.5 mm. It can be written as
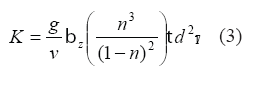
while the Slichter formula can be applied for an effective grain diameter (de) ranging between 0.01 and 5 mm. It takes the form of:
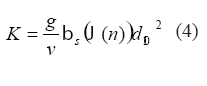
In Eqs. (3) and (4), K, hydraulic conductivity (L/T); g, gravitational constant (L/T2); ν, kinematic viscosity for a given temperature (L2/T); n, porosity (unitless);βz and βs, constants; τ correction for temperature; ϧ(n) porosity function; and d, effective grain diameter (L).
4. Results and discussion
4.1 Hydrological setting
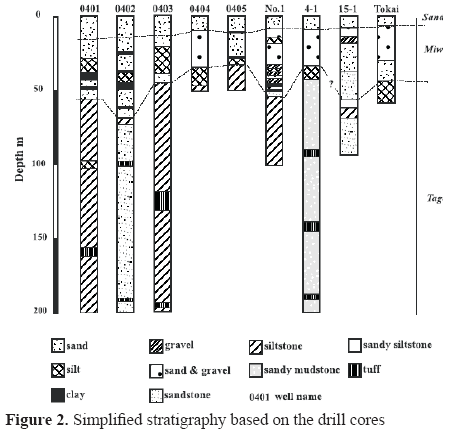
The top of the hydrostratigraphic sequence is characterized by a complex of sand and conglomerates with a thickness that varies from 13 to about 55 m (Fig. 2). The uppermost 10-13 m of the unit contains basement pebbles and rests of shells attributed to beach and fluvial deposits. The water table is found at an average of 6 m below the ground, sustaining a great number of residential wells used for irrigation and domestic needs. The successive fluctuations of the sea level over geologic times have enhanced the intercalation of thin horizons of silts and clays that cause local confinement at specific sites. Siltstones of the Taga formation constitute the bottom of the unconfined aquifer. There is some presence of interbedded tuffs and sandy lenses with a thickness ranging from a few cm to nearly 5 m. A somewhat different stratigraphic scheme is seen at well 0402 where fine sandstones occur throughout the borehole to a depth of 200 m. The hydraulic contact between both Quaternary and Tertiary sandstones might suggest the existence of an irregular unconfined aquifer extending along the coastal plain.
4.2 Physical properties
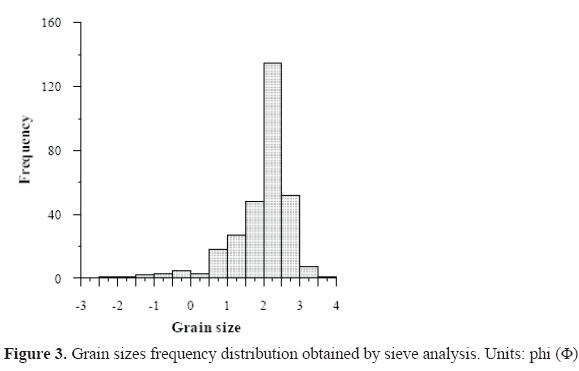
Grain size is a fundamental physical parameter of sediments and, as such, is a useful descriptive property (Friedman et al., 1992). A frequency distribution of the whole population showed that the sediments tend to be unimodal, with a mode of Φ2.2 (fine sands), and a negative skewness toward very fine sands (Fig. 3). For a better interpretation, soils were discriminated between Tertiary and Quaternary origin. Results indicated that the shallow fluvial and beach deposits have a relatively larger mode, in the order of Φ1.1 (medium sand), whereas there are no significant differences in the values and distribution for the rest of the strata. Differences in grain size between shallow and deep sediments might be associated with variations in the depositional environments. Fluvial sediments generally have coarser grains than units deposited in coastal environments, and their mean and maximum grain size commonly reflects the average energy of the depositional medium (Boggs Jr., 1987). Particles over 2 mm normally consist of shell fragments and basement-derived pebbles transported under conditions of high flow. Although simple, the two distinguished sections of the profile supported the distinction between terrigenous deposits near the surface, andtransitional to marine sediments at depth.
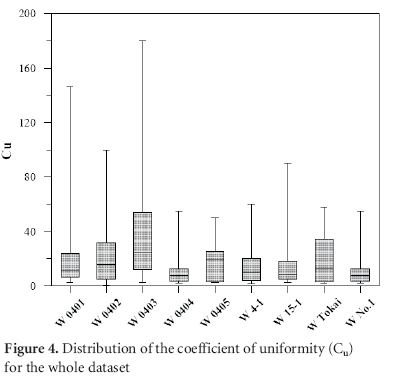
The degree of sorting of a soil can be estimated based on the range of its standard deviation. Following the formula of Folk and Ward (1957), the calculated standard deviation varied from 2 to 3.5 Φ, which correspond to very poorly to extremely poorly sorted sediments (Folk, 1974). A single parameter may not be adequate to distinguish sediments from different wells; therefore, the coefficient of uniformity (Cu) was also calculated. Soils having a coefficient smaller than about 2 would be considered uniform (Lambe, 1951). Such a threshold was exceeded in several orders by the vast majority of the measured samples, demonstrating the good gradation (or poor sorting) of the sediments concerned (Fig. 4). In general, there were no substantial differences in the arithmetic mean of Cu among boreholes with exception of the well 0403, which showed a mean more than twice the value obtained for the rest of the samples. Three groups with different sorting could be qualitatively defined when evaluating the range of Cu at each well. As expected, shallow wells presented the best (although still poor) sorting, as they usually intercepted a limited number of formations also associated to higher homogeneity in their sedimentary attributes. The size range reflects the shortterm random variation of the fluid forces involved in sediment transport (Bridge, 1981). Therefore, it can be assumed that even though shallow sediments would have been deposited in an environment with sufficient energy to transport a wide range of particle sizes, they could have undergone important reworking especially by tides. Finer particles may have been removed by the return flow moving up the front of a beach, leaving behind a population of relatively well-sorted, coarser grains (Boggs Jr., 1987). No meaningful relationship between sorting and geology could be found for wells 0402 and 15-1, while wells 0401 and 0403 presented the widest grain-size distribution throughout the site. In effect, the deeper the well the higher the non-uniformity, as longer soil profiles included more layers and sedimentary horizons, resulting consequently in larger deviations of the Cu. Thus, measuremnts on larger columns are expected to yield more non-uniformity as they add variable thin layers taht are beyond the sallow boreholes.
4.3 Hydraulic conductivity
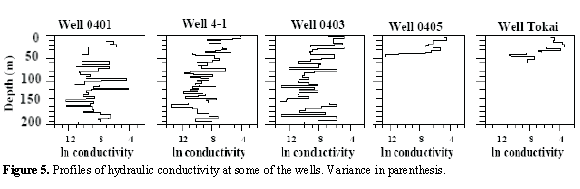
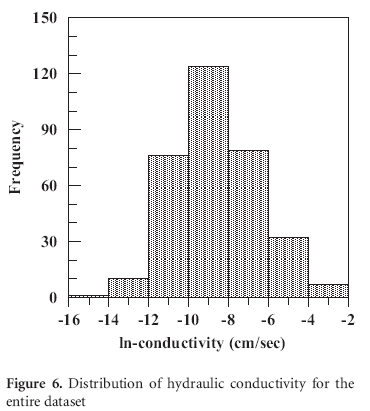
Saturated hydraulic conductivity (ks) is arguably one of the most important hydrologic properties of soils (Mbagwu, 1995). Conductivity values ranged from 4.5 x 10⁻² to 1.3 x 10⁻⁶ cm/sec, with an isolated sample in the order of 10-7 cm/sec within a 1.5 m horizon of fine sands and organic silts at well No. 1. The mean value exhibited an irregular pattern along the profile, except for wells 0405 and Tokai where ks decreased with depth (Fig. 5). Hydraulic conductivity at the upper horizons is two to four times higher than values near the wells bottom, in coincidence with the presence of 20-25 m gravel-filled paleochannels. In addition, roots and root channels related to the original vegetation covering the site could promote water movement through the topsoil layers. Variances calculated for the ln(ks) at each well ranged between σ2 = 1.44 and 7.24 confirming that the variability of the hydraulic parameter within the soil columns is rather distinct. The distribution of permeability in porous media has been usually reported to approximate a log-normal distribution (Freeze, 1975; Sudicky, 1986). A plot for the entire data set shows that hydraulic conductivity in J-PARC is close to this distribution (Fig. 6). This statement was validated by the Shapiro-Wilk test (one sample vs. normal) at the 1% significance level. The test did not reject the null hypothesis of normality (W: 0.99) andconsequently, the sample can be considered to follow a log-normal distribution. To reduce the probability of correlation, the statistical distribution should ideally be evaluated on a random subsample of the data set (Turcke and Kueper 1996). Again, the log-normality of ks was evaluated by the Shapiro-Wilk test for a random set of 100 samples (W: 0.96), confirming that the assumed distribution is correct.
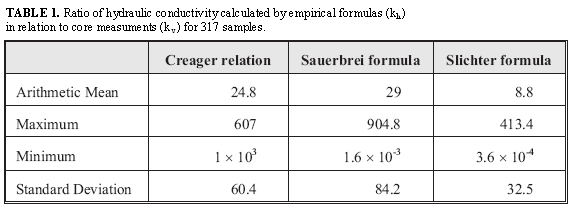
Values derived from core samples represent ks in the vertical direction. However, it is widely known that in heterogeneous aquifers the permeability tends to be different along each of the principal directions. Differences were examined introducing the ratio of horizontal (kh; from empirical formulas) to vertical conductivity (kv; from direct measurements). In general, empirical formulas yielded higher values of ks than direct measurements, with differences sometimes as much as three orders of magnitude. The Slichter formula gave the lowest differences, with a mean kh/kv ratio of 8.8 (Table 1). This mean ratio applied to most of the stratigraphic columns, defining soils of relatively small anisotropy, with some occasional and random discrepancies presumably caused by local heterogeneities in the mineral content or pore distribution. On the other hand, conductivity calculated by the Creager and the Sauerbrei approaches showed a poorer agreement with core measurements. Although, a mean kh/kv ratio of 24.8 and 29 respectively is still fairly consistent, considering differences between the conductivity tensors may range from 1 to 42 (Muskat 1937; Bear 1972). Conductivity showed substantial variations along depth, with differences of more than two orders of magnitude respect kv measurements, and kh calculated by the Slichter solution.
The greatest values of kh were found on the upper 50 m of the sequence, between 70 and 130 m, and at about 160 m. It is reasonable to accept larger variations in conductivity at shallow depths, where unconsolidated fluvial sediments exist. These kind of deposits have been described to be strongly heterogeneous (Jussel et al., 1994), and would be also affected by surface desiccation and human activities, which promote degradation of the upper horizons and enhance the anisotropy of the soils (Regalado and Muñoz, 2004). In contrast, there was no reliable relationship to substantiate the differences in conductivity results at deeper soils. It is possible that sediments that appear to be relatively homogeneous are in fact affected by micro-scale bedding and microscopic textural variations, which imprint the profile its anisotropic characteristics. With respect to the empirical formulas, values derived from the Slichter equation were nearly three times smaller than results obtained by the methods of Creager and Sauerbrei. The origin of the differences should be searched within the formulas themselves. Grain size is the fundamental independent parameter that controls hydraulic conductivity in unconsolidated sediments (Pryor, 1973; Morin, 2006) but empirical formulas were elaborated introducing different relations and therefore, it is not unusual they yield divergent results. Since each formula bases its calculations on a different effective grain-diameter, more emphasis is made on a determined size fraction, which indefectibly leads to discrepancies in the conductivity distribution. Thus, defining the reliability of the determinations remains problematic. Although empirical formulas gave just approximate values of hydraulic conductivity and results must be interpreted with caution, they are consistent with the hypothesis of an anisotropic medium with the major conductivity tensor oriented along the horizontal plane, and the minor direction along the vertical.
As summarized by Shepherd (1989), the correlation of permeability and grain size results in a power expression of the form
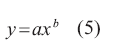
where (y) is permeability when plotted against grain size (x), the coefficient a is the value of y at x = 1, and b is the slope of the line that is fitted to the data. In contrast to other formulas, this equation does not depend on the temperature of the medium (Vrbka et al., 1999). In an attempt to improve predictions, hydraulic conductivity measured at each well was plotted against grain size to find an empirical correlation between both parameters. The best fit was calculated by the least-squares regression. From the nine sets of data only two yielded acceptable values of R-squared (Table 2) in coincidence with the coarse-grain dominated shallow wells . The calculated slopes were in agreement with other reports (Rose and Smith, 1957, Stearns, 1929) although they were somewhat low, which may be an indication of texturally immature sediments and miscellaneous samples from different environmental populations (Shepherd, 1989). No significant relation was seen for the rest of the datasets, possibly due to the mixture of distinct grain sizes.
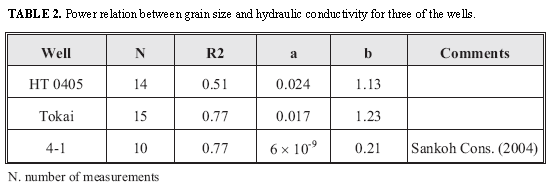
However, a strong correlation has been reported for a subset of samples at well 4-1 (Sankoh Consultants, 2004) suggesting the theoretical expectations might be confirmed within certain facies of the soil profile.
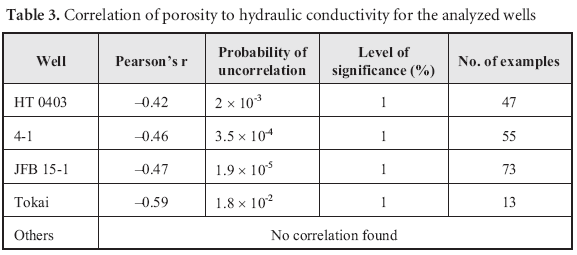
The hydraulic conductivity of granular deposits is also dependant upon porosity (Morin, 2006). Relationships between porosity and hydraulic properties have been identified by previous authors in a suite of geometric and hydrodynamic considerations (Flint and Selker, 2003), so the existence of any trend was investigated for each well dataset by the Pearson correlation coefficient. The null hypothesis (there is no relationship) was rejected at the 1% level of significance at three wells, and at the 2% level for one more borehole (Table 3). In all cases, the relationship was negative suggesting that the permeability of the soil would decrease with an increase in the fraction of fines. Despite it is reasonable to have a negative correlation under certain grain-size
distributions and packing arrangements (Beard and Weyl, 1973; Morin, 2006), it was not possible to find a consistent pattern all over the vertical cross section. Measurements displayed variable curves, and while the relationship is visible at some points, there seems to be no arrangement at other depths. It is also feasible that migration of colloidal particles could significantly affect the permeability of the porous medium at depth (Khilar et al., 1983). In effect, diameter of colloidal matter has been found to increase with depth associated to the increase in groundwater salinity (Düker and Ledin, 1998) contributing thus to clogging the aquifers and causing an important reduction in the permeability of the medium. These changes are likely to be accompanied by reductions in porosity which accounts for some failures in the negative correlation. In sum, it can be concluded that there may be numerous causes for the changes in conductivity in the area, and while the negative trend between conductivity and porosity is significant at many units of the vertical profile, this correlation cannot be generalized to the whole sequence as it is not systematic, and can hardly be associated with specific soil horizons. The variability of soil properties is so complex that only parts of the structure can be described in a deterministic way (Herbst et al., 2005), while the rest probably have to be seen as random realizations (Webster, 2000; Heuvelink and Webster, 2001).
4.4 Profiles of Electrical Conductivity
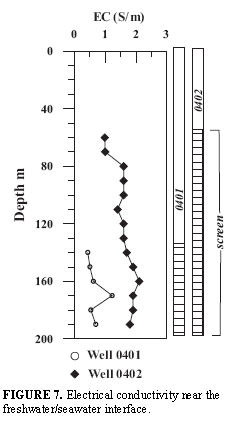
Changes in the physical properties of soils may modify the rates and chemical composition of water entering a well.Figure 7
shows the electrical conductivity (EC) logs obtained for two wells near the seawater/ freshwater interface (Marui, 2005). Values increased with depth, with a marked change in concentrations at 100 and 160 m in well 0402, and 170 m for well 0401. Shallow waters would relate to freshwaters of low EC, while high conductance at depth would be associated either with fossil waters or seawater intrusion. Although not shown here, data collected from other wells indicated the lowest salinities occur in the upper 40 m below the ground, where alluvial deposits of higher hydraulic conductivity promote a rapid inflow of meteoric waters and the existence of a freshwater aquifer. In this way, a preferential path for submarine groundwater discharge has been reported at a depth of 30 m (Itoh et al., 2005). Geology may also explain the larger changes in EC measured at a depth of 100 m in well 0402, where an increase in ions concentration coincided with the intercalation of a thin layer of tuffs. Unlike the upper aquifer, flow would occur in the opposite direction, toward the land. Thus, the change in water chemistry would reflect an increase in Na+ and Cl- concentrations that could correspond to a lobe of seawater intrusion. On the other hand, water quality compared less favorably with physical parameters at other depths. Density-driven flow can be expected to occur along preferential flow paths surrounded by stagnant zones (Schincariol, 1998) however, mixing of water inside wells could have altered the quality of water at different depths. It is possible that seawater flowing through favorable sediments sank due to higher density when entering the wells, which would explain why peaks of salinity occur scattered in the profile. On the other hand, the effect of wells screen may be another factor obscuring changes in conductance as a function of hydraulic properties. In effect, waters of different quality may enter long-screened wells in complex aquifer systems from different depths, so it is not possible to know if poor-quality water is from deeper or shallower sources (Izbicki et al., 2005). Thus, although electrical conductivity logs might constitute a quick and inexpensive tool to delineate major changes of hydraulic properties in sedimentmaterials, results obtained in this study barely were in good agreement with other parameters, which suggests that in complex aquifers, the method can not be preferred over direct measurements of soil physical parameters, at least without a multilevel-well system screened at short intervals all over the profile.
5. Summary and conclusions
Drill cores up to a depth of 200mwere analyzed from a total of nine wells at the coastal area of the J-PARC Research Complex, and the main lithological facies and hydraulic properties of the sedimentary sequence determined.
Deposits are strongly heterogeneous, although two main hydrogeological units can be recognized: Quaternary sand and gravels constitute an unconfined aquifer with a thickness up to 55 m at the top of the profile, while predominant silty sediments from the Tertiary define the lower part of the section. Embedded throughout the sequence there are a number of horizontal layers with variable thickness and composition which actually form a multi-aquifer system with horizons more or less favorable to groundwater flow. As expected, the high variability in the sedimentary structure is associated with important heterogeneities in the parameters distribution. Basic properties as hydraulic conductivity, porosity and grain-size present complex patterns that are difficult to distinguish if the analysis restricts to laboratory determinations thereby, results were also evaluated by geostatistical approaches and specific conductance logs. However, it was still common to detect some inconsistencies in the results suggesting that soil properties not always present a systematic relationship and therefore, parts of the spatial structure would better be explained as random distributions. The hydraulic conductivity was well described by a lognormal distribution. Results from empirical calculations and laboratory tests differed in up to three orders of magnitude leading to the assumption that conductivity in the horizontal direction is appreciably higher than in the vertical one. Furthermore, least-squares regression based on the approach of Shepherd yielded a simple relationship between grain sizes and conductivity at two of the wells, which constitutes an useful alternative to other calculation methods.
A negative trend between porosity and hydraulic conductivity was inferred at four of the wells. It is intuitive to think of a decrease of permeability with an increase in the fine fraction at depth however, this relationship does not appear to be constant and therefore, it is likely that other processes as colloidal migration, surface weathering or soil compaction may be responsible for the changes in the parameters distribution.
The findings of this research are relevant to simulate and predict the response of the soil mass and the groundwater flow to the construction of a proton accelerator however, the high spatial variations observed in the hydraulic properties prevents to make generalizations, and to some degree pose uncertainty when creating a conceptual model of the site, so it is clear there is still a need of further investigations to fully characterize the subsurface environment.
ACKNOWLEDGEMENTS
The authors are especially grateful to Dr. Narimitsu Itoh, Geological Survey of Japan, for his comments and constructive discussions. Many thanks are also extended to Dr. Roger Morin, USGS, for providing us with essential material to accomplish this work. Special thanks are also extended to Mr. Diego Tanaka, School of System and Information Engineering, University of Tsukuba, for his valuable comments on statistics.
REFERENCES
1. Ahuja, L.R., Cassel, D.K., Bruce, R.R., Barnes, B.B., 1989. Evaluation of spatial distribution of hydraulic conductivity using effective porosity data. Soil Science 148 (6), 404-411. [ Links ]
2. Bear, J., 1972. Dynamics of Fluids in Porous Media. Dover Pubns. New York. [ Links ]
3. Beard, D.C., Weyl, P.K., 1973. Influence of texture on porosity and permeability of unconsolidated sand. Am Assoc. Petrol. Geol. Bull. 57 (2), 349-369. [ Links ]
4. Boggs Jr, S., 1987. Principles of Sedimentology and Stratigraphy. Merril Publishing Co. USA. [ Links ]
5. Bridge, J.S., 1981: Hydraulic interpretation of grain-size distributions using a physicalmodel for bedload transport. J. Sed. Petrol 51, 1109-1124. [ Links ]
6. Creager, W.P., Justin, J.D., Hinds, J., 1945. Engineering for dams Vol III, earth, rock-fill, steel and timber dams. John Wiley, New York [ Links ]
7. De Craen, M., Van Geet, M., Wang, L., Put, M., 2004. High sulphate concentrations in squeezed Boom Clay pore water: evidence of oxidation of clay cores. Phys. Chem. Earth 29, 91-103. [ Links ]
8. Düker, A., Ledin, A., 1998. Properties of the particulate phase in deep saline groundwater in Laxemar, Sweden. Wat. Res. 32 (1), 186-192. [ Links ]
9. Fairhurst, C., 2004. Nuclear waste disposal and rock mechanics: contributions of the Underground Research Laboratory (URL), Pinawa, Manitoba, Canada. Int. J. of Rock Mech. & Mining Sci. 41, 1221-1227. [ Links ]
10. Flint, L.E., Selker, J.S., 2003. Use of porosity to estimate hydraulic properties of volcanic tuffs. Advances in Water Res. 26, 561-571. [ Links ]
11. Folk, R.L., 1974. Petrology of sedimentary rocks: Hemphill, Austin, Tex. [ Links ]
12. Folk, R.L., Ward, W.C., 1957. Brazos River bar: a study in the significance of grain-size parameters. J. Sedimentary Petrology 27, 3-26. [ Links ]
13. Freeze, R.A., 1975. A stochastic-conceptual analysis of one-dimensional groundwater flow in nonuniform homogeneous media. Water Resour. Res. 11, 725-742. [ Links ]
14. Freeze, R.A., Cherry, J.A., 1979. Groundwater. Prentice-Hall, Inc., Englewood Cliffs, NJ. [ Links ]
15.Friedman, G.M., Sanders, J.E., Kopaska-Merkel, D.C., 1992. Principles of Sedimentary Deposits. Macmillan Coll. Div. USA. [ Links ]
16. Gimenez, D., Rawls, W.J., Lauren, J.G., 1999. Scaling properties of saturated hydraulic conductivity in soil. Geoderma 88, 205-220. [ Links ]
17. Herbst, M., Diekkrüger, B., Vereecken, H., 2006. Geostatistical co-regionalization of soil hydraulic properties in a micro-scale catchment using terrain attributes. Geoderma 132 (1-2), 206-221. [ Links ]
18. Heuvelink, G.M.B.,Webster, R., 2001. Modelling soil variation: past, present, and future. Geoderma 100, 269-301. [ Links ]
19. Hytec Co., 2004. Drilling of monitoring wells. Geological Survey of Japan, Geo-Barrier group, technical report (in Japanese). [ Links ]
20. Itoh, N., Marui, A., Miyakoshi, A., Ichimura, T., Kubo, T., 2005. Evaluation of the shape and movement of seawater/freshwater interface by multi-point time-series observation. Unpublished report (in Japanese with English abstract) [ Links ]
21. Izbicki, A., Christensen, A.H., Newhouse, M.W., Smith, G.A., Hanson, R.T., 2005. Temporal changes in the vertical distribution of flow and chloride in deep wells. Ground Water 43 (4), 531-544. [ Links ]
22. Jussel, P., Stauffer, F., Dracos, T., 1994. Transport modeling in heterogeneous aquifers: 1. Statistical description and numerical generation of gravel deposits. Water Res. Res. 30 (6), 1803-1817. [ Links ]
23. Kasenow, M., 2002. Determination of hydraulic conductivity from grain size analysis. Water Resources Publications,HighlandsRanch.Colorado. [ Links ]
24. Khilar, C.K., Fogler, H.S., Ahluwalia, J.S., 1983. Sandstone water sensitivity: existence of a critical rate of salinity decrease for particle capture. Chem. Eng. Sci. 38 (5), 789-800. [ Links ]
25. Klute, A. and C. Dirksen. 1986. Hydraulic conductivity and diffusivity: Laboratory methods. In Methods of Soil Analysis, Part 1: Physical and Mineralogical Methods, Second Edition, Klute (editor). p. 687-734. American Society of Agronomy, Madison, WI [ Links ]
26. Lambe, T.W., 1951. Soil Testing for Engineers. John Wiley & Sons Inc. [ Links ]
27. Marui, A., 2005. Survey on the conditions and shape of the freshwater/saltwater interface. Geological Survey of Japan, Geo-Barrier group, technical report (in Japanese). [ Links ]
28. Mbagwu, J.S.C., 1995. Saturated hydraulic conductivity in relation to physical properties of soils in the Nsukka Plains, southeastern Nigeria. Geoderma 68, 51-66. [ Links ]
29. Morin, R.H., 2006. Negative correlation between porosity and hydraulic conductivity in sand - and - gravel aquifers at Cape Cod,Massachusetts, USA. J. Hydrol. 316 (1-4), 43-52. [ Links ]
30. Muskat, M., 1937. The Flow of Homogeneous Fluids through Porous Media, Mc Graw-Hill, New York. [ Links ]
31. Pryor, W.A., 1973. Permeability-porosity patterns and variations in some Holocene sand bodies. Am Assoc. Petrol. Geol. Bull. 57 (1), 162-189. [ Links ]
32. Regalado, C.M., Munoz-Carpena, R., 2004. Estimating the saturated hydraulic conductivity in a spatially variable soil with different permeameters: a stochastic Kozeny-Carman relation. Soil & Tillage Research 77, 189-202. [ Links ]
33. Regli, C., Huggenberger, P., Rauber, M., 2002. Interpretation of drill core and georadar data of coarse gravel deposits. J. Hydrol. 255, 234-252. [ Links ]
34. Reynolds, W.D., 1993. Saturated hydraulic conductivity: field measurement. In: Carter, M.R., (Ed.), Soil sampling and methods of analysis. Lewis Publ., Boca Raton, FL, pp. 599-605. [ Links ]
35. Rose, H.G., Smith, H.F., 1957. A method for determining permeability and specific capacity from effective grain size. Illinois State Water Survey Circular no. 59. [ Links ]
36. Sakamoto, T., Tanaka, K., Soya, T., Noma, T., Matsuno, K., 1972. Geology of the Nakaminato District. Geological Survey of Japan, Quadrangle Series, Tokyo (8), No. 11. [ Links ]
37. Sankoh Consultants., 2004. Comparison experiments on core quality according to boring construction. Geological Survey of Japan, Geo- Barrier group, technical report (in Japanese). [ Links ]
38. Schincariol, R.A., 1998. Dispersive mixing dynamics of dense miscible plumes: Natural perturbation initiation by local-scale heterogeneities. J. Contam. Hydrol. 34, 247-271. [ Links ]
39. Shepherd, R.G., 1989. Correlations of Permeability and Grain Size. Ground Water 27 (5), 633-639. [ Links ]
40. Stearns, N.D., 1929. Laboratory tests on physical properties of water-bearing materials. U.S. Geol. [ Links ]
41. Sudicky, E., 1986. A natural gradient experiment on solute transport in a sand aquifer: Spatial variability of hydraulic conductivity and its role in the dispersion process. Water Resour. Res. 22 (13), 2069-2082. [ Links ]
42. Takai, F., Tsuchi, R., 1963. The Quaternary. In: Takai, F., Matsumoto, T., Toriyama, R (Eds.), Geology of Japan. The University of Tokyo Press, pp. 173-196. [ Links ]
43. Turcke, M.A., Kueper, B.H., 1996. Geostatistical analysis of the Borden aquifer hydraulic conductivity field. J. Hydrol 178, 223-240. [ Links ]
44. Vervoort, R.W., Cattle, S.R., 2003. Linking hydraulic conductivity and tortuosity parameters to pore space geometry and pore-size distribution. J. Hydrol. 272, 36-49. [ Links ]
45. Vrbka, P., Ojo, O.J., Gebhardt, H., 1999. Hydraulic characteristics of the Maastrichtian sedimentary rocks of the southeastern Bida Basin, central Nigeria. J. African Earth Sci. 29 (4), 659-667. [ Links ]
46. Vukovic, M., Soro, A., 1992. Determination of hydraulic conductivity of porous media from grain-size composition. Water Resources Publications, Littleton, Colorado. [ Links ]
47. Webster, R., 2000. Is soil variation random? Geoderma 97, 149-163.Surv. Water Supply Paper 596, pp. 121-176. [ Links ]

