


Serviços Personalizados
Journal
Artigo
 Inglês (pdf)
 Artigo em XML
 Referências do artigo
 Enviar este artigo por email
Indicadores
-
 Citado por SciELO
 -
 Acessos
Links relacionados
-
 Citado por Google
 -
 Similares em
SciELO
Similares em
SciELO -
 Similares em Google
Compartilhar

 Permalink
Earth Sciences Research Journal
versão impressa ISSN 1794-6190
Earth Sci. Res. J. v.11 n.2 Bogotá jul./dez. 2007
SELF-POTENTIAL SIGNALS CAUSED BY ERUPTIONS OF THE GALERAS VOLCANO - COLOMBIA
Greinwald, S. 1; Ortega, A. 2; Rugeles, A. 3; v. Seth, Ips, M. 1
1 Bundesanstalt für Geowissenschaften und Rohstoffe, Stilleweg 2, 30655 Hannover - Germany
2 Instituto Colombiano de Geología y Minería (INGEOMINAS) - Colombia
3 Universidad de Nariño - Colombia
Manuscript received October 13, 2007. Accepted for publication Decembrer 20, 2007.
ABSTRACT
The National Institute of Geology and Mining, INGEOMINAS - Colombia , and the Federal Institute for Geosciences and Natural Resources, BGR - Germany , perform since 1997 as a joint venture multi-parameter measurements at the Galeras volcano, in the southwest of Colombia . Since the end of 1998 the Multi-parameter Station at Galeras (Estación Multiparámetro del Galeras - EMG) includes the continuous monitoring of electromagnetic variations. The electromagnetic (EM) station is located at the north-norh-eastern foot walls of the central cone inside the caldera.
During almost six years of electromagnetic monitoring, the data did not show significant variations of the electromagnetic field, which could be related to the volcanic activity. In July 2004 a new active period of Galeras began with two strong ash emissions. During both emissions strong self potential-(SP) signals were recorded lasting for several hours. The present paper will present the data which could give some indications on the movements of liquids during ash emissions.
Key words: Ingeominas; BGR; Galeras; Electronic monitoring.
RESUMEN
El Instituto Nacional de Geología y Minas, INGEOMINAS - Colombia, y el instituto federal para las Geociencias y Recursos naturales, BGR - Alemania, funcionan desde 1997 como una empresa de riesgo compartido tomando medidas multiparamétricas en el volcán de Galeras, al sudoeste de Colombia. Desde finales de 1998, la estación del multiparamétrica del Galeras (EMG) incluye el monitoreamiento continuo de las variaciones electromagnéticas. La estación electromagnética (EM) está situada en las paredes nororientales del cono central dentro de la caldera. Durante casi seis años de supervisión electromágnetica, los datos no demostraron variaciones significativas del campo electromagnético, que se podrían relacionar con la actividad volcánica. En julio del 2004 un nuevo período de actividad del Galeras comenzó con dos emisiones fuertes de ceniza. Durante ambas emisiones, fuertes señales auto-potenciales (SP) fueron registradas por varias horas. Este artículo presentará datos que podrían dar algunas indicaciones sobre los movimientos de los líquidos durante las emisiones de ceniza.
Palabras Claves: Ingeominas; BGR; Galeras; Monitoreamiento electrónico.
INTRODUCCION
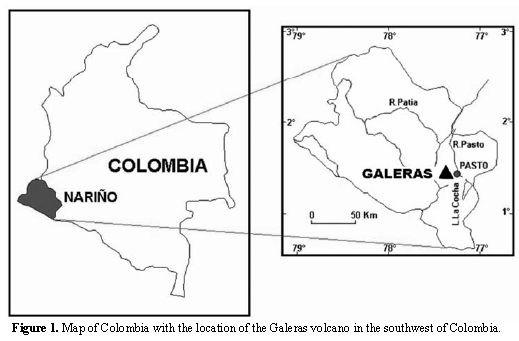
Galeras volcano is located in the southwestern part of Colombia, in the province of Nariño, about 10 km to the west of the city of Pasto, the capital of the province of Nariño with about 350 000 inhabitants (fig. 1). Galeras is a stratovolcano with a caldera of about 4.5 km diameter. A cone shaped crater with about the same height as the caldera rim is located at its center. The caldera is broken and open to the west. Galeras is one of the most active volcanoes of Colombia .
In 1997 a cooperation project between BGR of Germany and INGEOMINAS of Colombia started. Aim of the project was a constant geophysical monitoring of the Galeras volcano. The last eruption before occurred in 1993 and caused the death of 9 people which were inside the caldera at the time of the eruption.
For that purpose a multi-parameter station was installed at the volcano comprising three broadband seismic stations, an EM station inside the caldera, a gas-chemical station, a weather station and regular overflights with a thermal-camera. More information on the concept of the multi-parameter station can be found in Seidl et al. (2003). From the start of the EMG the volcanoes activity was very low and was further decreasing in the following years. Since 2004, however, the volcanic activity is rising. Strong external indications began in July 2004 with two ash fall emissions and since that time the activity level has in-creased. The data, which will be presented in this paper, are connected with the July 2004 emissions.
Description of the electromagnetic station
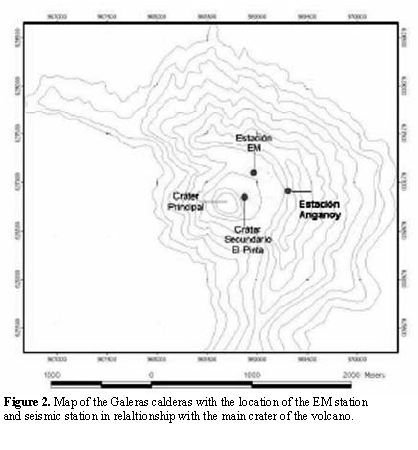
Inside the Caldera of the Galeras the EM station was set up toward the north of the cone of the crater (fig. 2). It was located in a relative flat part at the foot wall of the active cone, at an elevation about 150 m below the rim of the caldera and about 120 m below the peak of the cone. The instruments are powered by batteries and solar panels and therefore independent of regular visits.
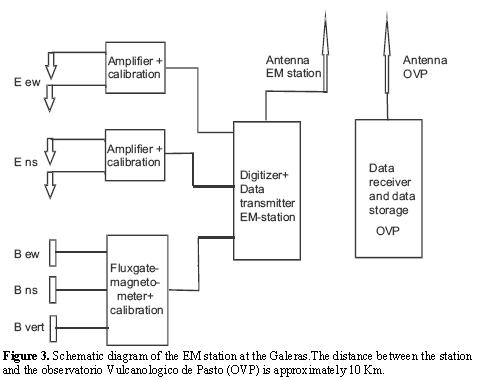
The electric field of the ground is measured in two directions, north - south (NS) and east - west (EW). The NS direction runs more or less perpendicular to the contour lines and in direction of the inclination of the cone walls at the point of the EM station while the EW direction runs more or less parallel to the contour lines. The electrodes used were non-polarizable copper-sulphate electrodes. The electrode separation for each component was 100 m. In addition to the electric field, the three components of the magnetic field are recorded, NS, EW and vertical, using a Fluxgate magnetometer, with a sensitivity of 0.1 nanoT. The data of the two electric channels and the three magnetic channels are digitized with a 24 bit Guralp digitizer with 50 samples per second for each channel (fig. 3) and are automatically transmitted to the Observatorio Volcanológico de Pasto (OVP) and registered there on hard disc.
DESCRIPTION OF THE DATA
Figure 4 shows a continuous record of SP-data from July 4th to July 25th 2004. Only one interruption occurs, lasting from midday July 18th - July 19th and was caused by a power failure due to ash fall after the first eruption. After clearing the solar panels the station worked again. The end of the measurements on July 25th was caused by the ash falls on the second eruption. At that time it was too dangerous to visit the station and clean it again. Later on the station was completely destroyed by rock fall.
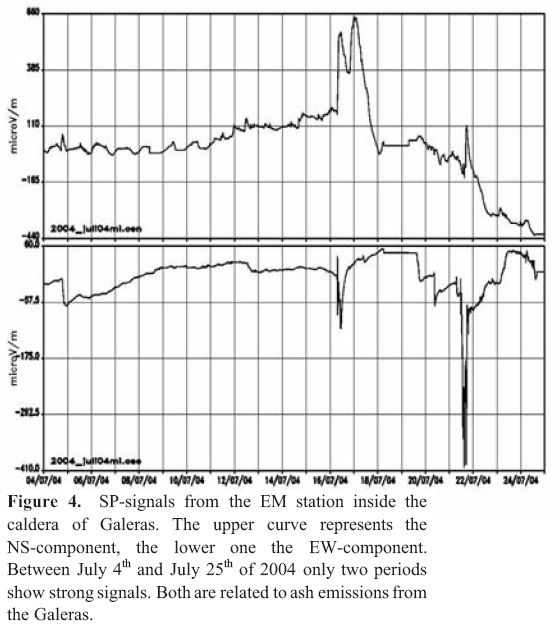
The SP data of Galeras contain a wide spectrum of time variations. The main sources for these variations are changes of the magnetic field in the ionosphere caused by solar activity. Due to the position of the Galeras, just about 1° north of the equator, the magnetic field shows constantly and very strong the 24 hour period of the equatorial electro-jet. Many other effects induced by the ionosphere are also clearly visible. The average amplitudes of the daily variations are less than 100 μV/m. All short period variations (shorter than 3 minutes), however, are eliminated in the figures presented, which are based on data with a reading frequency of one sample per minute.
Other signals visible all the time are cultural effects caused by technical installations inside the city of Pasto in a distance of less than 10 km or by a power line which leads up to the top of the Galeras to feed a TV transmitter and some communication systems of the Colombian army and police. These signals show constantly irregular variations. During night time the amplitudes are much smaller than during the day due to the reduced human activity.
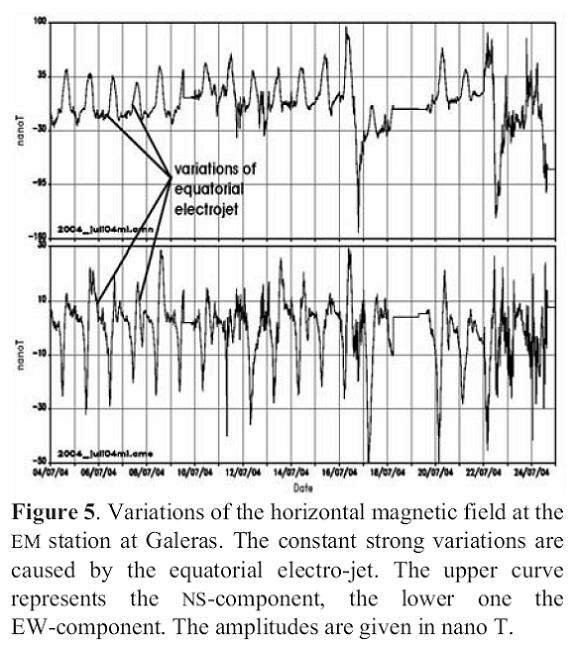
Figure 5 represents the changes of the magnetic field for the same time period. Here the all dominating effect is the equatorial electro jet. All cultural effects are much smaller than in the electric field. One effect deserves being mentioned: the sudden and strong change of the amplitude in all components on July 16 about one hour before the beginning of the volcanic eruption at that day. It signals the start of aworld wide magnetic storm. Figure 6 shows a comparison of the magnetic field of this day recorded at the Galeras EM-station and at the magnetic observatory in Kourou (French Guyana). This sudden magnetic effect is visible clearly in both stations.
Emission of July 16th (Fig. 7) signals during the ash fall emissions
On July 16th 2004 the first ash fall emission occurred after a quiet period of more than 11 years. Following a rise in the seismic activity, the first ash emissions started on July 16th at 14:01 UTC. The seismic activity continued with a constant tremor for several hours. It is difficult to determine the exact end of the tremor, but most probably occurs at about 18:00 UTC.
In Figure 7 the SP-signals are shown together with the signals of the seismic activity, calculated from the vertical component of the seismic station Anganoy (location see fig. 2). This information is given to demonstrate the correlation between the seismic and the electric effects.
The SP-signals start at the same time as the seismic tremor, in both components of the electric data. At the NS-component follows a rise in signal amplitude of about 450 ìV/m. It continues with a flat top for about 4 hours and finally decays for 8 hours. In the EW-component we see continuous changes of the signal amplitudes up to 100 ìV/m. These are followed by a decay of voltage of 120 ìV/m. At the same time (17:45 UTC) both components of the electric field start to move towards there original level before eruption. The EW-component ends at the same level while the NS-component remains at an offset of about 200 ìV. While the short-period features in both components look similar, the main difference are the much stronger short time movements (periods less than 1.0 hours) in the EW-component. The SP-sig-nals indicate an end of the emission of liquids and
perhaps also of the ash eruption at about 17:45 UTC.
Emission of July 21th (Fig. 8)
The second ash fall on July 21th starts with a sudden rise in the seismic activity at 21:16 UTC. The seismic activity stays at a high level until it stops at 3:25 UTC on July 22th. This seismic activity consists of a continuous series of tremor pulses.
The behaviour of the SP-channels during this ash fall emission appears quite different from the first one. While the start of the seismic activity does not seem to influence visibly the NS-component, the EW-component shows a strong spike like feature. Immediately after the spike the EW-component starts with small short period variations (periods of less than 0.5 hour). At about 22:00 UTC additional medium frequency signals are visible (period 1.0 - 1.5 hours). These voltage variations stop about one hour after the end of the high seismic activity level. The total effect in the EW-component appears similar to the one of this component during the first eruption, beginning at a certain level followed by a series of up and down movements and finally ending at more or less the same level as before the event.
This time the NS-component shows smaller amplitudes than the EW-component(about half the size compared with the the first eruption). Further the component does not mark an increase of the measured voltage during the first part of the eruption but stays at a relatively low level, however, showing medium period voltage changes (period about 1 hour). Only at relatively late time during the eruption a sudden rise in voltage occurs. At the end of the high seismic activity level the voltage begins to decay to lowvalues for about five hours down to a level similar to the one at the beginning of the ash fall.
RESULTS
SP-data from a period of almost one month is shown. During this time only two data intervals have been recorded which show in a very obvious way the influence of the volcanic activity. During several years of measurements at the Galeras such effects never have been observed on the quiet volcano. These anomalies show very strong amplitudes up to 500 μV/m (compared with about 100 μV/m without such effects). They are strongly correlated with the level of seismic activity. They start at the same time, however end with a certain delay to the seismic signals. The behavior of the SP-signals can possibly be explained by the movements of liquids during the emission. One indication of this is that the shorter SP-variations are associated with the high seismic activity levels. The delay of the SP-signals beyond the end of the seismic activity level could be due to the time delay until the movements of liquids has settled after the last transportation of water or vapor to the surface.
The differences in the SP-signals between the two ash fall emissions are probably due to the different seismic activity levels which we can seen in the seismic data.
At the moment we have very little information on the course of the eruptions and its correlation with the seismic activity. An interesting feature is the different behaviour of both SP-components. This couldbe caused by the direction of the two components of the SP-measurements in relation to the inclination of the walls of the cone through which the eruption rises and which influences the flow of water during and after the eruption. While the NS-component is more or less in the direction of the inclined cone wall at its lower end, the EW-component runs more or less perpendicular to this geological feature. And therefore the movements of liquids come to a stop after the last emission of liquids earlier.
DISCUSSION AND CONCLUSIONS
It is too early to draw final conclusions from the data we have seen. Firstly the evaluation of the seismic and SP-data has not reached its final stage, secondly the correlation between the course of the eruptions and the seismic activity and the SP-signals is not too well known. Further research in this field is necessary. However, at first sight it seems that the SP-signals could contribute to a better representation of the course of an eruption in the measured data than the seismic activity data alone. Aims of our further investigation will be the search for strong correlations between the volcanic activity and the changes of the SP-signals as they are demonstrated in the literature e.g. Byrdina et al. 2003.
REFERENCES
1. BYRDINA, S.,FRIEDEL, S., WASSERMANN, J., ZLOTNICKI, .J, 2003. Self-potential variations associated with ultra-long-period seismic signals at Merapi volcano. Geophysical Research Letters, vol. 30, no.22 [ Links ]
2. ZLOTNICKI, J., LE MOUEL, J.L., SASAI, Y., YVETOT, P., ARDISSON, M. H.; 2001. Self-potential changes associated with volcanic activity. Short-term signals associated with March 9, 1998 eruption on La Fournaise volcano (Réunion Island). Annali di Geofisica, vol. 44, no. 2., April 2001. [ Links ]
3. SEIDL, D., HELLWEG, M., CALVACHE, M., GOMEZ, D., ORTEGA, A., TORRES, R., BÖKER, F., BUTTKUS, B., FABER, E., GREINWALD, S.; 2003. The multi-parameter station at Galeras Volcano ( Colombia ): concept and realization. Journal of Volcanology and Geothermal Research 125, is. 1-2. [ Links ]
4. YOSHINO, T. and TOMIZAWA, I., 1989: Observation of low-frequency electromagnetic emissions as precursors to the volcanic eruption at Mt. Mihara during November, 1986. Physics of the Earth and planetary interiors, vol. 57, nos 1-2. [ Links ]

