


Services on Demand
Journal
Article
 English (pdf)
 Article in xml format
 Article references
 Send this article by e-mail
Indicators
-
 Cited by SciELO
 -
 Access statistics
Related links
-
 Cited by Google
 -
 Similars in
SciELO
Similars in
SciELO -
 Similars in Google
Share

 Permalink
Earth Sciences Research Journal
Print version ISSN 1794-6190
Earth Sci. Res. J. vol.12 no.1 Bogotá Jan./June 2008
DENOISING RESISTIVITY PHOSPHATE "DISTURBANCES" USING HAAR MOTHER WAVELET TRANSFORM (SIDI CHENNANE, MOROCCO)
Saad Bakkali1 and Mahacine Amrani2
1Earth Sciences Department Geosciences & Environment Group
Faculty of Sciences and Techniques, Abdelmalek Essaadi University, Tangier, Morocco
saad.bakkali@menara.ma
2Engineering Process Department
Faculty of Sciences and Techniques, Abdelmalek Essaadi University, Tangier, Morocco
amrani.mahacine@menara.ma
Abstract
Wavelet transforms originated in geophysics in the early 1980s for the analysis of seismic signals. Since then, significant mathematical advances in wavelet theory have enabled a suite of applications in diverse fields. In geophysics, the power of wavelets for analysis of non stationary processes that contain multiscale features, detection of singularities, analysis of transient phenomena, fractal and multifractal processes, and signal compression is now being exploited for the study of several processes including resistivity surveys. The present paper deals with denoising Moroccan phosphate "disturbances" resistivity data? map using the Haar wavelet mother transform method. The results show a significant suppression of noise and a very good smoothing and recovery of resistivity anomalies.
Key words: resistivity, phosphate, disturbance, Haar, wavelet, Sidi Chennane, Morocco.
Resumen
La transformada Wavelet tuvo sus orÃgenes a inicios de los 80âs en el análisis de señales sÃsmicas, que debido a avances matemáticos significativos han permitido su aplicación a diversos campos. La energÃa de la ondÃcula; usada en el análisis de procesos no estacionarios con rasgos de múltiples escalas, detecciones de singularidades, análisis de fenómenos transientes, procesos fractales y multifractales, y compresión de señales, es aplicada a diferentes procesos incluyendo sondeos de resistividad. Este artÃculo muestra la atenuación del ruido en el mapa de perturbaciones de resistividad en los Fosfatos MarroquÃes mediante el uso de la ondÃcula Haar en la transformada Wavelet. Los resultados indican una atenuación significativa del ruido, un buen suavizado y recuperación de las anomalÃas de resistividad.
Palabras clave: Resistividad, fosfato, perturbaciones, Haar, ondÃcula, Sidi Chennane, Marrueco.
Introduction
Geophysical Data are often contaminated with noise and artifacts coming from various sources. The presence of noise in data distorts the characteristics of the geophysical signal resulting in poor quality of any subsequent processing. Consequently the first step in any processing of such geophysical data is the "cleaning up" of the noise in a way that preserves the signal sharp variations. Wavelet transforms are relatively recent developments that have fascinated the scientific, engineering, and mathematics community with their versatile applicability. For geophysical processes, in particular, tools that offer the ability to examine the variability of a process at different scales are especially important. Wavelet analysis is an emerging field of applied mathematics that has provided new tools and algorithms for solving such problems as are encountered in fault diagnosis, modelling, identification, and control and optimization (Kumar et al., 1994). The theory has acquired the status of a unifying theory underlying many of the methods used in physics and signal processing. The decision as to which representation (expansion) to use for a signal, for example wavelet expansion versus Fourier or spline expansion depends on the purpose of the analysis.Wavelets have become increasingly popular for analyzing data in the geosciences. Wavelets re-express data collected over a time span or spatial region such that variations over temporal/spatial scales are summarized in wavelet coefficients. Individual coefficients depend upon both a scale and a temporal/spatial location, so wavelets are ideal for analyzing geo-systems with interacting scales (Riedi, 1998). So, the wavelet transform filtering method has become a powerful signal and image processing tool which has found applications in many scientific areas. This method is a widely used technique that is applicable to the filtering geophysical data (Kumar et al., 1997).
The present paper deals with denoising Moroccan phosphate "disturbances" resistivity data map using the Haar mother wavelet transform method. (include Reference) The results show a high significant suppression of the noise and a very good smoothing and recovery of the resistivity anomalies signal. So the Haar wavelet mother transform processing is thought to be a good method to geophysical anomaly filtering and optimizing estimation of phosphate reserves.
The geophysical context
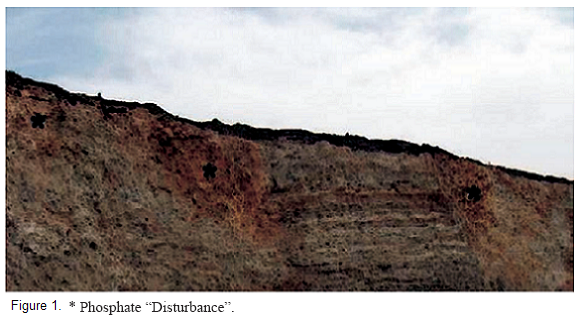
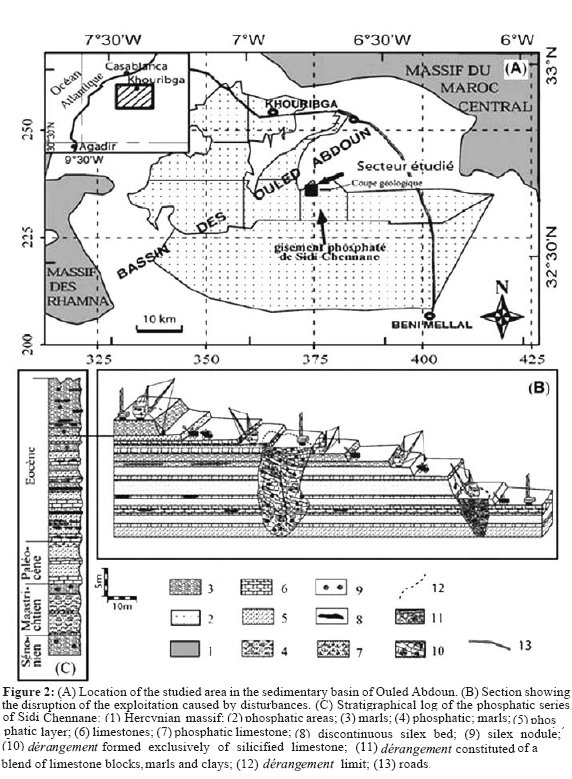
Resistivity is an excellent parameter and marker for distinguishing between different types and degree of alteration of rocks. Resistivity surveys have long been successfully used by geophysicists and engineering geologists and the procedures are well established. (include Reference) The study area is the Oulad Abdoun phosphate basin which contain the Sidi Chennane deposit. The Sidi Chennane deposit is sedimentary and contains several distinct phosphate- bearing layers. These layers are found in contact with alternating layers of calcareous and argillaceous hardpan. However, the new deposit contains many inclusions or lenses of extremely tough hardpan locally known as "derangements" or "disturbances" (figure 1), found throughout the phosphate-bearing sequence (Kchikach et al., 2002). The hardpan pockets are normally detected only at the time of drilling. Direct exploration methods such as well logging or surface geology are not particularly effective They interfere with field operations and introduce a severe bias in the estimates of phosphate reserves (figure 2).
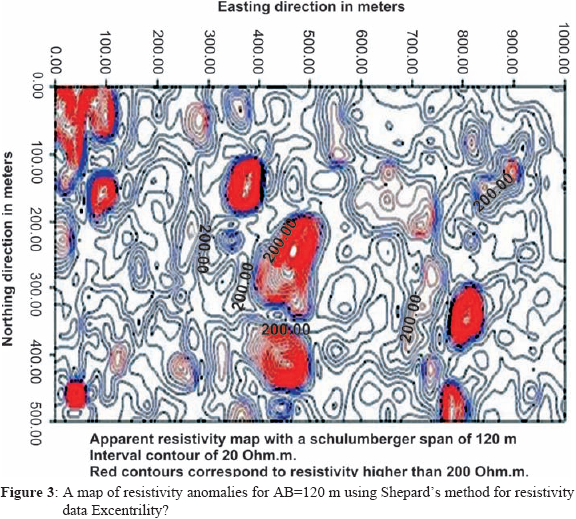
The study area was selected for its representativity and the resistivity profiles were designed to contain both disturbed and enriched areas. The sections were calibrated by using vertical electrical soundings. High values of apparent resistivity were encountered due to the presence of near-vertical faulting between areas of contrasting resistivity, and fault zones which may contain more or less highly conducting fault gouge. The gouge may contain gravel pockets or alluvial material in a clay matrix. Such anomalous sections are also classified as disturbances. Apparent resistivity values in these profiles locally exceeded 200 Ω?m. (Bakkali, 2005; Bakkali et al., 2006).
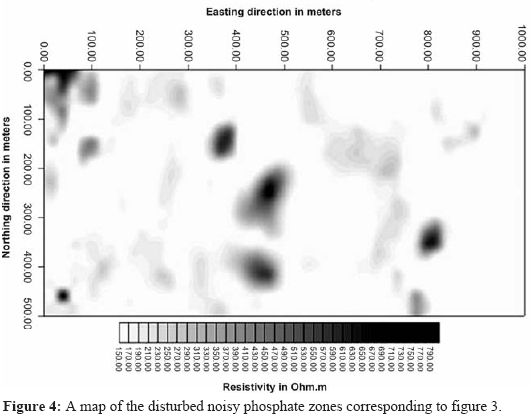
The apparent resistivity map (figure 3) obtained from a further survey was considered in fact a map of discrete potentials on the free surface, and any major singularity in the apparent resistivities due to the presence of a perturbation will be due to the crossing from a "normal" into a "perturbed" area or vice versa. In other words, the apparent resistivity map may be considered a map of scalar potential differences assumed to be harmonic everywhere except over the perturbed areas. Interpretation of resistivity anomalies is the process of extracting information on the position and composition of a targetmineral body in the ground. In the present case the targets were the inclusions called perturbations. The amplitude of an anomaly may be assumed to be proportional to the volume of a target body and to the resistivity contrast with the mother lode. If the body has the same resistivity as the mother lode no anomaly will be detected. Thus assumed in fact and in first approach that the resistivity anomalies would be representative of the local density contrast between the disturbances and the mother lode. Level disturbance of the anomalous zones is proportionnal to resistivity intensity (figure 4). (Bakkali, 2005; Bakkali, 2006). 2006 (1)? 2006 (2)?
The wavelet analysis approach
The wavelet transform is a time-frequency decomposition which links a time (or space) domain function to its time-scale wavelet domain representation. The concept of scale is broadly related to frequency. Small scales relate to short duration, high frequency features and correspondingly, large scales relate to long duration, low frequency features (Daubechies, 1990). Wavelets are functions that satisfy certain mathematical requirements and are used in representing data or other function. In the signal analysis framework, the wavelet transform of the time (orThe apparent resistivity map (figure 3) obtained from a further survey was considered in fact a map of discrete potentials on the free surface, and any major singularity in the apparent resistivities due to the presence of a perturbation will be due to the crossing from a "normal" into a "perturbed" area or vice versa. In other words, the apparent resistivity map may be considered a map of scalar potential differences assumed to be harmonic everywhere except over the perturbed areas. Interpretation of resistivity anomalies is the process of extracting information on the position and composition of a targetmineral body in the ground. In the present case the targets were the inclusions called perturbations. The amplitude of an anomaly may be assumed to be proportional to the volume of a target body and to the resistivity contrast with the mother lode. If the body has the same resistivity as the mother lode no anomaly will be detected. Thus assumed in fact and in first approach that the resistivity anomalies would be representative of the local density contrast between the disturbances and the mother lode. Level disturbance of the anomalous zones is proportionnal to resistivity intensity (figure 4). (Bakkali, 2005; Bakkali, 2006). 2006 (1)? 2006 (2)? The wavelet analysis approach The wavelet transform is a time-frequency decomposition which links a time (or space) domain function to its time-scale wavelet domain representation. The concept of scale is broadly related to frequency. Small scales relate to short duration, high frequency features and correspondingly, large scales relate to long duration, low frequency features (Daubechies, 1990). Wavelets are functions that satisfy certain mathematical requirements and are used in representing data or other function. In the signal analysis framework, the wavelet transform of the time (or space) varying signal depends on the scale that is related to frequency and time (or space) (Daubechies et al., 1992). The 2D wavelet method provides information on many more resolution than the former method. It is a powerful tool particularly suitable in denoising, filtering and analyzing problems and potential singularities in geophysical context (Foufoula-Geogiou et al., 1994) (Grossmann et al., 1989). Moreover this property is crucial for performing an efficient denoising resistivity anomaly map of the Moroccan phosphate deposit "disturbances".
Theorical review
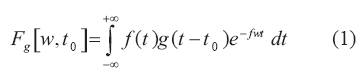
Traditionally, Fourier transform has been used to process stationary signals acquired by computers. In this way, the representative spectrum of frequencies is obtained from the time series produced during ac-quisition of the signal by the computer. For non stationary signals, typical of engineering processes, the existing methodologies have not been fully developed. Windowed Fourier transform, also called short-tine? Fourier Transform, was first applied using a Gaussian type window (Walker, 1997). For a given signal f(t), a conventionaly defined signal g(t â t0) is applied to a window of time that moves along with the original signal, forming a new family of functions: fg(t0,t) = f(t)g(t â t0). Functions formed this way are centred on and have a duration defined by the characteristic time window of the function g(t). Windowed Fourier transform is thus defined as:
This transform is calculated for all t0 values and it gives a representation of the signal f(t) in the time frequency domain. If a space function f(x) instead of a time signal, is considered, a representation is given in the space- frequency domain (Meyer, 1993). However as a windowed Fourier transform represents a signal by the sum of it sine and cosine functions, it restricts the flexibility of the function g(t â t0) or g(x â x0) making a characterization of a signal and simultaneous location of its high frequency and low frequency components difficult in the time-frequency domain or the space-frequency domain.Wavelets transform were developed to overcome this deficiency of windowed Fourier Transform in representing non-stationary signals. Wavelets transform is obtained from a signal by dilatation-contraction and by the translation of a special wavelet within the time or space domain. The expansion of this signal into wavelets thus permits the signalâs local transient behaviour to be captured, while the sine and the cosines can only capture the overall behaviour of the signal as they always oscillate indefinitely (Walker, 1997).
Signal analysis and the Haar wavelet mother
In the Fourier analysis, every periodic function having a period of 2 and an integrable square is generated by an overlay of exponential complexes,Wn(x) = ejnx, n = 9, ± 1, ± 2, Ψobtained by dilations of the function W(x) = ejx : Wn(x) = W(nx). Extending the idea to space for Ψ integrable square functions, the following is defined :
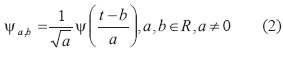
The function Ψ is called a mother wavelet, where a is the scale factor and b is the translation parameter. The family of simpler wavelets, which will be adopted in the present work, is that the Haar wavelet :
For the one-dimensional no stationary function f(x) that decrease to zero when x→ , the following assumption is normally adopted :
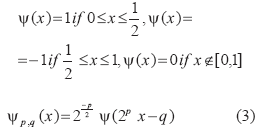
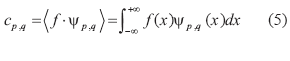
The scale factor of 2-pq is called the localization or dyatic translation and k is the translation index associated with the localization, where p and q-p → (Meyer, 1982) proved that wavelet thus defined are orthogonal, i.e., ‹Ψp,q•Ψl,m=δp,lδq,m for p,q,lm∈Z where ‹•› is equal to the scalar product and δ refer to the delta function of Dirac. Thus the function f(x) can be rewritten as follows :
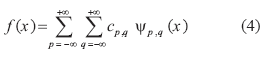
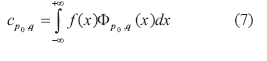
The values of the constant cp,q are obtained by wavelet transform in its discrete form. Then is expanded into a series of wavelets with their coefficients obtained from
The wavelet transform can also be calculated using special filters called Quadrature Mirror filters (Mallat, 1989). They are defined as a low-pass filter, associated with the coarser scale, and a high-pass filter to characterize the details of the signal. The signal f(x) then is described as:
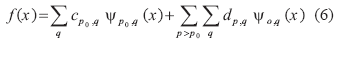
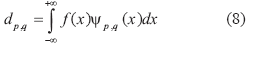
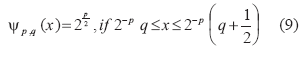
In the expansion of f(x) by equation 6, the first term represents the approximation of the signal and the second the signal details, filtered by the approximation. The function Φp0,q(x) is denominated a scale function or father wavelet, and it is responsible for obtaining the approximation of the signal, while the mother wavelets, Ψp,q are responsible for the generation of the details filtered by the approximation (Polikar, 1999) (Wickerhauser, 1994). For the family of Haar wavelets, the scale function is Φop,q (x)=0ifx∈[0,1]. The mother wavelets, responsible for the details in the Haar family, are expressed as:
The processing data
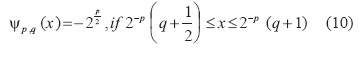
The resistivity data base is a compilation of 51 traverses at a spacing of 20 m. There were 101 stations at 5 m distance for every traverse, which makes 5151 stations all together in the resistivity survey. We choose the Haar wavelet basis for its smoothness and compact support (Torrence et al., 1998). We calculated the magnitude square of the Haar wavelet transform coefficients (Rioul et al., 1991) using Origin Pro 8 routine (Origin Pro, 2007) for each resistivity traverse (figure 5). Then we deferred all the results to built a 2D wavelet spectrum regular maps which represent in fact filtering and denoising map of the phosphate deposit "disturbances". Since a major potential application of wavelets is in image processing, the 2D wavelet transform is a necessity to be applied as a detector and analyser of singularities like edges, contours or corners (Ucan et al., 2000). (Tsivouraki- Papafotiou et al., 2005).
Results & conclusions
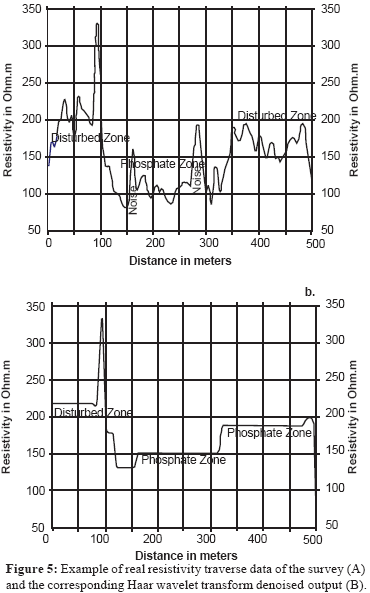
Figure 6 represents an indicator of the level of variation of the contrast of density between the disturbances and the normal phosphate-bearing rock. The surface modeling of resistivity anomalies is obtained by AutoSignal routine from our apparent resistivity survey transformed data obtained using the Haar wavelet mother response. These procedure enables us to define the surface phosphate disturbed zones. The Haar wavelet analysis surface of phosphate deposit disturbance zones modeling as obtained by the above procedure in the study area provided a direct image for an interpretation of the resistivity survey. These method enable us to identify the anomalies area which turned out to be bly correlated with the disturbances. The use of magnitude square of the Haar mother wavelet transform represent an effective filtering method which makes it possible to attenuate considerably the noise represented by the minor dispersed and random disturbances. The overall effect is that of scanning and denoising the anomalous bodies. Comparatively to classical approaches used in filtering and denoising the same geophysical data map (Bakkali, 2007), the advantage of the Haar wavelet transform method is doesnât introduce significant distorsion to the shape of the original resistivity signal .
The Haar wavelet output of the apparent resistivity which correspond to the wavelet output of the anomalous phoshate deposit map obtained from such a technical tool represent the crossing dominate area from a "normal" into a "perturbed" area or vice versa. Moreover the level of disturbance is very clearly shown. The proposed filtering and denoising method using Haar wavelet transform tends to give a real estimation of the surface of the phosphate deposit "disturbances" zones with a significant suppression of the noise. The level disturbance resulting from such method is also more defined in all the disturbed zones.
We have described an analytical procedure to analyze the anomalies of a specific problem in the phosphate mining industry. The results proved satisfying. Data processing procedures as the Haar wavelet mother response transform of resistivity data map was found to be consistently useful and the corresponding map may be used as auxiliary tools for decision making under field conditions.
References
1. Bakkali, S., (2005). Analysis of phosphate deposit "disturbances" using the horizontal-gradient responses of resistivity data (Oulad Abdoun, Morocco), Earth Sci. Res. J. Vol.9, N°2, p123-131. [ Links ]
2. Bakkali, S., (2006). A resistivity survey of phosphate deposits containing hardpan pockets in Oulad Abdoun, Morocco, Geofisica Internacional, 45 (1), p73-82. [ Links ]
3. Bakkali, S. and L. Bahi., (2006). Cartographie des «dérangements» de séries phosphatées par mesures de résistivités électriques, Journal des Sciences Pour lâIngénieur, J.S.P.I., 6, p1-10. [ Links ]
4. Bakkali, S., (2007). Enhancement of edges of Sidi Chennane phosphate "disturbances" using sunshading responses of resistivity data, Russian Geology andGeophysics, RGG, 48 (9), 775â781. [ Links ]
5. Daubechies, I., (1992). Ten Lectures on Wavelets, 357 pp., Soc. for Ind. and Appl. Math., Philadelphia, Pa. [ Links ]
6. Daubechies, I., Mallat, S. and A. S. Willsky., (1992). Introduction to the special issue on wavelet transforms and multiresolution signal analysis, IEEE Trans. Inf. Theory, 38(2), 529â531. [ Links ]
7. Daubechies, I., (1990). The wavelet transform, time-frequency localization and signal analysis, IEEE Trans. Inf. Theory, 36(5), 961â1005. [ Links ]
8. Foufoula-Georgiou, E., and P. Kumar., (1994). Wavelets in Geophysics, Academic, San Diego, Calif., 384 pp. [ Links ]
9. Grossmann, A., Kronland-Martinet, R. and J. Morlet., (1989). Reading and understanding continuous wavelet transforms, in Wavelets: Time-Frequency Methods and Phase Space, edited by J. Combes, A. Grossmann and P. Tchamitchian, 2â20, Springer-Verlag, New York. [ Links ]
10. Kchikach, A., Jaffal,M., Aifa, T. and L. Bahi., (2002): Cartographie de corps stériles sous couverture quaternaire parméthode de résistivités électriques dans le gisement phosphaté de Sidi Chennane (Maroc). Comptes Rendus. Geosciences, 334, 379-386. [ Links ]
11. Kumar, P., and E. Foufoula-Georgiou., (1994). Wavelet analysis in geophysics: An introduction, in Wavelets in Geophysics, edited by E. Foufoula-Georgiou and P. Kumar, Academic, San Diego, Calif. 1â43. [ Links ]
12. Kumar, P. and E. Foufoula-Georgiou., (1997). Wavelet analysis for geophysical applications, AGU, Reviews of Geophysics, 35, 4, 385â412. [ Links ]
13. Mallat, M., (1989). A theory for multiresolution signal decomposition; the wavelet representation, IEEE Trans. on PAMI, 11(7), 674-693. [ Links ]
14. Meyer, Y., (1992). Wavelets and Operators, Cambridge Univ. Press, New York. [ Links ]
15. Meyer, Y., (1993). Review of An Introduction to Wavelets by C. K. Chui and Ten Lectures on Wavelets by I. Daubechies, Bull. Am. Math. Soc., 28(2), 350â360. [ Links ]
16. Origin Pro 8 (2007). About Origin Pro 8 SRO,V8.0724 software, Copyright 1991-2007, Origin Lab Corporation, www.originlab.com. [ Links ]
17. Polikar, P., (1999). The Engineerâs Ultimate Guide to Wavelet Analysis , The Wavelet Tutorial, http://engineering.rowan.edu/~polikar. [ Links ]
18. Riedi, R.H., (1998). Multifractals and Wavelets: A potential tool in Geophysics, SEG meeting 1998, Technical Session on Novel Transforms, New Orleans, LA, September 1998. [ Links ]
19. Rioul, O., and M. Vetterli., (1991). Wavelets and signal processing, IEEE Signal Process. Mag, 8(4), 14â38. [ Links ]
20. Systat (2002). About AutoSignal V1.6 software, Copyrignt 2002 AISN Software Inc. [ Links ]
21. Torrence, Ch. and G.P. Compo., (1998). A practical guide to wavelet analysis, Bull. Am. Meteorol. Soc., 79, 61-78. [ Links ]
22. Tsivouraki-Papafotiou, B., Tsokas, G.N. and P. Tsurlos. (2005). Wavelet denoising of magnetic prospecting data, Journal. Balkan Geophysical Society, Vol 8, 2, 28-36. [ Links ]
23. Ucan, O.N., Seker, S., Abora A.M and A. Ozmen, A., (2000). Separation of magnetic fields in geophysical studies using a 2-D multiresolution wavelet analysis approach. Journal. Balkan Geophysical Society, Vol 3, 3, 53-58. [ Links ]
24. Walker, J.S., (1997). Fourier Analysis and Wavelet Analysis, Notices of the AMS, Vol 44, 6, 658-670. [ Links ]
25. Wickerhauser, M. V., (1994). Adapted Wavelet Analysis From Theory to Software, 486 pp. [ Links ]

