


Servicios Personalizados
Revista
Articulo
 Inglés (pdf)
 Articulo en XML
 Referencias del artículo
 Enviar articulo por email
Indicadores
-
 Citado por SciELO
 -
 Accesos
Links relacionados
-
 Citado por Google
 -
 Similares en
SciELO
Similares en
SciELO -
 Similares en Google
Compartir

 Permalink
Earth Sciences Research Journal
versión impresa ISSN 1794-6190
Earth Sci. Res. J. v.12 n.1 Bogotá ene./jun. 2008
SEISMIC VELOCITY DETERMINATION IN GRAVEL AND SANDS USING PIEZOCRYSTALS
Armando Luis Imhof1 and Juan Carlos Santamarina2
1 Instituto Geofísico Sismológico Volponi / Facultad de Ciencias Exactas Físicas y Naturales.
Ignacio de la Roza y Meglioli. Rivadavia. C.P. 5400, San Juan, República Argentina.
Fax: (54)264 4234980. Tel.: 54 264 4945015. E-mail: aimhof@unsj.edu.ar.
2 Center for Applied Geomaterials Research. Atlanta, Georgia. USA. http://geosystems.gatech.edu
Postal Address: Instituto Geofísico Sismológico Volponi / Ruta 12, km. 17. C.P. 5413
Rivadavia - San Juan - Argentina
Abstract
The exact determination of seismic waves' propagation velocities has great importance in the geotechnics due to from that it is possible to determine, among other parameters, the dynamic ones: Elasticity E, Rigidity G, Poisson v, compressibility B; as well as to reach a knowledge on the stress-strain behavior for the studied soil samples. The seismic waves transmission considered in tests at laboratory scale carried out in the present work is a phenomenon that produces very small deformation, and so doesn't disturb the material. This allows to apply the results in a more general scale to study the behavior of soils in situ and to predict their answer to stress.
With the purpose to study the response of particulate material subjected to seismic excitements at small scale, samples of gravels and sands were successively introduced in an odometric cell, exciting them with impulsive signals and registering the corresponding seismograms through general purpose piezoelectric transducers embedded in ends of the cell.
The distance source-receiver was interval increased, which enabled, from the corresponding regression straight lines, to calculate in precise form the propagation velocities (for P waves).
The tests were carried out in samples of dry alluvial soil with three different grain sizes. The respective frequency spectra of the signals were determined for two packing modes: loose and compact, what added information on the medium characteristics.
The results showed that general purpose piezocrystals can be adapted for design and construction of a complete low cost acquisition system that brings great resolution in time, facilitating as consequence very precise calculations of the transmission velocities that take in a later stage to reliable determination of dynamic parameters of the soil.
keywords: piezocrystals, seismic waves, compressional waves, signal processing.
Resumen
La determinación precisa de velocidades de propagación de ondas sísmicas reviste gran importancia en la geotecnia debido que a partir de las mismas es posible determinar, entre otros parámetros, los dinámicos: Elasticidad E, Rigidez G, Poisson ν, compresibilidad B; así como alcanzar un conocimiento sobre el comportamiento tenso-deformacional de las muestras de suelo estudiadas. La propagación de las ondas sísmicas considerada en los ensayos de laboratorio llevados a cabo en el presente trabajo es un fenómeno que produce ínfima deformación, por lo que no disturba el material. Ello permite aplicar los resultados en una escala más general para estudiar el comportamiento de los suelos in situ y predecir su respuesta a esfuerzos.
Con el propósito de estudiar la respuesta de materiales particulados sometidos a excitaciones sísmicas a pequeña escala, se introdujeron sucesivamente muestras de gravas y arenas en una celda odométrica, excitándolas luego con señales impulsivas y registrándose los correspondientes sismogramas a través de transductores piezoeléctricos de uso general adosados en extremos de la celda.
Si incrementó por intervalos la distancia emisor-receptor lo que posibilitó, a partir del trazado de las rectas de regresión correspondientes, calcular en forma precisa las velocidades de propagación (ondas P).
Los ensayos se llevaron a cabo en muestras de suelo aluvional seco con tres tipos diferentes de granulometría. Se determinaron los respectivos espectros de frecuencia de las señales para dos estados de compactación considerados, lo que permitió aportar información sobre las características del medio en estado suelto y compacto.
Los resultados mostraron que los piezocristales de uso general pueden ser adaptados para diseño y construcción de transductores que funcionen tanto como emisores como receptores de ondas y que permitan obtener registros con gran resolución en tiempo, posibilitando como consecuencia de ello cálculos muy precisos de las velocidades de propagación que lleven en una etapa posterior a determinación confiable de parámetros dinámicos del suelo.
palabras clave: ondas sísmicas, piezocristales, ondas compresionalesm, procesamiento de señales.
Introduction
This investigation presents the development and implementation of geophysical techniques based in transmission of elastic waves using low cost instruments developed for these work. The techniques were applied for sand and gravels samples at laboratory scale.
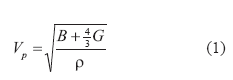
The precise determination of seismic wave velocities has great importance in Civil Engineering because from that it is possible to determine the dynamic modulus (e.g. Rigidity G and compressiblility or Bulk, B). See for example, the following expression (Sheriff, 1994; Sheriff et al, 1995):
which express compressional wave velocity (VP) related to Bulk (B)and rigidity (G)dynamic modules, and density (ρ)of the medium traversed by the wave.
The fact to consider particulate media (i.e. not continuum)adds some level of complexity to equation (1), which transforms in (Lee, 2003):
Where S is the degree of humidity of the soil sample; ρ density, n porosity, Bsk Bw Bg bulk modules for skeleton (solid phase), water and grain respectively, and VP the propagation velocity of P waves.
Seismic waves propagation in these tests is a small deformation phenomenon, so does not disturbs the material involved. Thereforre, it is possible to extrapolate the methodology to field to study gravel and sands behaviour in situ and predict their response to stress at major scale.
The performance of geophysical tests in granular media at laboratory scale, particularly of coarse grain (e.g. alluvial gravels), faces difficulties related to the transducer-medium coupling, to the type of sources, the selection of transducers for the reception, the inherent dispersion (i.e. velocity variation with frequency) and the selective attenuation of frequencies with regard to the size of the particles, among others.
Test assembly
Main Characteristics of Emission-Reception Transducers
General purpose piezocrystals (disk cell type; APCI, 2000)of 20mm of diameter were used as sources and receivers of seismic waves, Figure 1(a). Their reversible characteristic allows them to work converting electric energy in mechanical and vice versa so they can be implemented as emitters and receivers. An electric impulse makes vibrate the crystal mainly to its resonance frequency (Wells, 1977), which is inversely proportional to the thickness of the piezoelectric material (being approximately a half of the wavelength, λ/2). Besides, the bandwidth of the registered signal also possesses an inverse relationship with the duration of the excitement (Lee, 2003).
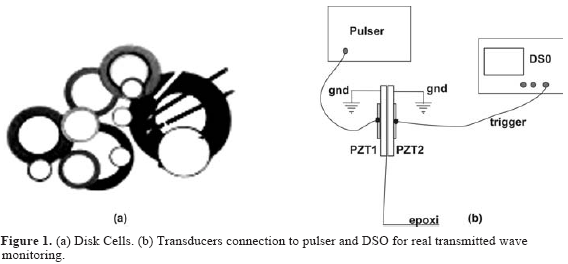
The signal created by the signal generator (pulser)is not identical to that verily emitted by the transducer (that is a mechanical one), since it also depends on the proper characteristics of the medium. Therefore it is important to carry out a monitoring of the real transmitted waveform. With that purpose it was implemented the system represented in Figure 1 (b). The true signal emitted by the piezocrystal (PZT1 for brevity)is monitored by the digital storage oscil-loscope (DSO)by means of other piezoelectric (PZT2), stuck to it.
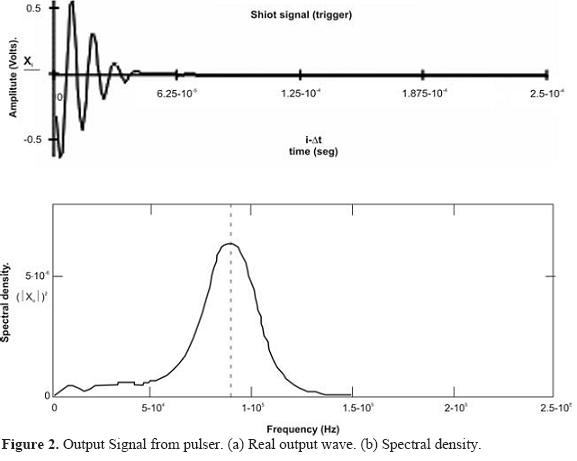
Figure 2 presents on one hand the real form of the output pulse; and for other the frequency content of it. It'll be studied what happens to the last as the waves transverse the medium under study.
System Assembly
Figure 3 shows the cylindrical steel cell where the samples were introduced, and the outline of system connection is visualized.
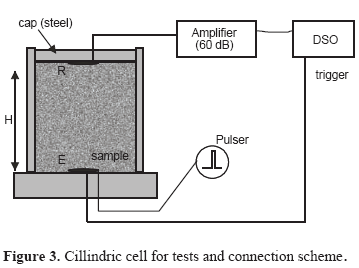
As signal generator a pulser was built, which generated impulsive excitements of short duration (10 μ s)in periodic form (each 10 ms)and with high amplitudes (range 40 - 400V).
Connected to the PZT receiver, an operational amplifier FET TL084 was used of up to 80 dB gain, fed with 12 VCC, with 100Hz highpass filter.
As seismograph, a 60MHz digital real time oscilloscope TEKTRONIX TDS 210 of two channels and one additional for external trigger was used, with sampling rate up to 1 GSample/sec.
The instrument possess an RS232 interface. A BASIC algorithm was designed and implemented to transfer data to PC, for later signal processing.
As wave emitters E and receivers R, general purpose piezoelectric ceramics of 4.1kHz of resonance frequency transducers were used,
Direct Arrivals
To be able to calculate the transmission velocities, it is necessary the determination of the first arrivals accurately (direct waves). Therefore in confinedmedia it is essential to know the types of possible arrivals in order to eliminate the undue ones (i.e. the no-direct ones).
Imhof (2007)studied several types of wave propagation inside cylindrical test steel probes: direct, refracted, reflected and transmitted through the walls of the cell, verifying that: (a)The waves transmitted by the steel walls will arrive much faster that the other ones, due to the high propagation velocity there (Vsteel = 6000m/s; Santamarina et al, 2001); (b) For distancesH>0.13m and diameters Φ = 0.125m the wall refracted waves will reach R before the other types in all the cases ; (c)Although the wall reflected waves don't arrive before the direct ones in any case, however as H increases the arrival times for both will approach to each other. This will imply interference in the complete registration of the signal.
Studying the directivity of this type of transducers, Imhof (2007)demonstrated that, for distances H greater than 0.13m (Figure 3)the wall refractions were not detected due to the fact that the critical angles were inside the area of crystal directivity shade, which attenuated them almost in 70-80%.
At last, to avoid detection of waves that spread through the cell walls, so the base as the cover were isolated with rubber o-rings, that produced uncoupling of waves.
Methodology
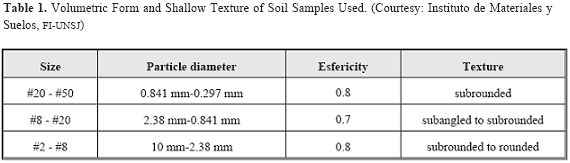
Tests were carried out using dry samples of sands (S) and gravels (G)(SP and GP related to Unified Soil Classification System, USCS, by American Society of Testing Materials, ASTM)with three different sizes (#20 - #50; #8 - #20 and #2 - #8, ASTM)and two packing modes: Loose (A)and dense (C). Table 1 summarizes sample characteristics which brought to six complete tests. At first velocities were determined, starting from a sample of sand (SP)with grain sizes among 0.297mm (#50)and 0.841mm (#20), repeating the determinations later for the other ones.
The sample was introduced in the test cell (Figure 3)until reaching the distance H = 70 mm. In the base a couple of PZT (source E, PZT1 and trigger to channel 1, DSO, PZT2)was mounted, covering then the material with a steel cap with the receiving, R transducer stuck in its central part with an epoxi elastic mastic, and connected to channel 2, DSO through the amplification system. After obtaining the first record the cap was removed and more sample material was added, until the next distance H, repeating the acquisition. In total there were six recordings for each sample and packing mode, for distances H=70, 90, 110, 130, 150, and 170mm.
All the records were transmitted to PC through RS232 interface. The signal to noise (S/R)relationship was improved using stacking with the purpose to cancel or minimize the noises randomly and so enhancing the incoming signal. The number of stacks commonly used was 128, but on occasions, mainly for the #2-#8 samples, reached 1024.
The sample was placed in two successive packing forms: Loose A, poured with tablespoon taking care that the grains remained with the greatest volume of holes; and dense C compressing it in mechanical form in order to minimize the poral space without breaking the grains.
Results
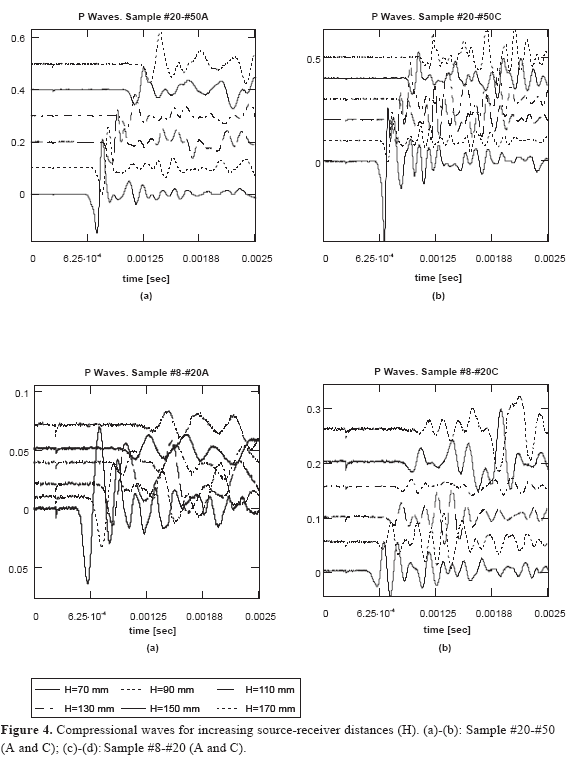
The signals quality diminishes as the size of the particles grows, (e.g. Figure 4(a)vs Figure 4(c)). Particularly it was not necessary to perform stacking to get the records for Figure 4 (a)-(b), while the number of stacks to obtain the records shown in Figures 4 (c)-(d)were of 128. Finally to get legible records for sample #2-#8 (not shown)the number of stcaks ascended to 1024. The explanation of this phenomenon will be elucidated later when analyzing the frequency spectra for every signal.
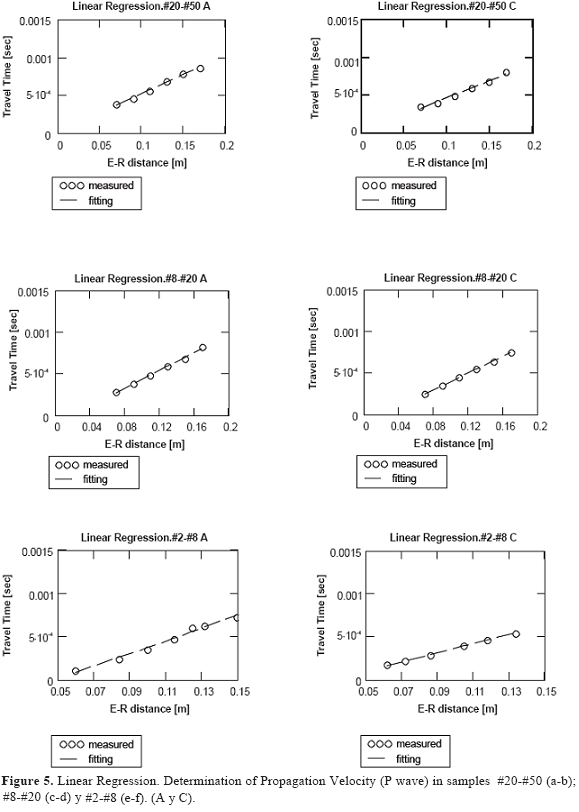
After the first arrivals' picking for all signals, distance and time data were recorded in matrix form. Linear regression was calculated for each one of them and then represented graphically together with corresponding travel times versus H distances (Figure 5). The inverse of regression line slope constitutes the propagation velocity.
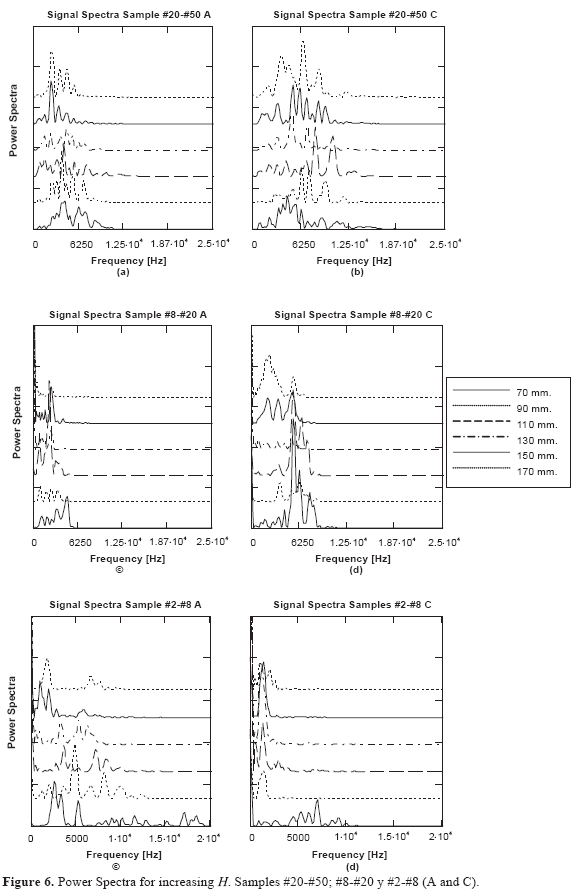
Applying Fast Fourier Transform (FFT), the power spectra were evaluated for each one of the registered signals and represented in Figure 6.
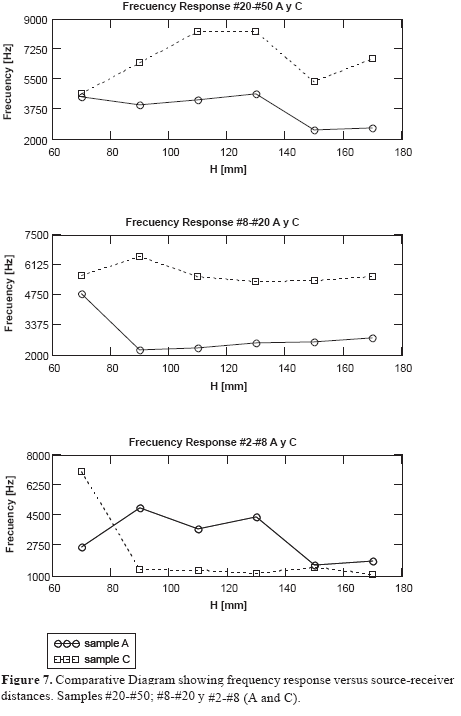
Finally, Figure 7 shows the frequency content variation with distance H for the different cases under study.
Discussion
Compressional Wave Propagation
The quality of the signals got worse as particle size increased. On one hand the fact to augment the particle size decremented teh contact area between the sample and the tyranbsducer (i.e. transducer-sample coupling). On the other the typical wavelength calculated for the samples (see below Power Spectra of Signals)approaches to particles size, appearing the diffraction phenomenon (Potts & Santamarina, 1993). This turned critic in the case of sample #2-#8.
In general it was observed that the measured travel times presented minimum dispersion, being adjusted very well to a straight line, because the material is considered homogeneous and isotropic (at laboratory small scale).
The propagation velocities in all cases are lower than those of wave in air: 343 m/s to 20 ºC, 1atm (Carmichael, 1982,1989; Weast, 1988; Guéguen & Palciauskas, 1994), fluctuating in the range 150 - 215 m/s.
It was verified that the propagation velocities in loose media are always lower than those in compacted samples. This appears as a logical result because the material with smaller volume of holes presents a more similar behavior to the solid (rock), that possesses greater propagation velocity that the wave in the air. The VP also diminishes as
the grain size increases (compare Figure 5 a,c,e).
Regarding sample #2-#8, it is very difficult to detect the first arrivals accurately. The explanation of this phenomenon is analized in the following section.
Power Spectra of Signals.
The frequency content of the signals for the loose state was lower than that for the compact one, probably because the material in the last case resembles more to a continuous medium (compare in Figure 6 the couples: (a)-(b)for sample #20-#50; (c)-(d)for sample #8-#20 and (e)-(f)for sample #2-#8).
The maximum frequency content was obtained for the sample #20-#50 (A and C); being located in the range 4000Hz (A)- 8000Hz (C), decreasing as the particle size increased to the interval 2500Hz (A) - 6000Hz (C)for sample #8-#20 and rounding 2500Hz fot sample #2-#8. Therefore, as the particle size increases, decreases the sample frequency response, being accentuated the filtering of higher ones (low-pass filter).
In the case of the sample #2-#8 a particular phenomenon takes place. According to the spectrum displayed at Figure 6 (c)-(d), the average wave frequency is about f~4000 Hz (H = 0.07m). Considering a velocity of propagation VP~140 m/s:
Also, the maximum amplitude values take place for smaller frequencies asHincreases and therefore λThe grain size for sample #2-#8 is among 2.38mm and 10mm; therefore )rounds into the order of particles size. This implies the beginning of diffraction phenomenon that will hinder the detection of first arrivals due to scattering (Potts et al, 1993; Santamarina et al, 2005).
Figure 7 shows frequency response versus distance H for the samples #20-#50; #8-#20 and #2-#8 A and C, showing that the bandwith is greater in C that in A packing modes. Besides, the frequency content decreases as H increases, logical result due that Earth responds as a low-pass filter to seismic waves.
Only the sample #2-#8 presents irregular behavior, due to the described phenomenon.
Conclusions
General purpose piezocrystals (disk cells)can be adapted for the construction of transducers to generate and detect seismic P waves at laboratory scale using soil samples (gravel and sands), in the range of frequencies that allows an appropriate balance between resolution and penetration.
The propagation velocities calculated for the three samples in loose and compacted media increase in the second case; the typical frequency contents increase too. Compact soil samples filter less the high frequencies than do the loose ones.
The spectrograms amplitude peaks moves toward lower values of frequency as the grain size increases.
Finally, it was proved the efficiency of these type of piezocrystals to perform high resolutive and low cost laboratory experiments.
References
1. American Piezo Com International (2000)Piezoelectric Ceramics: Principles and Applications. APCI. [ Links ]
2. Carmichael, R.S. (1982)Handbook of Physical Properties of Rocks. CRC Press, Boca Raton, 345 pp. also grows. [ Links ]
3. Carmichael, R.S. (1989)CRC Practical Handbook of Physical Properties of Rocks and Minerals. CRC Press, 741 pp. [ Links ]
4. Guéguen, Y. & Palciauskas, V. (1994)Introduction to the Physics of Rocks. Princeton University Press. Princeton; 294 pp. [ Links ]
5. Imhof, A. L. (2007)"Caracterización de Arenas y Gravas con Ondas Elásticas: Tomografía Sísmica en Cross Hole". Ph.D. Thesis. Universidad Nacional de Cuyo. Mendoza Argentina. [ Links ]
6. Lee, J.S. (2003)High Resolution Geophysical Techniques For Small-Scale Soil Model Testing. Ph.D. Thesis. Georgia Institute of Technology. Atlanta. USA. [ Links ]
7. Potts, B.D. & Santamarina, J.C. (1993)Geotechnical Tomography: The effects of Diffraction Geotechnical Testing Journal. 16, nº1, 510-517. [ Links ]
8. Santamarina, J.C. & Fratta, D.. (2005)Discrete Signals and Inverse Problems. An Introduction for Engineers and Scientists. Ed. Wiley & Sons.UK. [ Links ]
9. Santamarina, J.C.; Klein, K.A. & Fam, M.A. (2001) Soils and Waves. Wiley & Sons. Ltd. England. [ Links ]
10. Sheriff, R.E. & Geldard, L.P. (1995)Exploration Seismology. 2nd Edition. Cambridge University Press; NY. 592 pp. [ Links ]
11. Sheriff, R.E. (1994)Encyclopedic Dictionary of Exploration Geophysics. Geophysical Reference Series. Society of Exploration Geophysics (SEG). Tulsa, OK. USA. [ Links ]
12. Weast, R.C. (1988)CRC Handbook of Chemistry and Physics. 1st Student Edition. CRC Press, Boca Raton. [ Links ]
13. Wells, P.N.T. (1977) Biomedical Ultrasonics. Academic Press. New York, 635 pp. [ Links ]

