


Servicios Personalizados
Revista
Articulo
 Articulo en XML
 Referencias del artículo
 Enviar articulo por email
Indicadores
-
 Citado por SciELO
 -
 Accesos
Links relacionados
-
 Citado por Google
 -
 Similares en
SciELO
Similares en
SciELO -
 Similares en Google
Compartir

 Permalink
Earth Sciences Research Journal
versión impresa ISSN 1794-6190
Earth Sci. Res. J. v.12 n.2 Bogotá jul./dic. 2008
DEEP CRUSTAL STRUCTURE AND ESTIMATION OF MOHO
IN THE LHASA TERRANE OF CENTRAL TIBET
Syed Mustafizur Rahman1, Rezaul Islam2, Mumnunul Keramat3 and Md. Sultan-Ul-Islam4
1 Associate Professor, Department of Applied Physics and Electronic Engineering, University of Rajshahi, Rajshahi-6205, Bangladesh.smrahman@ru.ac.bd
2 Associate Professor, Department of Applied Physics and Electronic Engineering, University of Rajshahi, Bangladesh.r_islam@bttb.net.bd
3 Professor, Department of Applied Physics and Electronic Engineering, University of Rajshahi, Bangladesh.m_keramat@email.com
4 Associate Professor, Department of Geology and Mining, University of Rajshahi, Bangladesh. sultan_ul_islam@yahoo.com
ABSTRACT
Seismic attributes analysis is applied to INDEPTH II seismic profiles to develop a better understanding of the deep crustal structure and geodynamics of the Lhasa Terrane in the central Tibet area. Analyses indicate that the frequency anomalies are obtained over the range in between 0-30 Hz. Some area of the analyzed traces of the seismic profiles have shown dominated frequency anomaly approximately 10 Hz with little amount of other frequencies. The variation of frequency anomaly is shown to be the indication of theMoho depth of the area. EstimatedMoho depths are found very irregular and varying from 20 kmto more than 136 km. The crust is thinner in southern, northern and eastern parts of the area while it is thicker in the western part having asymmetric nature in the central part. This variation might be the result of the complicated tectonic process of the Indian and Eurasian plates. Vertically downward pocket like frequency distributions and similar type frequency distributions at near and far depth are also observed in one of the analyzed sections. It might be indication of uprised asthenospheric matter which exchanged with lithosphere in subduction zones related to the multiple crustal uprising.
Key words: Seismic Attributes, Central Tibet, INDEPTH, Moho, Subduction.
RESUMEN
El análisis de atributos sísmicos es aplicado a perfiles sísmicos a través del programa INDEPTH II, que permite un mejor entendimiento de la estructura cortical profunda y la geodinámica de Lhasa Terrane en el área central del Tíbet. Los análisis indican que las anomalías de frecuencia se obtuvieron en el rango de 0-30Hz. En algunas zonas analizadas de los perfiles sísmicos en las trazas han mostrado que la frecuencia anómala predominante es de10 Hz, con poco contenido de otras frecuencias. La variación en la anomalía de frecuencia muestra ser el indicativo de la profundidad del Moho en el área. Profundidades estimadas del Moho son muy irregulares y varían desde 20 kilómetros hasta más de 136 kilómetros. La corteza es más delgada en el Sur, Norte y Este del área, mientras que es más gruesa en el Oeste, con una naturaleza simetría en la parte central. Esta variación podría ser el resultado de los complicados procesos tectónicos de las placas de la India y Eurasia. Concentraciones en la parte baja de la distribución de frecuencias y similar tipo de distribución de frecuencia se observan en las partes someras y profundas, en una de las secciones analizadas. Esto podría indicar el ascenso de material astenosférico que se intercambió con la Litósfera in las zonas de subducción relacionadas al múltiple ascenso de la Corteza.
Palabras clave: Atributos sísmicos, Tibet Central, INDEPTH, Moho, Subducción.
1. Introduction
Tibet is often called the roof of the world, that comprises table-lands averaging over 4,950 m above mean sea level with peaks at 6,000 to 7,500 m, including the Mount Everest. It is bounded on the north and east by China, on the west by the Kashmir region of India and on the south by Nepal, Bangladesh and Bhutan. Most of Tibet sits atop a geological structure known as the Tibetan Plateau which includes the Himalaya and many of the highest mountain peaks in the world. The plateau was formed by the continuous northward movement of Indian Plate as well the collision of it with Eurasian tectonic plates in the Cenozoic period (approximately 55 million years ago). This process is still ongoing. In the process of continental evolution, continent-continent collision substantially affects the earth's structure. The plateau is considered as an optimal place for studying the basic problems of continental dynamics such as continent-continent collision, convergence and subduction of plates, and formation of the plateau (Gao, et al, 2005).
Project International Deep Profiling of Tibet and the Himalaya (INDEPTH) is an interdisciplinary program of geophysical and geological studies designed to develop a better understanding of the deep structure and mechanics of the Himalaya-Tibet region (Brown, et al, 1996). The deep seismic reflection profiles showed fine crustal structure on both sides of the Indus-Yalu suture (IYS), which has exerted a far-reaching influence on theworld. Several deep seismic reflection profiles crossing the mountain-basin junction on the northern margin of the plateau were carried out by geophysicists of the Chinese Academy of Geological Science, which afforded an effective basis for studying the deep deformation process resulting from collision (Gao, et al, 2005). The profiles in this plateau, however, were not intensively studied, due to cost. Total length of these was just 1,300 km, 10% of that of the total deep seismic sounding.
The Moho depth is a significant indicator of crustal structure. The great thickness of the Qinghai-Tebet Plateau is unique in the world. So far, seismic methods have been used to explore the Moho depth, among which Deep Seismic Sounding (DSS) is the most effective one. Scientists have paid great attention to the changes in the depth of the Moho from north to south across the Qinghai-Tebet Plateau. Xiong, et al (1985) and Hirn, et al (1984) studied such changes by using data obtained by the Sino-French research project (1981-1982) and later some new probe sections were finished in northern Tibet. It is shown that the Moho is shallow on the northern and southern margins of the plateau, and deep in the central part (Gao, et al, 2005). To date no complete active-source profiles has been done for the purpose of investigating crustal thickness, so the Moho depth and its changes beneath the Himalayas are still unclear (Gao, et al, 2005).
It has seen that Moho depth varies remarkably in the area. This depths were estimated from various seismic data made by the Sino-French project, INDEPTH I, II, III projects, Siling Co-Y'angamdo wide-angle seismic profiles, Tuotuohe-Golmud wide-angle seismic profile, Blasting seismic profiles, etc. in various ways along with natural earthquake data. Using natural earthquake data scientists are suggested that the thickness of the Tibet plate is 120-100 km based on the surface wave dispersion of frequency and body wave inversion (Song et al., 1985; Zhuang, et al., 1992; Chen, et al., 1985; Wu, et al., 1998). On the other hand using various seismic profiles, some have concluded that the average Moho depth of Lhasa block is 55 km (Hirn, et al., 1984) but others estimated the value at 70 km (Xiong, et al, 1985). Zhang, et al. (2001) hypothesised a down wrapping form of the Moho in nothern Tibet, and thought the depth to be at least 80 km. To the south of Bangong-Nujiang suture (BNS), the Moho is reportedly as deep as 80-84 km (Zeng, et al, 1994). Unfortunately, the INDEPTH-II seismic reflection profile was not able to detect the Moho under the Lhasa block (Gao, et al., 2005). Here is our effort to detect the Moho in the INDEPTH-II seismic profiles using the seismic attributes analysis.
Attributes analyses are the different looks for studying geology of the earth. In the present days, seismic attributes analyses are now relatively standard techniques in the seismic exploration industry. The aim of this paper is to bring attributes analysis from industry to academic phase of deep seismic data for the estimation of Moho depth in the central part (Figure 1) of the Tibet (longitudes 90°23'E to 90o48'E and latitudes 29°45'N to 30°19'N) in the INDEPTH-II seismic profiles.

2. Material and Methods
2.1 INDEPTH Seismic Data
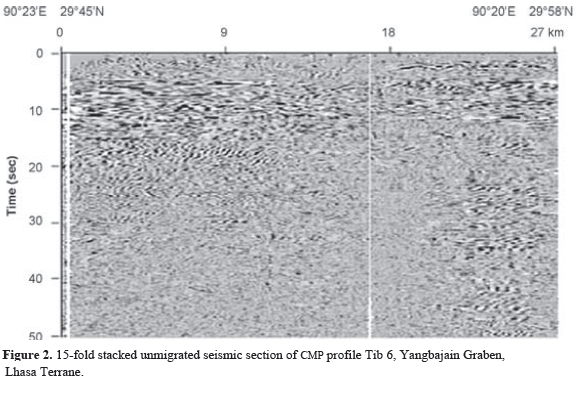
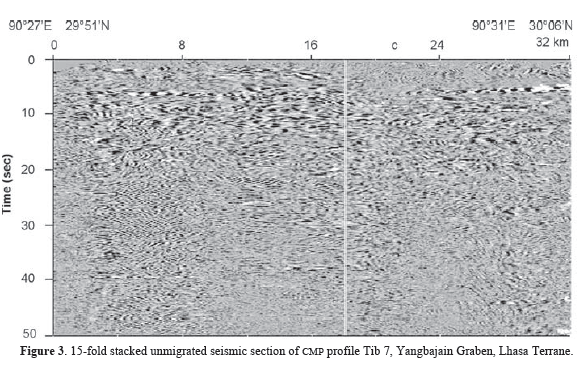
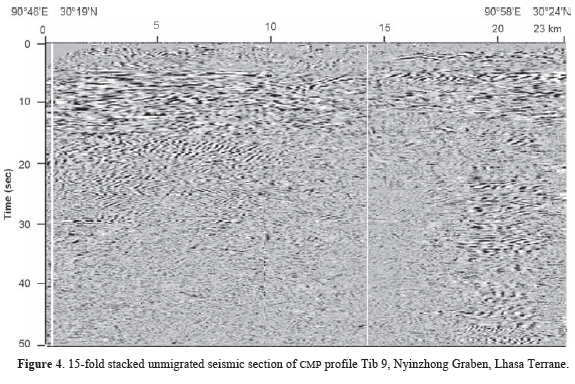
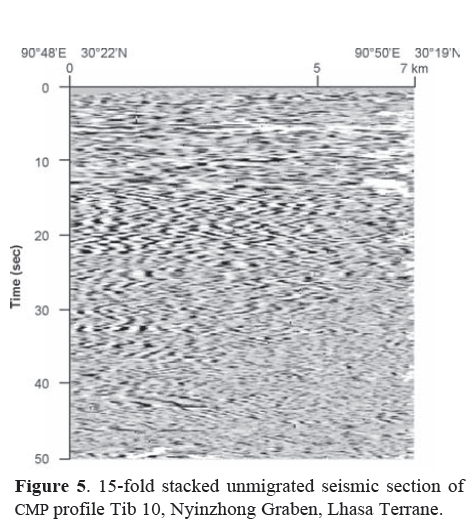
The second phase of Project INDEPTH is cored by about 200 km of deep seismic reflection profiling in the summer 1994 (Nelson, et al., 1996). The reflection profiling and associated wide-angle recording, spans over 300 km from the High Himalayas in the south to the central Tibetan Plateau in the north. Broad-band recording of teleseismic events and geologic field mapping have made up the rest of the project activities. Seismic crew of the Ministry of Geology and Mineral Resources (MGMR) of the People's Republic of China acquired CMP reflection data along nine profile segments with a total length of about 250 km stretching from the Crystalline Himalaya northward into the Tibetan Plateau. Explosive sources, mostly boreholes containing 50 to 200 kg dynamite, were triggered every 200 m along the profile and recorded by a 6 km-long, 240-channel receiver spread. Data have been processed to produce 15-fold stacked sections of the line segments (Brown, et al., 1996; Alsdorf, et al., 1998 a, b). In this work, the analyses have been made for the unmigrated seismic line segments of Tib 6, Tib 7, Tib 9 and Tib 10 of the Yangbajain Graben and Nyinzhong Graben of Lhasa Terrane. The processed 15-fold stacked unmigrated deep seismic reflection data are shown in Figures. 2-5.
2.2 Seismic Attributes Analysis
Seismic attributes like amplitude, phase and frequency attributes analysis can play important roles to study the crustal structure of the earth. Computation of complex attributes is basically a transformation that splits apart the amplitude, phase and frequency information into separate displays. Frequency attribute is the instantaneous frequency of a time signal or the way of time frequency representation. Time frequency representation can be made by SINFIT (Hardy, et al., 2003), AOK (Steeghs and Drijkoningen, 2001), STFT (Chakraborty and Okaya, 1995), Zero-crossing and Complex trace analysis (Taner, et al., 1979) methods. AOK and STFT methods-an extension of Fourier analysis, can estimate the local frequencies but the correct window length must be chosen for better response. Fourier analysis (Press, et al., 1992) can estimate the multiple frequencies of a signal but it is based on the assumption that frequency does not change over the time. Cohen (1995) describes the tradeoff one must make between time resolution and frequency resolution for short time Fourier transforms i.e. time or frequency resolution depends upon window length. Complex trace analysis, not dependent upon window length, in an alternative way is seemed better. Trace analysis is used in this work for the computation of seismic attributes.
Trace analysis treats a seismic trace, y(t) as the real part of an analytic signal or complex trace, Y(t) (Taner, et al., 1979). The complex trace can be written as (Hardy, et al., 2003):
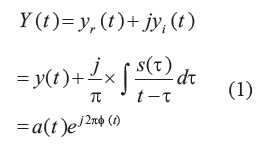
where the imaginary part, , is given by the Hilbert transform
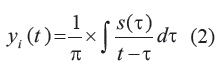
The above integration implies taking the Caucy principle value of the integral. The instantaneous amplitude and phase are
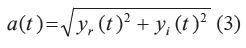
and
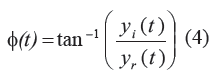
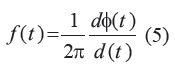
The instantaneous frequency, f(t) is the rate of change of the time-dependent phase:
2.3 Attributes Analysis of Test Signal
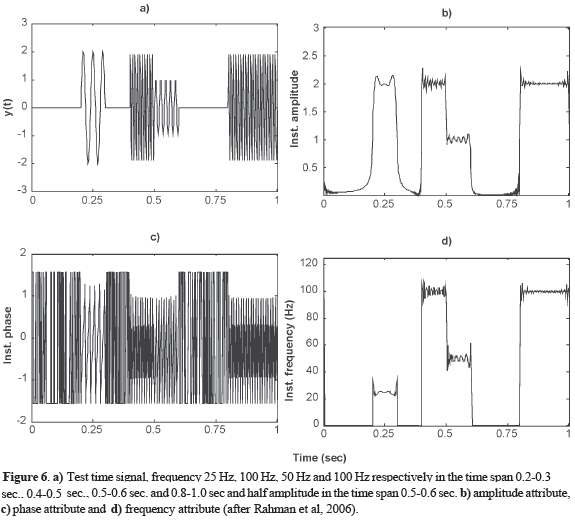
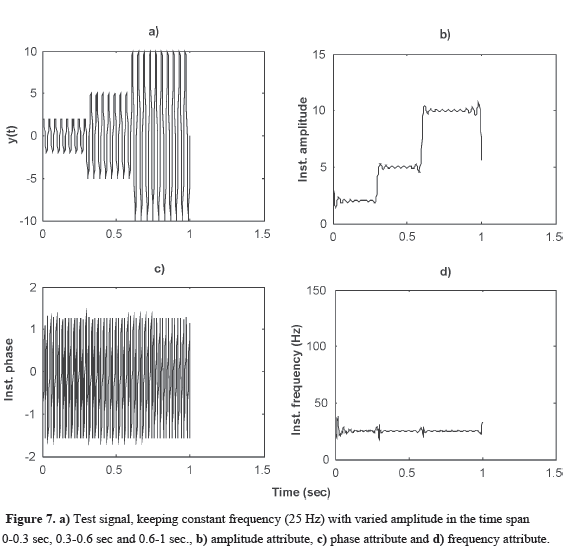
Seismic attributes can be computed from above mathematics. The algorithms along with the programming codes have been developed in this work using the Eqns. 1-5. The developed programs or tools are capable to compute amplitude, phase and frequency attributes of signals. Effort has been made to show how these tools work with examples. The computed amplitude, phase and frequency attributes of the signals are shown in Figures 6-7 respectively. Results have shown accurate attributes estimation. Frequency attributes are thought to be most useful for the interpretation of subsurface geology. Therefore frequency attributes are estimated in the following section for the geologic interpretation of deep seismic data (Figures 2-5)
3. Frequency Attributes Analysis of INDEPTH Data and Interpretation
Frequency attributes of the INDEPTH deep seismic profiles (Figures 2-5) of the southern BNS under the Lhasa block are estimated and shown in Figures 8-11. In each profile, the horizontal axis indicates the distance from southern end and vertical axis indicates the two way travel time in second. In the following, notable features are described from analyzed frequency attributes sections.
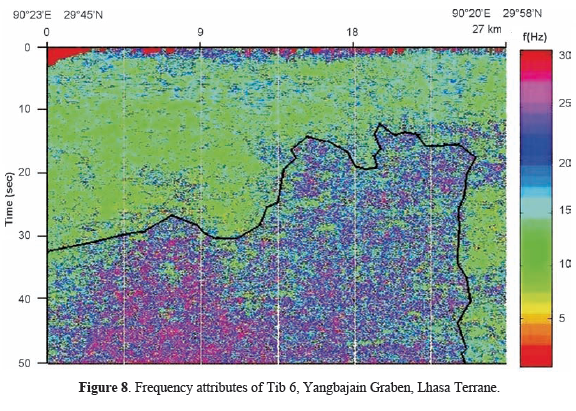


Frequency anomalies are found changes in between 0-30 Hz according frequency scale, as shown in Figures 8-11. There are some specific regions found dominated by 10 Hz (with very little amount of other frequencies) are observed in the frequency attributes sections. The variations of frequency distributions are visible in the all estimated attributes sections. It has seen a little variation around 5-6 sec all over the sections. It is observed that 15-20 Hz frequencies are present at 5-6 second in all most all estimated frequency attributes sections.
Pocket like frequency distributions shown in rectangle a, b and c are present vertically downward in the Tib-7 profile (Figure 9). Another interesting event, all most similar type frequency distribution is also observed in the attributes section (Figure 9). Frequency distribution of 25 Hz with little amount of other frequencies is observed at higher and shallower depth (in the time scale) at a distance 18 km from south and 9 km from north end along the profile Tib 7. These are separated by mainly 10 Hz dominated frequency region.
From the above observations, some additional crustal properties of the central Tibet region are also interpreted as explained. The processed seismic INDEPTH-II profiles (Figures 2-5) made by Brown, et al (1996) have producedmany geologic features of the area. Makovasky and Klemperer (1999) made one of the important contributions from the analysis of the Tibetan bright spots that 10% free aqueous fluid present at a depth of 15 km. Seismic attributes analysis is well agreed with the Tibetan bright spot made at 5-6 second (Rahman, et al, 2006). The presence of frequency distributions (15-20 Hz) in 5-6 second also indicates the same properties. Though, the amount of frequency distributions is not found approximately the same. It is varying and found maximum in the profile Tib 10 (Figure 11), therefore maximum free water should be present beneath profile Tib 10.
Brown's (1996) processed section is so far failed to estimate the Moho depth. In the present study the Moho depths of the region from the same deep seismic profiles are interpreted. The variation of frequency distributions marked by line (Figures 8-11) in the attributes sections, is thought to be the interface of the crust and the upper mantle i.e. Moho. The Sino-French team suggested a depth of 55-53 km for the Moho beneath high Himalayan organic belt, with gentle rise in its northern part based on the records along a profile with the shot point in Tibet and the receiver in Nepal (Xiong, et al, 1985). The INDEPTH-I seismic reflection profile gave a Moho depth of 75 km. With its southern end at Pagri, this profile crosses the high peak region of the Himalayas, so 75 km may indicate the largest depth of the Moho under Himalayas (Zhao, et al, 1993). However, there high-Himalayan crystalline rocks on the southern slope of the Himalayas, and therefore, some geophysicists thought that the depth of 75 km is consistent with the value of 75-78 km obtained by the Sino-French Project along the Paiku Co-Puma Yumgco profile (Teng, et al, 1983; Xiong, et al., 1985). Pelkum, et al. (2005) considered that the Moho depth is ~45 km from Nepal to the southern high Himalayas and reaches ~75 km beneath the Tethyan Himalyas. The Moho is offset beneath the IYS. Hirn, et al. (1984) proposed a larger offset (~20 km), while Xiong, et al. (1985) suggested a smaller offset ( ~10 km). At present, natural earthquake are used for the estimation of crustal thickness. Song, et al. (1985) assumed that the thickness of the Tibet Plateau is 120 km, which is same as the findings of Zhuang, et al (1992). Chen, et al. (1985) reported 100 km by means of the surface wave dispersion of frequency, and Wu , et al. (1998) estimated a thickness of 110 km based on body wave inversion.
Using frequency attributes analysis, the maximum and minimum depths of the Moho beneath the central Tibet area are estimated at higher than 136 km and 20 km respectively. Average RMS velocities are estimated to obtained the Moho depth from Teng,'s et al. (1974) crustal velocity structure. The average Moho depth found varying significantly within the region. Along the profile Tib 6, Moho depth is decreasing towards the north upto 22.5 km from southern end, later towards the end, Moho depth is increased. Tib 7 profile approximately parallel to the Tib 6 shows higher Moho depth (>136 km) at the beginning and decreases as well towards the north. Tib 9 profile from south to north shows once again higher Moho depth (>136 km), which decreases towards the north to a very shallower depth of only 20 km, later increases upto 66 km. While the Tib 10 profile, perpendicular to the Tib 9 shows the Moho depth decreases from 120 km to 96 km.
Some pockets in the attributes distributions (marked rectangles a, b and c in Figure 9) might be the indication of uprised asthenospheric matter which are appeared like vertically connected path from inner core to subsurface. Irregular nature of the Moho surface might be related to the multiple crustal uprising in the subduction zone and irregular ascending of the asthenospheric matter.
Tilman, et al., (2003) reported that the front of the Indian lithospheric mantle was detached 100 km below the Qiantang block, where a mass of asthenospheric matter ascended and was exchanged with the lithosphere. Similar type of frequency anomalies are also identified in the attributes section (Figure 9) at shallower and higher depths. This distribution property at shallower depth might be the indication of ascended asthenospheric matter.
Zeng, et al. (2003) observed multiple crustal subductions in the Himalayas and southern Tibet. The subducting Indian crust must have split apart from its upper, and the Indian lithospheric mantle subducted continuously in the upper mantle, which can be showed by geophysical evidence (Wu, et al, 2004). Xu, et al. (2004) reported that Indian lithospheric slab the area is being subducted gently 400 km north of the IYS, beneath the Tanggulamountains.A large high velocity anomalous zone was split into separate high velocity anomalous bodies, which may be considered as geophysical evidence for abruption brought about by Indian lithospheric mantle subduction. The Moho depth as appeared larger than 136 kmmight be another indication of subducting process of the Indian Plateau in the central Tibet region.
4. ConclusionsThe attributes analysis of the INDEPTH deep seismic data acquired in 1994 provided a fine crustal structure mainly theMoho offset around the southern part (in between BNS and IYS) of Lhasa block. Crustal structure indicates that it contains drastic structural variations. Moho depths are varying from 20 km to more than 136 km. In general, the crust of Qinghai-Tibet Plateau is thinner in its southern, northern and eastern parts but thicker in the western part. While asymmetrical crustal structure is found in the central part. Drastic geologic settings orMoho variations might be introduced for the following geologic process such as: initial convergence, deformation of Tethyan Himalaya, multiple phase emplacement, normal faultingwith strike slip etc. Initial convergent is marked suture zone development and this suture zone demarked as the presence of the YZS is characterized by ophiolite i.e. segment of oceanic crust technically transported in suture zone. Sediments of the Tethyan Himalaya is started to deforming and attaining the physiographic position along the series of thrust zones such as: main crystalline thrust (MCT), main boundary thrust (MBT) and frontal Himalayan thrust (FHT). Double thickness of the Tibetan plateau has attained by multiple phases emplacement of the Eurasian plates. Tibet Block has been inferred as a pericratonic segment of the Eurasian plate and double thickness of this plateau is due to the oblique riding over subducted Indian plate along thewhole of the trans Himalayan belt. Tibetan Block has been affected by a north-north-west regional push of the Indian plate resulted in the development of a right lateral slip motion along Tiansan and Corrcurum trans-Himalayan mega slip zone. This horizontal motion is responsible for multiple phases detachment of Tibetan block fromEurasian plate to attain double thickness. The ophiolites or genetically related extensile stress environment have emplaced tectonically during convergence. It is further interpreted that the northern boundary of Tibetan block along Kunlun and Tangla is characterized by normal faulting with strike slip components. Very uneven Moho structure in the central part may indicate further crustal changes in the area.
AcknowledgementAuthors acknowledge the Project INDEPTH team, especially Dr. Larry D. Brown, Institute for the Study of the Continents, Cornell University, Ithaca, N.Y. for making data available through web site.
Authors acknowledge the Project INDEPTH team, especially Dr. Larry D. Brown, Institute for the Study of the Continents, Cornell University, Ithaca, N.Y. for making data available through web site.
1. Alsdorf, D., Brown, L. D., Nelson, K. D., Makovsky, Y., Klemperer, S. L. and Zhao, W. (1998a). Crustal deformation of the Lhasa terrane Tibet Plateau from INDEPTH deep seismic reflection profiles, Tectonics. 17, No. 4, 501-519. [ Links ]
2. Alsdorf, D., Makovsky, Y., Zhao, W., Brown, L.D., Nelson, K.D., Klemperer, S., Hauck, M., Ross, A., Cogan, M., Clark, M., Che, J. and Kuo, J. (1998b). INDEPTH (International Deep Profiling of Tibet and the Himalaya) multi-channel seismic reflection data: Description and availability, J. Geophysical Res. 103, No. 11, 26993-26999. [ Links ]
3. Brown, L. D. (1994). Project INDEPTH: An Evaluation of Sino-US collaborative activities during Phase II Preliminary Draft, Institute for the Study of the Continents, Cornell University, Ithaca, N.Y. 14853, 13 pp. [ Links ]
4. Brown, L. D., Zhao, W., Nelson, K. D., Hauck, M., Alsdorf, D., Ross, A., Cogan, M., Clark, M., Liu, X. and Che, J. (1996). Bright spots structure and magmatism in southern Tibet from INDEPTH seismic reflection profiling, Science. 274, No. 5293, 1688-1690. [ Links ]
5. Chakraborty, A. and Okaya, D. (1995). Frequency-time decomposition of seismic data using wavelet-based methods, Geophysics. 60, No. 6, 1906-1916. [ Links ]
6. Chen, G.Y and Zeng, R.S. (1985). The difference of lithosperic structure between Himalayan mountain and Tibetan plateau from surface wave dispersion, Acta Geophysica Sinica. 28, 161-173. [ Links ]
7. Cohen, L. (1995). Time-frequency Analysis, Prentice Hal, Inc. [ Links ]
8. Gao, R., Lu, Z., Li, Q., Guan, Y., Zhang, J., He, R. and Huang, L. (2005). Geophysical survey and geodynamic study of crust and upper mantle in the Qinghai-Tibet Plateau, Episode. 28, No. 4, 263-273. [ Links ]
9. Hardy, H.H., Beier, R.A. and Gaston, J. D. (2003).Frequency estimates of seismic traces, Geophysics. 68, No. 1, 370-380. [ Links ]
10. Hirn, A., Lepine, J.C., Jobert, T.G., Sapin, M., Wittlinger, G., Xu, Z.X., Gao, E.Y., Wang, X.J., Teng, J.W., Xiong, S.B., Pandey, M.R. and Talte, J.M. (1984). Crust structure and variability of the Himalayan border of Tibet, Nature. 307, No. 5946, 23-25. [ Links ]
11. Makovsky, Y., and Klemperer, S.L. (1999). Measuring the seismic properties of Tibetan bright spots: Evidence for free aqueous fluids in the Tibetan middle crust, J. Geophys. Res. 104, No. 5, 10,795-10,825. [ Links ]
12. Nelson, K.D., Zhao, W., Brown, L. D., Kuo, J., Che, J., Liu, X., Klemperer, S.L., Makovsky, Y., Meissner, R., Mechie, J., Kind, R., Wenzel, F., Ni, J., Nabelek, J., Chen, L., Tan, H., Wei, W., Jones, A.G., Booker, J., Unsworth, M., Kidd, W.S.F., Hauck, M., Alsdorf, D., Ross, A., Cogan, M., Wu, C., Sandvol, E. and Edwards, M. (1996). Partially molten middle crust beneath southern Tibet: synthesis of Project INDEPTH results, Science. 274, No. 5293, 1684-1688. [ Links ]
13. Pelkum, S., Monsalve, G., Sheehan, A., Pandey, M.T., Sapkota, S., Bilham, R. and Wu, G. (2005). Imaging of the Indian subcontinent beneath the Himalaya, Nature. 435, 1222 1225. [ Links ]
14. Press, W. H., Teukolsky, S. A., Vetterling, W. T. and Flannery, B. P. (1992). Numerical recipes in C: The art of scientific computing. Cambridge Univ. Press. [ Links ]
15. Rahman, S. M., Islam, M. R., Keramat, M. and Islam, M. S. (2007). Seismic attribute analysis for the characterization of Tibetan bright spots: INDEPTH Seismic Profiles Tibet 9 and 10, Journ of Geoc Soc of India. 69, No. 4, 739-745. [ Links ]
16. Song, Z.H., An, C.Q., Wang, C.Y., Chou, Z.R. and Zhang, L.J. (1985). The P-wave velocity of the upper mantle beneath Qinghai-Tibet plateau and north-south seismic zone, Acta Geophysica Sinica. 28, 148-160. [ Links ]
17. Steeghs, P. and Drijkoningen, G. (2001). Seismic sequence analysis and attribute extraction using quadratic time-frequency representations, Geophysics. 66, No. 6, 1947-1959. [ Links ]
18. Taner, M. T., Koehler, F. and Sheriff, R. E. (1979). Complex seismic trace analysis, Geophysics. 44, No. 6, 1041-1063. [ Links ]
19. Teng, J.W. (1974). Deep reflected waves and the structure of the earth crust of the eastern part of Qaidam vasin, Acta Geophysica Sinica. 17, No. 2, 121-134. [ Links ]
20. Teng, J.W., Yin, Z.X., Xu, Z.X., Wnag, X.T. and Lu, D.Y. (1983). Structure of the crust and upper mantle pattern and velocity distributional characteristics in the Northern Himalayan mountain region, Acta Geophysica Sincia. 26, No. 6, 525-540. [ Links ]
21. Tilmann, F., Ni, J. and INDEJPTH Seismic Team. (2003). Seismic imaging of the down-welling Indian lithosphere beneath central Tibet, Science. 300, 1424-1427. [ Links ]
22. Wu, J.P., Ming, Y.H, Ye, T.L., and Zeng, R.S. (1998). Upper mantle velocity structure in the Qinghai-Xizang Plateau from inversion of body wave-forms, Acta Geophysica Sinica. 41, 15-25. [ Links ]
23. Wu, Q.J., Zeng, R.S. and Zhao, W.J. (2004). Dipping structure of upper mantle and continent-continenet collision in Himalyas-Tibet Plateau, Science in China ( Series D). 34, No. 10, 919-925. [ Links ]
24. Xiong, S.B., Teng, J.W. and Yin, Z.X. (1985). Research on the fine crustal structure of the northern Qilian-Hexi Corridor by deep seismic reflection, Chinese Journal of Geophysics. 38, 29-35. [ Links ]
25. Xu, Z.Q., Jiang, M., Yang, J.S., Xue, G.Q., Su, H.P., Li, H.B., Cui, J.W., Wu, C.L. and Liang, F.H. (2004). Mantle structure of Qinghai-Tibet plateau: Mantle plume, mantle shear zone and delamination of lithospheric slab, Earth Science Frontiers. 11, No. 4, 329-343. [ Links ]
26. Zeng, R.S.,Wu, F. and Owens, J.T. (1992). Introduction of Sino-American Project "Study of geodynamics and structure of crust and upper mantle of the Qinghai-Tibet Plateau", Acta Seismologica Sinica. 14, 521-522. [ Links ]
27. Zeng, R.S., Ding, Z.F. and Wu, Q.J. (1994). Areview of the lithospheric structure in Tibetan plateau and constraints for dynamics, Acta Geophysica Sinica. 37, 99-116. [ Links ]
28. Zeng, R.S., Teng, J.W., Li, Y.K., Klemperer, S. and Yang, L.Q. (2002). Crustal velocity structre and eastward escaping of crustal material in the southern Tibet, Science in China. 32, No. 10, 793-798. [ Links ]
29. Zhao, W.J., Nelson, K.D. and Project INDEPTH Team. (1993). Deep seismic reflection evidence for continental underthrusting beneath southern Tibet, Nature. 366, No. 9, 557-559. [ Links ]
30. Zhang, Z.J., Li, Y.K., Wang, G.J., Teng, J.W., Klemperer, S., Li, JW., Gan, J.Y. and Chen, Y. (2001). E-W Crustal structure under the northern Tibet revealed by wideangle seismic profiles, Science in China (Series D). 31, No. 11, 881-888. [ Links ]
31. Zhuang, Z., Fu, Z.W., Lu, Z.L., Hu, J.G., Song, Z.H., Chen, G.Y., An, C.Q. and Chen, L.H. (1992). 3-D shear velocity model of crust and uper mantle beneath the Tibetan plateau and its adjacent region, Acta Geophysica Sinica. 35, No. 6, 694-709. [ Links ]

