


Services on Demand
Journal
Article
 English (pdf)
 Article in xml format
 Article references
 Send this article by e-mail
Indicators
-
 Cited by SciELO
 -
 Access statistics
Related links
-
 Cited by Google
 -
 Similars in
SciELO
Similars in
SciELO -
 Similars in Google
Share

 Permalink
Earth Sciences Research Journal
Print version ISSN 1794-6190
Earth Sci. Res. J. vol.14 no.1 Bogotá Jan./June 2010
CSEM IMAGING OF THE NEAR SURFACE DYNAMICS AND ITS IMPACT FOR FOUNDATION STABILITY AT QUARTER 27,15th OF MAY CITY, HELWAN, EGYPT
Magdy A. Atya1, Olga A. Khachay2, Mamdouh M. Solimán1, Oleg Yu Khachay3, Ahmed B. Khalil1, Mahmoud Gaballah1, Fathy F. Shaaban1,4, Ibrahim A. El Hemali1
1 National Research Institute of Astronomy and Geophysics (NRIAG), 11722 Helwan, Egypt.
2 Institute of Geophysics, Russian Academy of Science (RAS), Ural Division, Russia.
3 Ural State University, Russia.
4 King Khaled University, Faculty of Science, Physics Department, Abha, Saudia Arabia.
Manuscript received: 28/03/2010 Accepted for publication: 20/05/2010
ABSTRACT
In the present work, we involve the Control Source Electromagnetic (CSEM) Technique to image the dynamic migration center of the near surface fractures, fissures, and cracks in anew dwelling area at 15th of May city close to Cairo. This area forms the center of the zonal weakness of the subsoil, which in turn, interact with the weight center of the construction leading to catastrophic collapses.
The control source electromagnetic technique has been developed recently to monitor the migration of the weakness center represented as the accumulative fissures and cracks in the near surface. Three composite profiles of wide and planshet mesh data have been collected in 2008. This survey has been followed by performing two profiles in 2010; one ofthese profiles has been repeated to observe the situation changes, and the second profile has been measured between the other two profiles of 2008. The last profile had been performed to study the mutual relation between the measurements of the two cycles. The objectives of the whole process are to validate the capability of the technique to pick the minor changes of the weakness center, consequently, study its relation to the weight center of the adjacent construction to produce a recommended procedure to minimize the destruction resources at the site of investigation.
The measured data has been interpreted and represented in graphs showing the distribution of the heterogeneity of the geoelectric parameters in the subsoil, furthermore, in a series of geoelectric cross section representing the applied frequencies used during the survey. The study concludes that (1) the center of the cracked zone is moving upward closer to the surface of the ground and heaver, (2) the water content is moving downward producing soil dryness at the shallow depths, and (3) the site became more stable in 2010 than 2008, however, the destruction resources remain warning with collapse events. Furthermore, the situation reflects the relation between the water content and the changes in the weakness center.
Key words: electromagnetic technique, en helwan, weakness center, control source electromagnetic (CSEM)
RESUMEN
En el presente trabajo, aplicamos la Técnica de Fuente Electromagnética Controlada (CSEM) para obtenerla imagen del centro dinámico de la migración de las fracturas, fisuras y grietas de la superficie somera en una nueva área de vivienda en la ciudad de 15 de mayo cerca a El Cairo. Esta zona constituye el centro de la debilidad del subsuelo, que a su vez, interactúacon el centro de peso de la construcción que ha llevado a colapsos catastróficos.
La técnica de Control de Fuente electromagnética se ha desarrollado recientemente para monitorearla migración del centro de la debilidad, representados por la acumulación de fisuras y grietas de la superficie somera. Tres perfiles compuestos se han recogido en 2008. Este estudio se ha seguido realizando con dos perfiles en 2010. Uno de estos perfiles se ha repetido para observar los cambios, y el segundo perfil se ha medido entre los otros dos perfiles de 2008. El último perfil se ha realizado para estudiar la relación mutua entre las mediciones de los dos ciclos. Los objetivos de todo el proceso es validar la eficacia de la técnica para recoger los mínimos cambios del centro de la debilidad, y así, estudiar su relación con el centro de peso de construcciones cercanas, para recomendar un procedimiento que reduzca al mínimo la destrucción de los recursosen el sitio de la investigación.
Los datos medidos se haninterpretado y representado en gráficos que muestran la distribución de la heterogeneidad de los parámetros geo-eléctricos en el subsuelo; además, en una serie de seccionescruzadas geoeléctrica se representa las frecuenciasutilizadasdurante el estudio. El estudio concluye que (1) el centro de la zona agrietada se mueve hacia arriba cerca de la superficie de la tierra, (2) el contenido de agua está bajando, produciendola sequedad del suelo apoca profundidad, y (3) el sitio se volviómás estable en 2010 que en 2008, sin embargo, los producto de la destrucción siguen susceptiblesa colapsos.Además, la situación refleja la relación entre el contenido de agua y los cambios en el centro de debilidad.
Palabras clave: técnica electromagnética, en helwan, centro de debilidad, control de código fuente electromagnética (CSEM)
1. Introduction
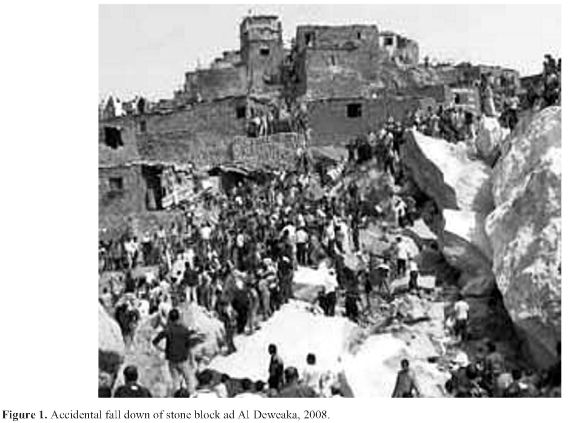
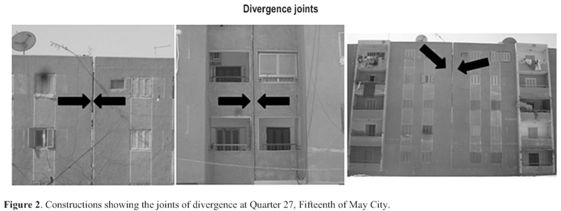
The idea behind the present paper reflects the capability of the applied and environmental geophysics to be involved in the community problems. Accordingly, it is strongly recommended to establish a monitoring system for the detection of possible occurrence of disasters. Currently, various kinds of geophysical systems are being operated for environmental monitoring purpose and detecting the subsurface temporal changes. The problem under investigation is related to the unstable subsurface. The subsurface heterogeneity caused by the intensity of the fractures, the fissures, the cracks, and the water content, is a factor of the instability level of the base ground beneath the constructions. Such instability of the rock status resulted in several destructions at many places such as the stone block fallen at Al Deweaka (Fig. 1) and at the Second Level of Al Mokkatam Plateau, furthermore, the constructions deformation like that happened in the 15th of May City, Quarter 27 (Fig 2), and land subsidence like that occurred at several parts of Wadi Hof province and along the Autostrade form Al Maadi to the margins of 15th May towards Al Tebbeen.
The research layout is devoted to observe and monitor the near surface structures and to follow the growth of the intensity of the fractures, the fissures and the cracks. The water content and its salinity is also an important factor to be observed and followed. It is planned that, the observation and monitoring phase will run arbitrary at the start of the work to calculate the optimum measurement circulation comparable to the cyclic stress forces or loads affecting the near surface structures. Then the situation will be subject of vector analysis to provide a management procedure to reduce the destruction resources and overcome or at least minimize the collapse.
Geophysics can easily detect the presence of different objects in wide range of applications. However, if those geophysical measurements are repeatedly obtained and compared, additional temporal dimension analysis makes interpretation and characterization of target much easier (Hachay, 2004, Hachay et al., 2007).
The CSEM approach involves the possibility to survey the subsurface in volume block as wide profiling and planshet pickets along profiles. Therefore, the technique is capable to produce an image of the subsurface representing the near surface structural setting of the fissures, cracks, fractures, and also the hydrologic situation.
Getting enough information about the structural image of the surface including the heterogeneity intensity and the concentration depth of the fractures, cracks, and the development of their growth, and also the water content will help to provide an objective procedure assures the best management of the site, therefore, the catastrophic and dramatic accidental results will be minimized.
The technique is proposed to be applied on a site with destruction resources that is warning with collapse, the site has been measured in 2008 and repeated in 2010. The comparative study of the subsoil images obtained in the two cycles represents enough information about the subsurface structural changes occurred during the time interval between the two cycles.
The study concludes that, the center ofweakness zone is moving upwards and became denser as the water saturation became less in 2010 than 2008. That means that the fracture contacts at the subsurface became closer to the surface and became heavier, while the water is moving downwards. The technical impact of this result is the site became more stable but still dangerous and is subject to collapse.
2. Objectives
The expected objectives and outcome of the present paper could be declared in the following items:
1) Full understanding of the site of investigation, proposed here which is the quarter 27 at 15th of May city, and a more instable site in Al Mokkatam plateau.
2) A documentary archive of the situation including the hydrologic setting, the subsurface structure, the geoelectric heterogeneity move of the center, and upgradable conclusions.
3) Vector analysis with locations of the forces applied to the area in reference to the center of heterogeneity.
4) A monitoring protocol and a management procedure for the site of investigation.
5) And finally the main object ofthe research which is the overcome or at least reduce the catastrophic impact via pre read of the destruction resources and probably prediction of the accident.
3. Geological Background and Site Description
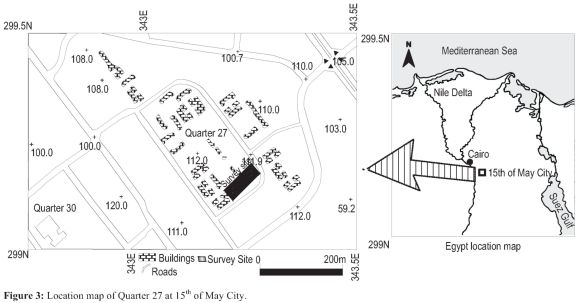
The city of 15th of May is constructed over a limestone plateau on the eastern bank of the River Nile (Fig. 3). This plateau is covered mainly with Wadi Garawi and El-Qurn Formations of middle Eocene age. El-Qurn formation is of about120 m thick and is composed of chalky and marly limestone intercalated with shale, sandy marls and shale banks (Strougo, 1985; Said, 1990).
In addition, these formations are highly jointed, highly fossiliferous, vuggy and sandy dolomitic limestone. Structurally, the area is affected by three major sets of faulting systems striking mainly inNW-SE, E-W, andNE-SW directions. All of them are normal faults, with dip ranges from 7u to 40u, where the beds are locally dragged. In addition to faults, there are at least many sets of joints dissect the area (Moustafa et al., 1985). These joints trend in E-W and NW-SE directions (Moustafa etal., 1985; Farag, and Ismail, 1959).
The major fractures in the area around Cairo and its vicinity were interpreted based on satellite image of large scale (El-Shazly et al., 1980). These fractures were analyzed statistically and each trend of fractures sets was treated separately. It was found that there are three main trends which are EW, WNW and NW.
4. Theory and Mathematics of CSEM 4.1 Principal
The CSEM provides an enhanced geophysical technique and device, in addition to, the precise analytical interpretation of the geophysical complexes for subjects such as the topic of this research, especially when the primary information about the site is not enough. The device has been established to use the planshet method of electromagnetic induction (Hachay, 1997a, Hachay and Bodin, 1997b, Hachay et al., 1999, and 2000, Hachay, 2002) in the frequency domain. The method was adapted to map and monitor the high complicated geological mediums, to determine the structural factors and criteria of stability of the rock massif in the mine subsurface. The field observation and the way of interpretation make the new technology differ from other known earlier methods of field raying or tomography (Atya et al., 2010, Hachay and Novgorodova, 1997c, Hachay et al., 1999, and 2000, Lau and Cheng, 1977).
The concept to construct the 3D geoelectric medium is based on interpreting the alternating electromagnetic field in the frame of a block-layered isotropic medium with inclusions over three stages (Hachay 1997a, and 2002); in the first stage, the geoelectric parameters of the horizontal block-layered medium, which includes the block heterogeneities, are defined, in the second stage, a geometrical model of the different local heterogeneities or groups inside the block-layered medium is constructed based on the data of local geoelectrical heterogeneities, while in the third stage, the surfaces of the searched heterogeneities could be calculated in account of the physical parameters of the anomalous objects.
4.2 Data collections
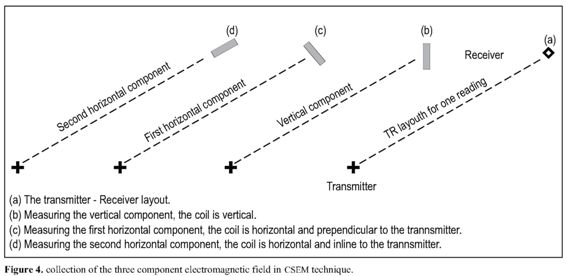
The CSEM S*data collection is a measure of the geoelectric parameters of a medium, through which the electromagnetic waves propagates from the transmitter to the receiver. At each location of the transmitter and receiver, the three components of the electromagnetic field are measured. Figure (4) explains the layout of the acquisition process. (a) Shows an arbitrary position of the transmitter and receiver during a wide profile survey, (b) shows the measurement of the vertical component Z, while the receiver coil is placed vertical, (c) shows the measuring of the first horizontal component H1, while the receiver coil is placed horizontal at right angle with the line between the transmitter and the receiver, and (d) shows the measuring of the second horizontal component, while the receiver coil is placed horizontal inline coaxial with the line between the transmitter and the receiver. The transmitter can inject more than a controlled frequency to scan different depths at the survey area.
The measuring procedure could be classified into tow configurations, in correspondence to the objects of the survey.
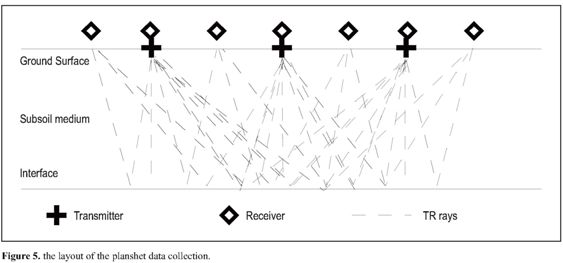
Planshet data collections; is a procedure to collect the electromagnetic response over a 2D plan underneath the line between the transmitter and the receiver. Figure (5) shows the process of gathering the planshet data. In this procedure, the transmitter and receiver are placed on the same line. The transmitter is placed at its first station, as the receiver moves stepwise at pre defined pickets along the profile. Then the transmitter is moved to the next station and the receiver repeat the stepwise movement along the profile. This process is repeated until the last transmitter station.
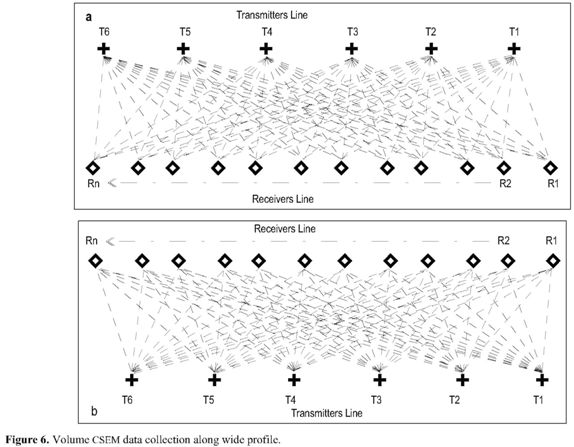
Wide profile data collection; is a procedure employed to measure the electromagnetic response over a volume, therefore, it may be called volume CSEM. In this procedure, the transmitter is placed on a line, while the receivers are placed on a parallel line. Both of the transmitter and receiver stations on the lines are marked as pickets. The survey volume is margined with the two lines. The data collected on two phases, the first is measures as the transmitter is placed on a line and the receiver is placed on a parallel line (Fig. 6a), while in the second phase, the lines are exchanged and the transmitter is placed on the receiver line and vise versa (Fig. 6b), the combination of the two phases produces the final image of the volume block.
4.3 Interpretation
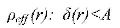
For each array and fixed frequency c two interpretation parameters are defined:

Where peff (r) is the apparent resistivity, r is the distance between the source and the point of observation, co is the frequency f multiplied by 2m, |Hz| is the module of the vertical magnetic component, |Hr| is the horizontal component of magnetic field oriented to the source, S(r) is the parameter of geoelectrical heterogeneity, and |Hpp is the second horizontal component of magnetic field perpendicular to the direction of the source.
That data are the information base for the further interpretation. On the first stage we define the geoelectrical parameters of the 1-D section for each array and each frequency after the preliminary filtration of the data:
Where, A is a level of data filtration to the area of inverse problem operator for one-dimensional medium (Hachay, 1997a).
The interpretation is made in a frame of n-layered model for each array and planshet location. After that each point of the planshet is associated with one and only column of layers thicknesses and corresponding fixed column with resistance of the medium in that layers. Gathering information of all planshets together we obtain a many-valued function of each point - distribution of thicknesses and resistances of the medium layers. Then we calculate the average value for these distributions for each point of the observation set. Thus we obtain the unique distribution of thicknesses of horizontal layers and resistances, which corresponds to the medium model as a cylinder with vertical axis and with a rectangle at the bottom and with a point of observation located in its center. Thus we change over layered model to a block-layered model. Then, gathering the values of thicknesses and resistances for all points of observation, located on one and the same profile we obtain the file of an average cross-section along the profile.
The next step is combining the neighboring blocks with close-range values of resistance to one block. That operation is made according to the fixed scale of resistance.
The second stage of interpretation is used to define the geometrical characteristics of conductive inclusions and their equivalent moments, which are proportional to the ratio of the conductivity difference in the host rock and in the inclusion to the conductivity in the host rock. Here the approximation principle is used for alternating electromagnetic fields. The initial model of the inclusion is a current line of fixed length. That approximation construction is used for fitting of the average parameter of geoelectrical heterogeneity, which is calculated as an average value of 8 in each point of the profile, located in each point of the profile (Hachay, 2002).
When the survey has been repeated to estimate the changing of the rock state, during the interpretation, we take all parameters from the previous cycle as the initial values for interpretation data for the next cycle.
5. Field measurements
In the present paper, two comparative data sets have been collected; the first data set has been obtained during the spring of2008, and the second has been collected in the winter of 2009/2010. The first data set is composed of three wide profiles (Fig. 7) employed to investigate the subsurface among the deformed buildings at Quarter 27, fifteenth of May City, the applied frequencies are 80.15, 40.62 and 20.3.
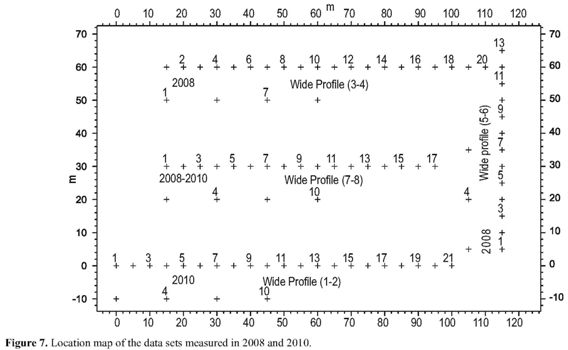
The second data set is composed of two wide profiles (Fig. 7); the first profile is a repetition profile and the second is a new measured profile laid between two profiles of 2008.
The applied frequencies to the system during the two cycles were: 40.62, 20.3, and 10.15 kHz.
6. Interpretation
The two data sets have been analyzed and converted into graphs and cross sections representing the distribution ofthe geoelectric heterogeneity of the subsoil. In the present paper we give more consideration to the comparative tasks to estimate the discrepancies in the electromagnetic image that might have been occurred with the time interval of the two cycles.
Therefore, two comparative studies will be discussed; the first will be the repeated profile that has been measured in 2008 and 2010. The second will be between a profile from the data set of 2008 and another from the data set of 2010 measured between the profiles of 2008.
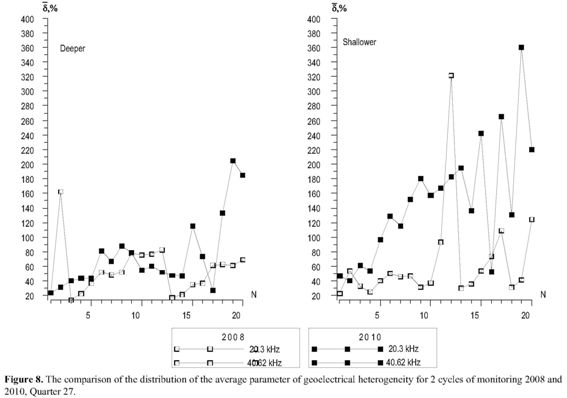
Firstly; the two profiles represent the same medium while the measurements have been taken over the same pickets in 2010 as in 2008. Figure (8) shows the comparative distribution of the average parameter of the geoelectric heterogeneity, it elucidates that the level is higher in range for the cycle of 2010 than the cycle of 2008. This could be interpreted in reference to the soil material that the subsurface beneath the measured profile became less conductive and more resistive, which might be contributed to the migration of the underground water far away either laterally or into deeper depths.
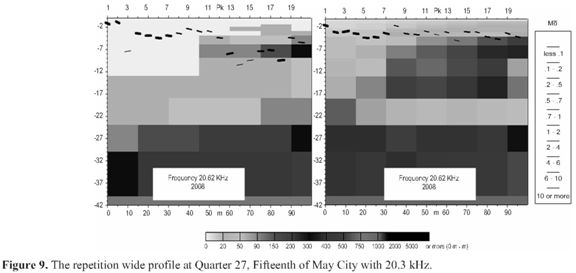
The graphs in figure (9) represent the deeper frequency 20.3 kHz for the wide profile measured in 2008 and 2010. It could be easily noticed that, the medium became more resistive in 2010 than 2008. The center of the crack concentration at each picket became more regular, parallel, and closer to the ground surface. The start of the profile shows an area (pickets 1-7) where the cracks became denser making the zone more instable, while around the end of the profile; the crack situation produced more stability.
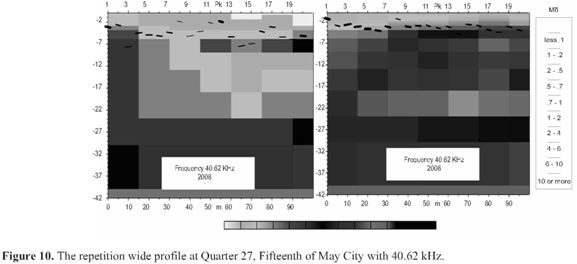
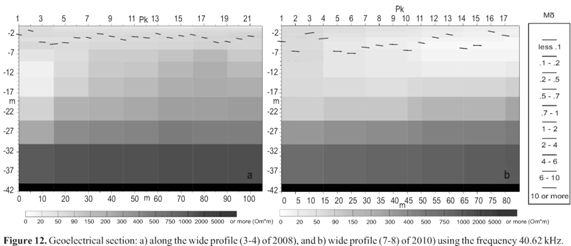
The two geoelectric sections of the frequency 40.62 kHz (Fig. 10), they show that the irregularity is, generally, less, furthermore, it became more regular, but denser and closer to the ground surface in 2010 than 2008.the water content of the general medium became also less producing more resistive soil.
Secondly, the comparative study between a profile measured in 2008 and another measured in 2010 representing two different mediums.
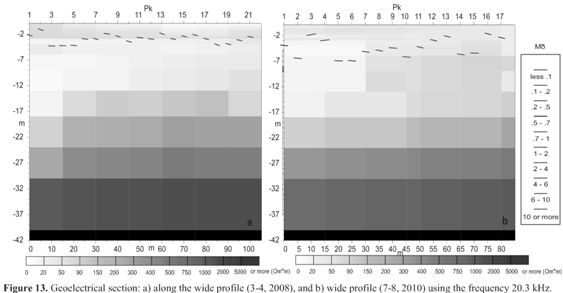
Figures (11, 12 and 13) show that, the cross sections of the wide profile (7-8) are more conductive and the disintegration zones are more intensive and are located deeper than of the wide profile (3-4) (Fig. 7). The state of the massif along the new profile can be estimated as less stable than for the wide profile (1-2) and for the wide profile (3-4).
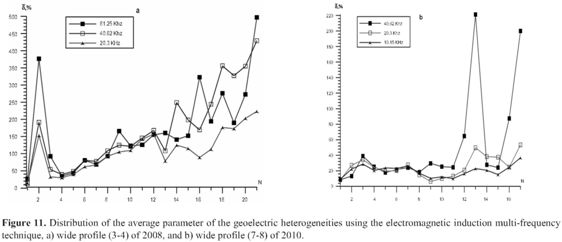
The cross sections give a quantitative informative layout about the structure and state of the massif. Having more cycles of observation, a stability table of stability of the rock state will be constructed.
7. Conclusion
The present work involves the Control Source Electromagnetic approach to use the multi-frequency function for observing the near surface parameters and monitoring the change of geoelectric heterogeneity distribution. The techniques utilizes a series of fixed frequencies to probe the subsurface using the planshet picket profiling to measure the integrated image in depth plan beneath the transmitter to receiver distance, and the wide profiling to investigate the 3D block of the electromagnetic induction between the transmitter line to the receiver line. This survey way provides high resolution informative image about the depth of investigation.
The area of investigation is laid at the Quarter 27, Fifteenth of May City, where the shallow surface of the ground is highly fractured producing a level of danger on the constructions and the block buildings at many sites of the Quarter. The move of the fracture center and its combination with the center of weight applied on the ground by the construction loads results in the change of the destruction resources which might lead to collapse, landslide, or divergence over the joints of the blocks.
Two cycles of measurements have been collected in 2008 and 2010; the first was composed of three wide profiles investigated the area among the block buildings of Quarter 27. The selected location of the profiles has been selected to cover areas where the constructions show divergence over the block joints and landslide and fractures. The second cycle of observation has been collected in the winter of 2009/2010 in form of two wide profiles; one of them is a repeat of one of the profiles of 2008 while the second is a new measurement, but lay between the profiles of 2008.
The data of the two cycles has been analyzed and comparatively interpreted to show the subsurface situations and enhance the relation between the two cycles. A series of 2D sections and analytical graphs have been constructed to show the distribution of the average geoelectric parameters and the fracture and crack distribution considering their weight over the depth of investigation.
The interpretation of the two cycles showed that the technique is capable to image the subsurface change recorded in the two data sets. The results showed that the fractures and cracks became denser and their center is moving upwards to the ground surface, while the water content became less and moved deep ward. The rock state became more resistive and stable in 2010 than 2008, but is still suffering from the destruction resources.
8. Recommendations
It is high recommended to repeat the measurement over arbitrary time interval until reaching the optimum cycling of the force applied on the ground surface and cyclic motion of the center of the cracks and fractures.
9. Acknowledgement
The work has been done in cooperation of researchers from the National Research Institute of Astronomy and Geophysics (NRIAG), Helwan, Egypt and researchers from the Institute of Geophysics (IGF), Ural Division (UD) of Russian Academy of sciences (RAS), Russia. The work has been financed by the local resources of NRIAG and the instrument belongs to IGF. The authors thank the cooperation of the City Office of 15th of May City. Also, thanks are given for Miss Mona Abu Shady and the helping team for collecting the data of the first cycle.
10. References
Atya M. A., Hachay O. A., Abdel-Lattif A. A., Khachay O. Yu., El-Qady G. M., and Taha A. I., 2010: Geophysical contribution to evaluate the hydrothermal potentiality in Egypt: case study: Hammam Faraun and Abu Swiera, Sinai, Egypt, Earth Sciences Research Journal, in press. [ Links ]
El-Shazly, E.M., El-Ghawaby, M.A., Salamn, A.B., Khawas, S.M., El-Amin, H., El-Rakaiby, M.M, El-Aassy, I.E., Abdel-Megid, A.A., and Mansour, S.I., 1980: Geological Map of Egypt, Remote Sensing Center, Academy of Scientific Research and Technology, Cairo, Egypt. [ Links ]
Farag, I., and Ismail, M., 1959: Contribution to the stratigraphy of the Wadi Hof area (northeast Helwan): Bull. Fac. Sci., Cairo Univ., 34, 147-168. [ Links ]
Hachay O. A., 1997a: The three stage concept of common interpretation for 3-d electromagnetic and seismic fields and some results ofits practical realization, Engineering and environmental geophysics for the 21st century, China, Chengdu 286-292. [ Links ]
Hachay O. A., Bodin V. V., Novgorodova E.N., Bodin Vd. V., Hachay A. Yu.,and Hinkina T.A., 1997b: A new complex near-surface electromagnetic and seismic technique for 3-d research of inhomogeneous and unstationary medium, Engineering and environmental geophysics for the 21st century. China, Chengdu 181-189. [ Links ]
Hachay O. A. and Novgorodova E. N., 1997c: The experience of area induction research of sharp heterogeneous geoelectrical medium, Fizika Zemli 1997, 5, 60 -64. [ Links ]
Hachay O. A., Novgorodova E. N, and Bodin V. V., 1999: About the problems of near surface geoelectricity and some results of their solution, Fizika Zemli, 1999, 5, 47-53. [ Links ]
Hachay O. A., Novgorodova E. N.and Hachay A. Yu., 2000: Mapping of 3-D conductive zones with use of area systems of observation in a frame of 3-D frequency-geometrical method, Geology and geophysics, 41, 9, 1331-1340. [ Links ]
Hachay O. A., 2002: New conception of active and passive electromagnetic 3-D monitoring of volcanoes and active faults, III International Workshop on magnetic, electric and electromagnetic methods in Seismology and Volcanology, Moscow, RAS 169 -171. [ Links ]
Hachay O.A., 2004: To the question of structure and state research of geological heterogeneous nonstationary medium in a frame of discrete and hierarchic model, Russian geophysical journal, 33, 34, 32-37. [ Links ]
Hachay O.A., and Hachay O. Yu., 2007: Research estimation and classification of stability of geological medium with use of data of active geophysical monitoring on the base of physical mesomechanics idea, Physical mesomechanics, 10, 2, 87-92. [ Links ]
Hachay O.A., 2007: Research of nonstability of the rock massive with use the method of active electromagnetic monitoring, Physics of the Earth, 4, 65-70. [ Links ]
Lau K. H. and Cheng P., 1977: The effect of dike intrusion on free convection in conduction-dominated geother-mal reservoirs, Intern .J. Heat and Mass. Trans., 20, 11, 197-209. [ Links ]
Moustafa, A., Yehia, A., and Abdel Tawab, S., 1985: Structural setting in the area east of Cairo, Maadi and Helwan: Middle East Res. Centre, Ain Shams Univ., Sci. Res. Series, 5, 40-64. [ Links ]
Said, R., 1990: Geology of Egypt, Balkema Pub., Rotterdam, Netherlands. [ Links ]
Strougo, A., 1985: Eocene stratigraphy of the eastern greater Cairo (Gebel Mokattam-Helwan) area: Middle East Res. Centre, Ain Shams Univ., Sci. Res. Series, 5, 1-39 [ Links ]

