


Serviços Personalizados
Journal
Artigo
 Inglês (pdf)
 Artigo em XML
 Referências do artigo
 Enviar este artigo por email
Indicadores
-
 Citado por SciELO
 -
 Acessos
Links relacionados
-
 Citado por Google
 -
 Similares em
SciELO
Similares em
SciELO -
 Similares em Google
Compartilhar

 Permalink
Earth Sciences Research Journal
versão impressa ISSN 1794-6190
Earth Sci. Res. J. v.14 n.2 Bogotá jul./dez. 2010
Contribution of topographic and penetrometric measurements to a site characterization, case of the Kekem Landslide, National Road N°5 (Western Cameroon)
Jean Jacques Nguimbous-Kouoh1,2 andEliezer Manguelle-Dicoum1,2
1 Department of Physics, Faculty of Science, University of Yaounde I, P.O. Box 812 Yaounde-Cameroon
2 Geotech-Consulting Cameroon, Office of Geophysical Studies and Services, P.O. Box 6052 Yaoundé-Cameroon E-mail: nguimbouskouoh@yahoo.fr
Record
Manuscript received: 20 -05- 2010 Accepted for publication: 30-11-2010
ABSTRACT
Atopographicalsurveyandadynamiccone penetrometertesting(DCPT)wereconductedoverthe Kekemlandslide area. The aim ofthe work was to unveil new topographic features ofthe site, and with the penetrometer soundings predict the depth of the potential rupture surface beneath the damaged area. The analysis of penetrometer data has led to the supposition that the fracturedsurface interface connectingthe basement andsediments has adepthofbetween 2.00 mand 12.20 m. The topographic data was used to determine the average slope percentage over the broken area. The slope percentage gives 33.66% from a point taken over the tearing niche and a point along the road. 2D contours map drawn with the Surfer software, over an area of 35 hectares has enabled the observation of a step gradient oriented NNE-SSW. Considering the steepness ofthe slope and the thickness ofthe sediments, the site remains dangerous for the populations especiallyduringthe rainyseason.
Keywords: Landslide, national road N°5, kekem, topographic, penetrometer test
RESUMEN
Se hicieron un levantamiento topográfico y un ensayo con penetrómetro dinámico de cono (DCPT) sobre el área de deslizamiento Kekem. El propósito del trabajo es conocer nuevos rasgos topográficas del sitio, y con el penetrómetro predecir la profundidad a la que está la potencial superficie de ruptura debajo del área afectada. El análisis de los datos provistos por el penetrómetro ha permitido predecir que la interfaz de superficie fracturada entre el basamento y los sedimentos está a una profundidad entre 2,00 y 12,20 m. Los datos topográficos permitieron determinar la pendiente media de la zona fracturada. Medida entre un punto en la zona de desgarre y un punto a lo largo de la vía, la pendiente porcentual es de 33,66%. Líneas de contorno 2D dibujadas en el mapa con el programa Surfer, sobre una superficie de 35 hectáreas ha permitido observar un empinado gradiente orientado en dirección NNE-SSW. Tomando en cuenta la empinadapendienteyelespesorde lossedimentos,elsitiosiguesiendo peligroso paralapoblación,especialmentedurante la estación lluviosa.
Palabras clave: deslizamiento de tierra, carretera nacional No. 5, Kekem, topográficos, prueba de penetrómetro
Introduction
Landslides triggered by the geology, faults or rainfalls are mostly generated in mountainous landscapes. Some of these landslides occur suddenly and flow for miles at high speeds. They may pose serious threats to life and property (Larsen et al., 2000; Agliardi et al., 2001). Landslides often take place when a swaying occurs at the fracture interface between superficial sediments and stronger bedrock. This generally results to a complete change of scenery for years or millennia (Beven, 1981; Iverson, 2000). To study the Kekem landslide zone the common subsurface geophysical methods for determining the depth ofthe basement top were not used because of the unfavorable environment for electrical and electrostatic methods. The slope is very rugged and electrical low tension cable disturbances nearby. We present here, the newtopographic features and the results obtained using a dynamic cone penetrometer test which provides a lively alternative to conventional non destructive reconnaissance methods. This process borrowed from geotechnical studies is often used in geophysics to determine the depth of bedrock, when near the surface (Iverson andMajor, 1987; Le Noble andMartinaud, 2003; Marmeta etal., 2006). To illustrate how the two techniques can be combined on the field, a case study was conducted over the Kekem landslide site
Geographical and geological setting
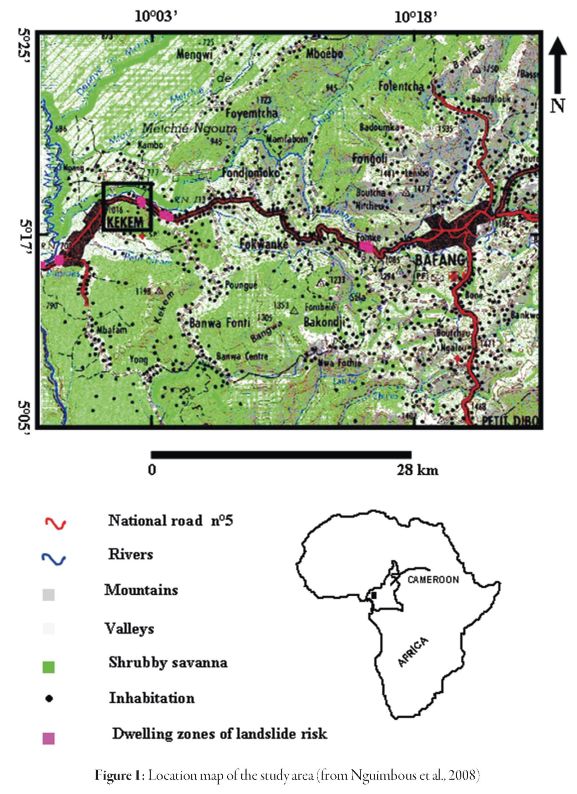
The study area is located in the western region of Cameroon, between latitudes 5°05' and 5°25' North and longitudes 9°55' and 10°26' East (Figure 1). The local climate is tropical with prolonged rainy seasons from April to November. The region is heavily populated because of its economic and agricultural potentials. Geologically, the region is located in the Central African orogenic belt characterized by gneiss, which is of Proterozoic age. The local structural orientation is NNE-SSW. The outcrops in the region are in the form of isolated slabs or rocks (Kwekam, 1993; Talla, 1995; Nguiessi et al., 1997).
The study area (Figure 1) belongs to the mountainous range that borders the Mbos plain. Mostofthe hillsides ofthe mainmountain terrain reached their equilibrium profile since the Tertiary and Quaternary age (Belnoun etal., 2008). However, their dismantling by erosion, agriculture and road works remain locallyveryactive.
The materials able to slip are varied. They belong either to the bedrock or to the superficial formations which recover it (Talla, 1995; Nguiessi etal., 1997; Nguimbous et al., 2008). The rocks of the bedrock in the sector are granite-gneissic and largely metamorphosed. The shallow formations are inconsistent and are more susceptible to the rupture in the presence of groundwater, notably horizons rich in clayey minerals. The shallow formations were implemented at the rhythm of geological processes (erosion, weathering, and volcanism) of Cretaceous and Tertiary bedrock and cover the different sides with a thick deposit more or less stable.
Equipment and methodology
To cover the entire study area, we used a laser tachometer (TC 805 L) to measure the various parameters (vertical angles, horizontal and vertical drop, etc.) This equipment is made up of a long range laser (greater than 500 m) to compute inaccessiblepoints with an accuracy of ± 3 mm (variable depending on the support quality). The site was set with a base station and secondary stations materialized by the pillars along the road and within the resident lands. The secondary stations were often used as references. They were uplifted at the beginning and at the end of the trial and led to the lift orientation and precision of successive surveys. The points were not selected according to a regular grid but according to the relief irregularities along the perpendicular and parallel lines of the hillside. A total of 397 study points were obtained including 35 penetrometer sounding points. To measure the thickness and depth of different underground layers in several points on the site, the Dynamic Cone Penetrometer (DL010) was used. The trial test consisted to sink into the soil the stem with a cone containing a free fall mass. The stem that has at its end a cone of 20 mm in diameter sinks by dropping a hammer on its anvil. The drop height (575 mm) and the masses of the hammer (4.6 and 8 kg) are normalized according to ASTM D6951-03.
We also used a GPS for the measurement of geographical coordinates, a compass for orientation and positioning, walkie-talkies for communication and a digital camera to save and catalog the event.
Presentation of the landslide and disaster area
In October 20, 2007, after three days of intense rainfall, a landslide occurred at the entrance to the town of Kekem along National Road No5 (Figure 2). The mixture constituting multiple tons of massive materials literally slipped; destroying road, houses, plantations and killing two people.
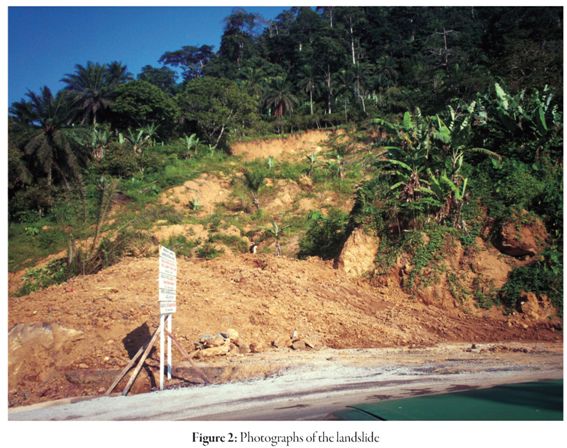
The data obtained by direct measurements on the site were used to estimate the average height of the scratched mountain (1200 m), the average height of the road from the site relative to the sea level (723 m) and average distance between the hill and houses (4 m). The affected area corresponds to a displacement of soft soil and rock along a fracture surface (Figure 2). This earth flow occurred on a relatively steep slope, the front mass was found at 272 m from the tearing niche, stripping the soil to a depth of about 4 m. The overall movement is oriented N10 ° E dipping south. The deposits were displaced to less than 5 m from the Ngoum River, the main river of the region. The width of the stripped area varies between 18 and 55 m from the foundation of the tearing niche to the base of the material deposits. The volume of material moved is estimated to about 30.000 cubic meters. The soil profile observed at the dislocation surface reveals three different lithological levels namely: an upper horizon made up of litter and humus with thickness of about 5 centimeters, an intermediate horizon, black in colour and about 60 centimeters thick, and a lower brown, silty clay horizon that extends to the underlying bedrock (Nguimbous etal., 2008).
Results and discussion
Analysis of the topographic maps
The description of a topographic map is generally intended to characterize the main aspects of the relief (Varnes, 1976; Quido and Vojtech, 1982). These main aspects can be observed on the contour maps or digital elevation models (Tucker and Whipple, 2002, Glenn et al., 2006; Tarolli and Tarboton, 2006, Eeckhaut etal., 2007). To realize the maps for this study, data were processed with the Covadis (2007) software which is an applicative of topography, cartography, and earthwork. The software was used for the topometric calculations and generation of the Cartesian coordinate points of the study area. These coordinates were then entered into the Surfer (2009) software for interpolation and production of contour maps and the digital elevation model (DEM). The longitudinal profile over the slipped area was generated using the Covadis (2007) software.
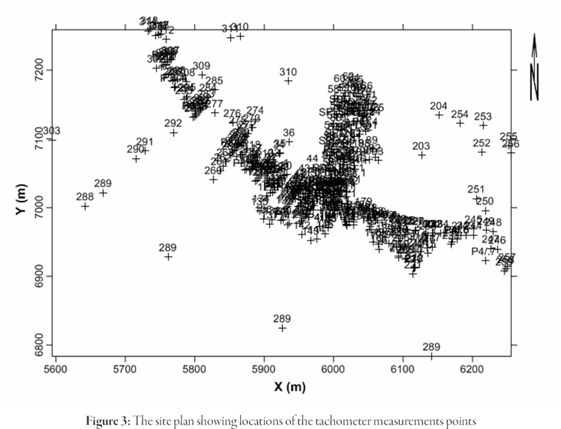
• The map in Figure 3 presents the site plan of the field measurement points. The points were densified at the collapsed area to better define and simulate the phenomenon.
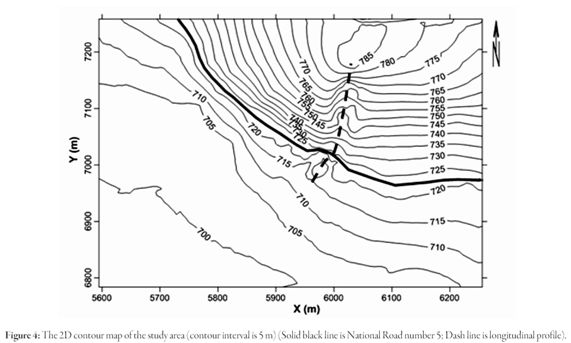
• The 2D contour map (Figure 4) shows the distribution of altitudes in meters along the study area. The contour lines reveal a steep gradient oriented NNE-SSW, corresponding to a high escarpment of the slope. The shape of the contour lines also implies a convex slope, which is indeed remarkable in the field. The slope is gentle at the beginning but becomes increasingly steep as soon as one goes up.
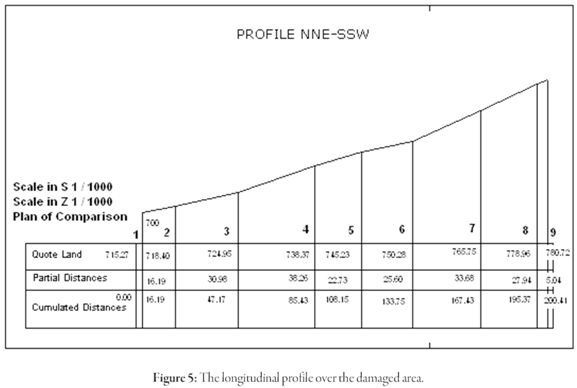
• The longitudinal profile (Figure 5) over the damaged area provides an image of the topographic slope and a probable dip of geological formations and structures of the study area when going from top to bottom. From this profile, the quote lands distribution varies approximately between 780.72 and 715.27 m for a cumulative distance of about 200.41 m along the slope.
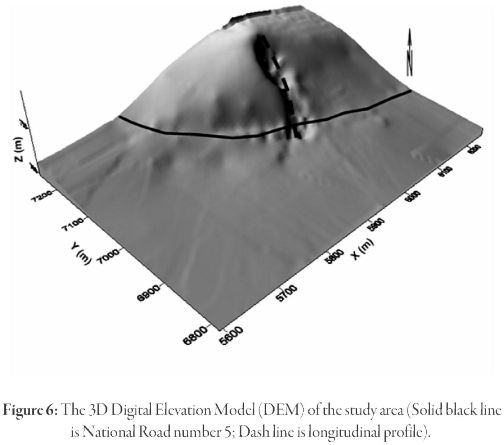
• Figure 6 shows the digital elevation model (DEM) of the study area reconstructed after topographic data interpolation. It clearly shows the notch which represents the kind of landslide. Apart from the notch, the morphology of the study area appears to be homogeneous, implying a geology that remained relatively constant over time and space.
The data interpretation with the Covadis (2007) software was used to estimate the surface area covered by the study at 35 hectares, the perimeter of the area covered by the study at 1200 meters, the slipped surface area at 1.08 hectares and perimeter of 578 meters, the maximum height above the tearing niche to be 804 meters and the slope percentage over the damaged area at 35.18% for a horizontal distance of201.04 m and a vertical distance of70.73 m
between a point taken over the tearing niche and a point along the road (Nguimbous et al., 2008). Similarly, the exploitation of the 2D contour map (Figure 4) of the study area obtained with the Surfer (2009) software agreed with similar characteristics. The slope increases up with a step gradient (Figure 4). To analytically calculate the slope, we considered that there are several well-known methods for doing so (Monkhouse and Wilkinson, 1971; Denegre, 1973). The points DCPT32 (x2 y2, z2) and DCPT5 (x1, y1, z1) (Table 1) located respectively at the highest point of the tearing niche and along the road were selected. A rapid altimetric and planitmetric calculation gave (Denegre, 1973):
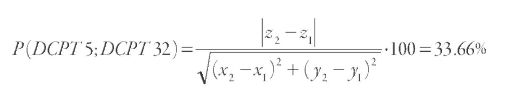
This slope is relatively similar to that obtained by Nguimbous etal. (2008).
In order to obtain the map (Figure 4) and the digital elevation model (Figure 6) the kriging method was used. The interpolation procedure gave for 397 introduced points, 395 active data. The semi-variogram components obtained are of linear type and the variogram slope give one. The proportion of anisotropy gives one and null angle. The (X, Y) coordinate interpolation grid gave, for values of X ranging between 5594.610 and 6255.829 m and those of Y ranging between 6783.676 and 7258.493 m, 133 lines and 96 m columns for an interpolation interval of 5 m. The grids were retained after several tests. The tightening or large interpolation interval introduces distortions on the vicinity of the points. The interpolation radius gave 407 m. The (X, Y, Z) coordinates were automatically converted into metric distance by UTM projection on the Clarke 1880 ellipsoid reference. Table 2 shows the statistical characteristics that enable the realisation of the digital elevation model (DEM) and the 2D contour map.
Analysis of table and penetrometer sounding maps
Topographic data are increasingly being combined with geotechnical data used in geophysics to determine the exact depth of basement roof (Le Noble andMartinaud, 2003; Falornietal., 2005; FrankelandDolan, 2007). Two types of information were expected from penetrometer tests performed over the Kekem landslide area. That is, the height of the bedrock roof and the thickness of the sedimentary layer. The heights of the sounding were leveled with the tachometer and are correct and accurate. Thirty-five dynamic cone penetrometer testing (DCPT) were made (Nguimbous etal., 2008). The results are presented in the form of maps and a table containing the depths of diverse layers beneath the slipped zone.
Table 1 highlights the Cartesian coordinates of various (DCPT) soundings. The points were identified in altimetry and planimetry. In general, the heights are irregular and ranging between 766.32 and 717.76 meters, which gives a drop of48.56 meters between the highest point and lowest point where the measurements were made

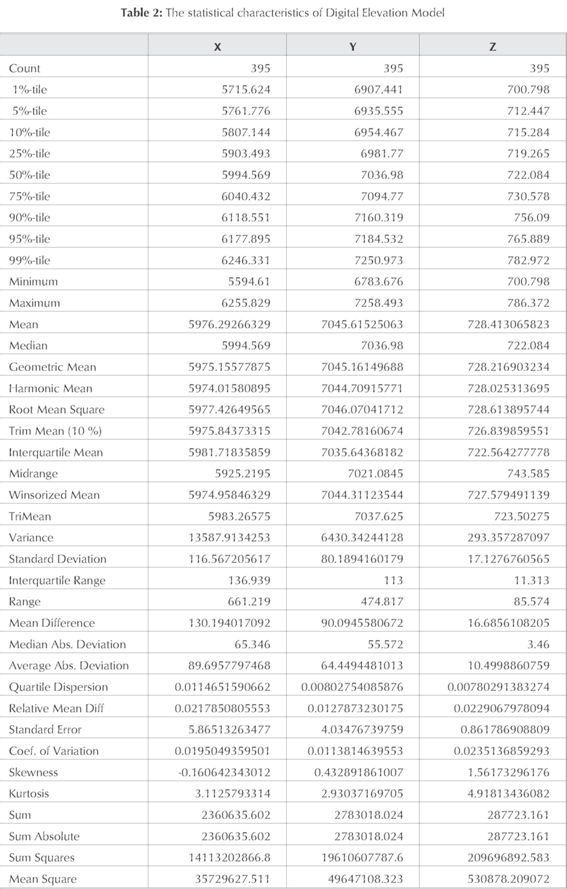
Table 1 equally presents the DCPT points with different depths at which the penetrometer reached. The depths are discontinuous on the entire site. The thickness of sediments was between 2.00 m and 12.20 m. The deepest sounding was obtained in DCPT9 coordinates (5985.99 m; 7015.01 m; 12.20 m).
Table 1 also shows the basement roof elevations obtained by the difference between the actual heights of the penetrometer soundings and sediment thickness acquired at different points. Overall, the elevations are
asymmetrical and vary between 761.35 and708.41 m, which give adrop of 52.94 m between the highest and lowest point ofmeasurement.
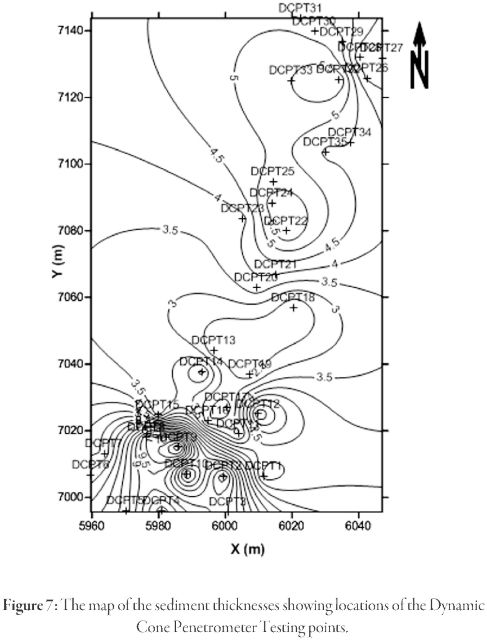
The map of the sediment thicknesses (Figure 7) shows location of the penetrometric testing points. Its shows areas where greater sedimentary deposits thicknesses can be observe along the site. The overall sedimentary layer thickness is less important at the center of the slipped zone; it is higher at the foot of the mountain and decreases with altitude. This model-building sedimentary deposit may be correlated to the Kenyan Shurmai site (Kuehn and Adovasio, 1999).
Topographic maps of the slipped area (Figure 8a and 8b) have the same morphological features. This implies that the sediments were deposited gradually as the configuration of the basement. These maps also show that topography is irregular through out the site.
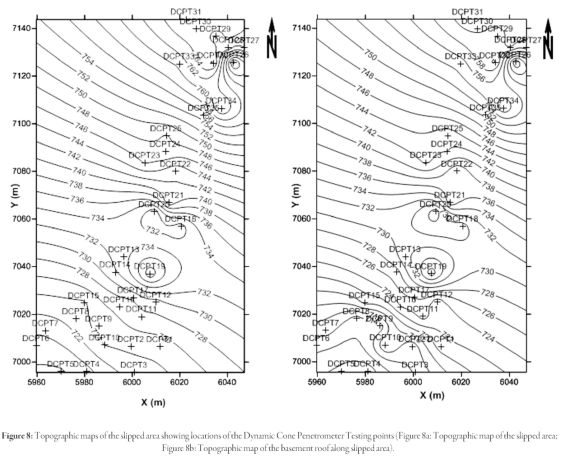
The maps (Figures 7 and 8), were obtained by the same interpolation and with the same variogram model and anisotropic coefficient like Figure 4 and 6. For 35 introduced points we obtained 35 active data and 86 m interpolation radius. The (X, Y) grid interpolation gave, for values of X ranging between 5959.690 and 6047.003 m and those of Y ranging between 6995.620 and 7143.781 m, 59 lines and 100 columns for interpolation interval of 1.50 m. The grids were tested on several occasions. For a smaller or larger interpolation interval the signal witnessed distortions.
The maximum depth of the basement/rupture surface varied between 2.00 and 12.20 m. These values are compatible with the supposed depths of the sediment-basement surface reached in the other risky sites (Figure 1); particularly in Marche Moume, Petit Nkam and Famke respectively locatedabout2, 5 and28 kmfromthestudyarea(Nguimbousetal., 2008).
The study ofKekem landslide using two techniques led to the actual site characterization. This approach is comparable to conventional approaches in geophysics (Brunsden and Prior, 1984; Crozier, 1986).
Conclusion
This study, combined with the observations carried out on the field conveys evidence of the terrains fragility, the slopes steepness and the great thickness of the sediments. The risk of catastrophe for the road and the populations remains imminent; given their proximityto the site. On the other hand,thecombineduseofthetachometerandthedynamicconepenetrometer proved a simple and effective employment vis-a-vis ofthe particular problem of the site. The fluid blending of the two techniques and the data appreciably increases theproductivityofthegeophysicistin achievementofvarious tasks of precisionmeasurementofthebasementinareaswhereitisnearerto thesurface. This approach should be validated in other sites where the relief is not very broken and the basement nearer to the surface. The method authorizes a total flexibility on the field and a successful data-gathering. The productivity of a great number ofgeophysics applications is thus largelyimproved.
References
ASTM D6951-03. (2009). Standard test method for use of the Dynamic Cone Penetrometer in shallowpavement. [ Links ]
Agliardi, F., Crosta, G. and Zanchi, A. (2001). Structural constraints on deep-seated slope deformation kinematics. Engineering Geology, 59: 83-102. [ Links ]
Belnoun, N.R.N., Tchouankoué J.P., Koller F. and Thoni M. (2008). Petrology, mineralogy, and geochemistry of Kekem mafic complex, western Cameroon. Geophysical Research, 10: 1607-7962. [ Links ]
Beven, K. (1981). Kinematic subsurface stormflow. Water Resources Research, 17: 1419-1424. [ Links ]
Brunsden, D. and Prior, D.B. (1984). Slope Instability. Wiley, Chichester 12: 102-110. [ Links ]
Covadis, Version 7.0. (2007). Topography, cartography, and earthwork software developed by Autodesk, dedicated to the Geometricians, Companies and Engineers. [ Links ]
Crozier, M.J. (1986). Landslides: Causes, Consequences, and Environment. Croom Helm, London, 59pp. [ Links ]
Denegre, J. (1973). Développements récents de l'automatisation appliquée aux cartes topographiques àmoyenne échelle. International Yearbook of Cartography, 13: 81-89. [ Links ]
Eeckhaut, V.D. M., Poesen, J., Verstraeten, G., Vanacker, V., Nyssen, J., Moeyersons, J. and van Beek, L.P.H. (2007). Use of LIDAR-derived images for mapping old landslides under forest. Earth Surface Processes and Landforms, 32: 754-769. [ Links ]
Falorni, G., Teles,V., Vivoni,E.R.,Bras,R.L. andAmaratunga, K.S. (2005). Analysis and characterization of the vertical accuracy of digital elevation models from the Shuttle Radar Topography Mission. Journal of Geophysical Research-Earth Surface, 110: 230-239. [ Links ]
Frankel, K.L. and Dolan, J.F. (2007). Characterizing arid region alluvial fan surface roughness with airborne laser swath mapping digital topographic data. Journal of Geophysical Research, 112: 124-135. [ Links ]
Glenn, N.F., Streutker, D.R., Chadwick, D.J., Tahckray, G.D. and Dorsch, S.J. (2006). Analysis of LIDAR-derived topography information for characterizing and differentiatingl and slide morphology and activity.Geomorphology, 73: 131-148. [ Links ]
Iverson,R.M.,and J.J. Major.(1987). Rainfall, ground water flow, and seas on al motion at Minor Creek land slide, northwestern California: Physical interpretation of empirical relations, Geol. Soc. Am. Bull., 99, 579-594. [ Links ]
Iverson R.M. (2000). Landslide triggering by rain infiltration. Water Resources Research, 36: 1897-1910. [ Links ]
Kuehn and Adovasio, (1999). Stratigraphyand noncultural site formation at Shurmai rockshelter (GnJm1) in the Mukogodo Hills in the north-Central Kenya. Geoarchaeology, 14: 63-85. [ Links ]
Kwekam M. (1993). Le massif plutonique calco-alcalin de Fomopéa (Ouest-Cameroun) : Cadre Structural, Pétrologie, Géochimie, Interprétation géodynamique. Thèse de Doctorat troisième cycle, Université de Yaounde I, 154pp. [ Links ]
Larsen, M. C., Conde, V.M. T. and Clark, R. A. (2000). Landslide hazards associated with flash-floods, with examples from the December, 1999 disaster in Venezuela, in coping with Flash Floods, edited by E. Gruntfest andJ. Handmer, NATO ASI Ser, 236pp. [ Links ]
Le Noble A. andMartinaud M. (2003). Apport du pénétromètre àla connaissance d'un site préhistorique. Cas de l'abri Diepkloff, province du Cap, Afrique du Sud. Revue d'archéométrie, 27pp. [ Links ]
Marmeta., Faycal, R., Yu Jun, C.C., Tabbagha, A.B. and Charlerya, Y. (2006). Correlations between geotechnicalandelectrical data: A case studyat Garchyin France. Journal of Applied Geophysics, 60: 165-178. [ Links ]
Monkhouse, F.J. and Wilkinson, H.R. (1971). Maps and Diagrams;their compilation and construction, Gradient and Slope. Londres, Methuen & Co. Ltd, 3:129-165. [ Links ]
Nguiessi, C., Nzenti, J.P., Nkonguin, N.E., Tempier, P. and Tchoua, F. (1997). Les granitoides calco-alcalins, syn-cisaillement de Bandja dans la chaine panafricaine nord équatoriale au Cameroun. C. R. Acad. Sci. Paris, Sciences de la Terre et des planètes, 325:95-101. [ Links ]
Nguimbous, K. J.J. Epada J. and Manguelle, D.E. (2008). Rapport de l'étude topographique sur le glissement de terrain de la route nationale n° 5 à Kekem. Pour le Labogenie, 100pp. [ Links ]
Quido, Z. and Vojtech, M. (1982). Landslides and their control. Elsevier Scientific Publishing CompanyAmsterdam. 56pp. [ Links ]
Surfer(R) Version 9.0. (2009). Contouring and 3D Surface Mapping for Scientist and Engineers. Golden Software, Inc., Colorado, U.S.A. [ Links ]
Talla, V. (1995). Le massif granitique panafricain de Batié (Ouest-Cameroun) : Pétrologie, Pétrostructurale, Géochimie. Thèse de Doctorat troisième cycle, Université de Yaoundé I.128pp. [ Links ]
Tarolli, P. andTarboton, D.G. (2006). Anewmethodfor determination of most likely land slide initiation points and the evaluation of digital terrain model scale in terrain stability mapping. Hydrology and Earth System Sciences, 10: 663-677. [ Links ]
Tucker, G. E. and Whipple, K.X. (2002). Topographic outcomes predicted by stream erosion models: Sensitivity analysis and intermodel comparison. J. Geophys. Res, 107: 2170-2179. [ Links ]
Varnes, D. J. (1976). Slope movement types and processes. National Academy of Sciences, Spec, Report 36pp. [ Links ]
Acknowledgments
The authors thank the reviewers for their comments and suggestions which enabled to improve the initial version ofthe manuscript.

