


Servicios Personalizados
Revista
Articulo
 Inglés (pdf)
 Articulo en XML
 Referencias del artículo
 Enviar articulo por email
Indicadores
-
 Citado por SciELO
 -
 Accesos
Links relacionados
-
 Citado por Google
 -
 Similares en
SciELO
Similares en
SciELO -
 Similares en Google
Compartir

 Permalink
Earth Sciences Research Journal
versión impresa ISSN 1794-6190
Earth Sci. Res. J. v.15 n.1 Bogotá ene./jun. 2011
An appraisal of the geologic structure beneath the Ikogosi warm spring in south-western Nigeria using integrated surface geophysical methods
Ojo, J. S.1; Olorunfemi, M. O.2; and Falebita, D. E.3
1 Department of Applied Geophysics, Federal University of Technology, Akure, Nigeria; E-mail: profjsojo@yahoo.com
2 Department of Geology, Obafemi Awolowo University, Ile-Ife, Nigeria; 2348037192169, E-mail: mlorunfe@yahoo.co.uk
3 Department of Geology, Obafemi Awolowo University, Ile-Ife, Nigeria; 2347032987836, E-mail: delefale@oauife.edu.ng; deleebenezer@yahoo.com
Record
Manuscript received: 10/11/2010 Accepted for publication: 05/06/2011
ABSTRACT
An integrated surface geophysical investigation involving resistivity and magnetic methods was carried out in the immediate vicinityof the Ikogosi warm spring situated in south-western Nigeria with a viewto delineating its subsurface geological sequence and evaluating the structural setting beneath the warm spring. Total field magnetic measurements and vertical electrical sounding (VES) data were acquired along five N-S traverses. Magnetic and VES data interpretation involved inverse modelling. The inverse magnetic models delineated fractured quartzite/faulted areas within fresh massive quartzite at varying depths and beneath all traverses. The geoelectrical sections developed from VES interpretation results also delineated a subsurface sequence consisting ofa topsoil/weathered layer, fresh quartzite, fractured/faulted quartzite and fresh quartzite bedrock. It was deduced that the fractured/faulted quartzite may have acted as conduit for the movement ofwarm groundwater from profound depths to the surface while the spring outlet was located on a geological interface (lineament).
Keywords: magnetic, resistivity, warm spring, Ikogosi, Nigeria.
RESUMEN
Una investigación geofísica de superficie a partir de métodos resistivos y magnéticos fue realizada en las inmediaciones de fuentes termales de Ikogosi en el suroeste de Nigeria, para delimitar la secuencia geológica y evaluar la estructura por debajo de fuentes termales. Las mediciones de campo magnético total y los Sondeos Eléctricos Verticales (SEV)se tomaron a lo largo de cinco líneas transversas en dirección N-S. Se incluyó una modelación inversa en la interpretación de los datos magnéticos y resistivos (SEV). Los modelos magnéticos inversos identificaron áreas de cuarcita fracturada y fallada dentro de cuarcitas masivas frescas a diferentes profundidades por debajo de todas las transversas. Las secciones geoeléctricas se desarrollaron a partir de la interpretación de SEVs, que también identificaron una secuencia de suelo/capa meteorizada, cuarcita fresca, cuarcita fracturada yunos estratos de cuarcita poco alterada. Se concluyo que la cuarcita fracturada pudo actuar como conducto para el flujo de las aguas subterráneas cálidas desde grandes profundidades a la superficie, mientras que la fuente de salida fue localizada en una interfaz geológica (lineamiento).
Palabras clave: magnético, resistividad, fuentes termales, Ikogosi, Nigeria
Introduction
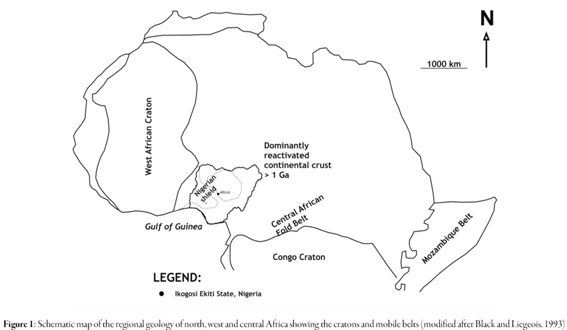
The Ikogosi warm spring is located in Ikogosi, south-western Nigeria (Figurei). The spring is a low enthalpy system, its temperature being around 36 oC (Oladipo et al, 2005). The geothermal system discharges a virtually constant volume of water all year round. It is a popular national tourist attraction. Previous studies of the warm spring have been limited to geological and geochemical investigations (Adegbuyi et al, 1996 and Ajayi et al, 1996). The current article therefore attempts to characterize the subsurface geological layers and structures beneath this geothermal system using integrated electrical and magnetic methods.
basement complex rocks can be classified (Rahaman, 1976, 1988) into the following major groups:
(i) migmatite gneiss-quartzite complex;
(ii) slightly migmatised to non-migmatised metasedimentary and metaigneous rocks; and
(iii) members of the older granite suite.
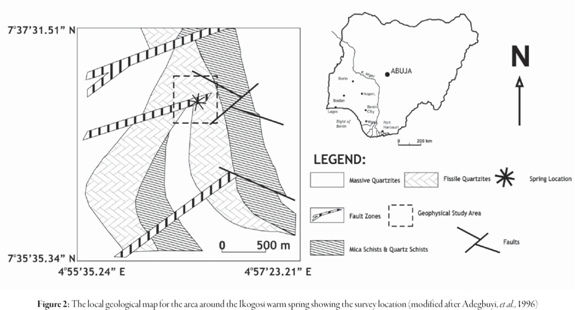
The study area is underlain by a group of slightly migmatised to non-migmatised para-schists and meta-igneous rocks. This group contains rocks which have been previously described as being younger or newer metasediments: the Effon Psammite formation and the associated epidiorite schist and amphibolite complex. The Effon Psammite formation (Hubbard et al., 1966; De Swardt, 1953; Dempster, 1967; Caby and Boesse, 2001) comprises quartzites, quartz schists and granulites which occur largely east of Ilesha and run for nearly 180 km in a NNE-SSW direction. There are three varieties of quartzite in the study area (Fig. 2); these include massive quartzite, fissile quartzite and mica schist/quartz schist. Geological features such as faults and shear zones are concealed; however fractures can be identified on a few outcrops along river valleys and on hill tops/slopes. The study area consists of rugged terrain with undulating hills and thick vegetation. The topographical elevation determined from topographic map varies from less than 473 m in the valleys to 549 m on the hills.
Experimental methods
The geophysical investigation was carried out within the warm spring's immediate catchment area; it involved using electrical resistivity and magnetic methods. The electrical resistivity method involved using the vertical electrical sounding (VES) technique while horizontal profiling was adopted for the magnetic method. Five N-S traverses were established, ranging in length from 500 to 600 m. The traverses' orientation was approximately normal to the suspected E-W-trending regional fault (Figure 2); traverse-traverse separation was 100 m.
The magnetic method
The magnetic method measures variations in the Earth's magnetic field caused by changes in the subsurface's geological structure or by differences in near-surface rocks' magnetic properties. When a magnetic field is applied to a material it responds by becoming magnetised (M); such magnetisation is a measurement of magnetic moment per unit volume of material. The field applied to the material is called the applied field (H) and is the total field that would be present if the field were applied to a vacuum. This applied field (H)is related to magnetic induction (B) which is the total flux of magnetic field lines through a cross-sectional area of the material, considering both lines of force from the applied field and from the material's magnetisation. B, Hand Mare related by equation (1) in S.I. units.
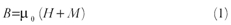
The constant µ0 is the permeability of free space (4π x 10-7 Hm-1) which is the ratio of B/H measured in a vacuum. Magnetic susceptibility (ê) is another important parameter demonstrating the type of magnetic material and the strength of that type of magnetic effect, such as magnetic permeability µ.
The relationship between magnetic induction B, magnetising force H and susceptibility k, as given by Reynolds (Reynolds, 1997), is:
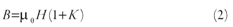
where B is in tesla, µ0 is free space permeability, H is given in amperes/metres and κ is dimensionless in SI units.
Magnetic measurement in the survey area
The magnetic measurements in the survey area were made with a GSM-8 Proton Precession magnetometer; the equipment measures the Earth's total magnetic field in gamma (nanotesla). Magnetic profiling was carried out along the five traverses at 10 m intervals to achieve better resolution of near-surface geological features, such as faults and fracture zones; 234 magnetic stations
were occupied. The observed magnetic field data was corrected for diurnal variations and offset by subtracting base station regional magnetic field from magnetic field measurements taken along the traverse at synchronised times.
The corrected magnetic data were used for preparing the residual magnetic
Magnetic measurement in the survey area
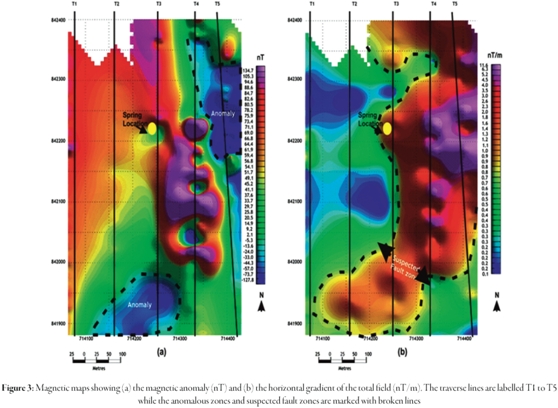
The magnetic measurements in the survey area were made with a GSM-8 Proton Precession magnetometer; the equipment measures the Earth's total magnetic field in gamma (nanotesla). Magnetic profiling was carried out along map (Figure 3a). A low-pass filter was subsequently applied to the data-set to remove the high frequency near-surface noise effect. A horizontal gradient map (Figure 3b) was produced from the filtered magnetic data. A horizontal gradient is a two-component vector, having magnitude and direction. The gradient is normally calculated as the root-sum-square of magnetic anomaly data x- and y- derivative components (Hansen et al, 2005). The method requires the magnetic field's two first order horizontal derivatives. If T(x,y) is the magnetic field and the field's horizontal derivatives are (∂T/ dxand ∂T/ ∂y), then horizontal gradient Z (x, y) is given by the equation:
Producing a horizontal gradient magnetic map is a data enhancement and edge detection technique, enhancing magnetic anomalies associated with faults and other structural discontinuities (Hood and Teskey, 1989; Aboud et al, 2005). Lyatsky et al, (1992) and Thurston and Brown (1994) have provided a detailed discussion ofhorizontal gradient computation methods.
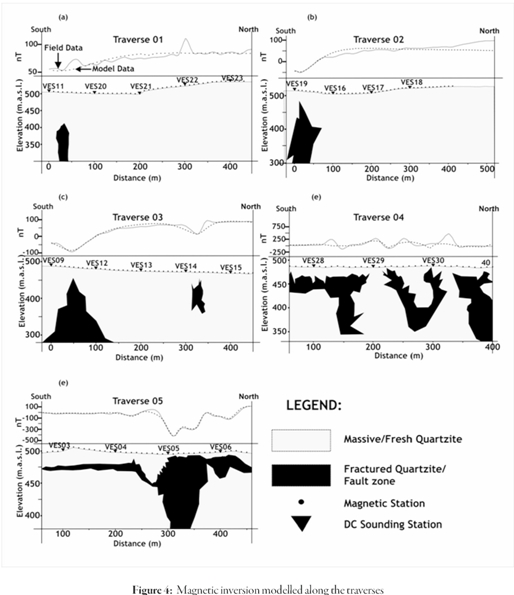
Low/negative magnetic peak profiles represent typical anomalous signatures in low-latitude magnetic regions (around the equator where Nigeria is located) (Parasnis, 1986; Fieberg, 2002). Correlating these 'lows' from profile-to-profile may delineate a fault line/fault zone or magnetic mineral-bearing fault zone. The magnetic data along all the profiles (T1 - T5) was quantitatively interpreted by a technique involving 2.5-D inversion using WinGLink software (2004 version). Several models were tried until a geologically plausible magnetic inversion model was achieved and an approximately fitting model was adopted, having 0.0008 x 10- SI susceptibility for quartzite host rock and 1.9576 x 10⁻⁴ SI susceptibility for the anomalous zone; Figure 4 shows the interpretation models. Since quartzites are metamorphic rocks having relatively low magnetic susceptibility, magnetic anomalies were assumed to have resulted from magnetic materials contained within the fractured quartzite/faulted zones relative to the fresh massive quartzite bedrock.
The electrical method
The electrical resistivity method involves determining subsurface resistivity distribution by taking ground surface measurements. This involves passing electrical current (I) into the ground by means of two electrodes; potential difference (ΔV) is measured between another pair of potential electrodes. What is actually measured, either in the laboratory or the field, is apparent resistivity given by the following equation:
where pais apparent resistivity and G is the geometric factor taking the electrode array's geometric spread into account.
The vertical electrical sounding (VES) technique (Zonge et al, 2005) was adopted in the present study; it involves the Schlumberger array, this being one of the most commonly used array systems which is mainly used for resistivity sounding in a layered environment where it provides excellent vertical resolution. Electrode array investigation depth is 0.125AB (where AB is total current electrode separation) (Roy and Apparao, 1971). The Schlumberger array uses a four-electrode system, two current electrodes (C1 and C2) and two potential electrodes (P1 and P2). Apparent resistivity (ña) values were calculated from the following equation:
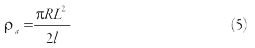
where R is ground resistance, L is half current-electrode spacing (AB/2), I is half the potential-electrode spacing and 3 is a constant (3.142 or 22/7)
Electrical measurements in the survey area
Twenty-two vertical electrical soundings (VES) were taken within the study area. A resistivity meter (ABEM Terrameter, SAS 300C) was used for taking resistivity measurements. Most VES stations were located at 100 m intervals along the traverses used for taking the magnetic measurements (Fig. 3), except where topography was inhibited. The station interval was required to achieve good spatial distribution and aid accurate preparation of the subsurface's geological sequence. The Schlumberger array was gradually expanded regarding a fixed centre, electrode spacing (AB/2) varying from 1 to 225 m and having 450 m maximum spread length. VES data are presented as curves of apparent resistivity against AB/2 (Figure. 5).
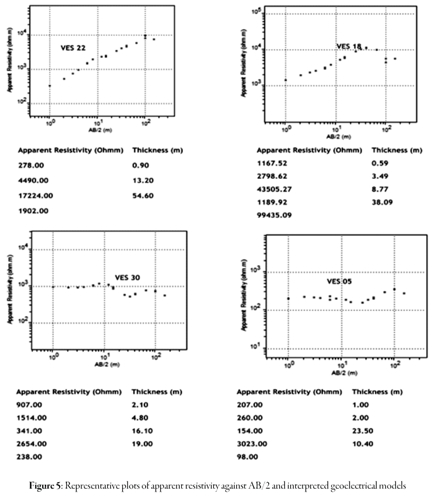
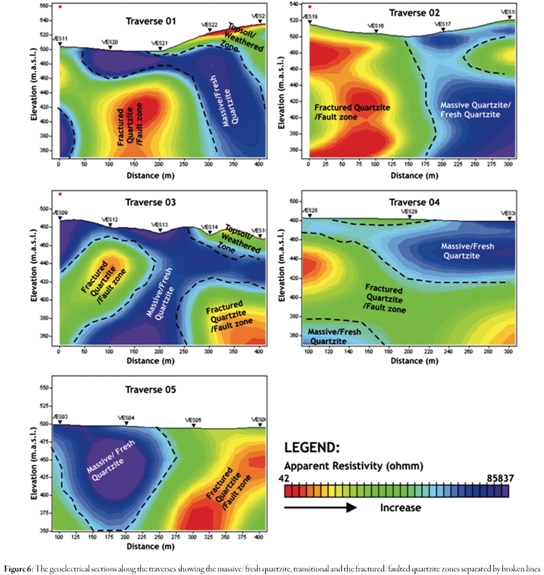
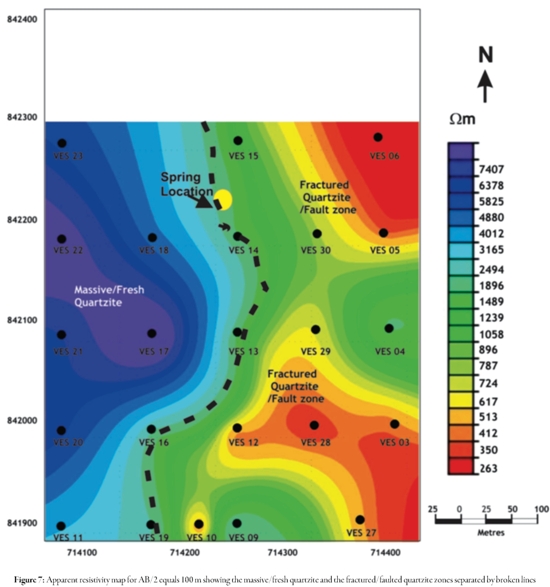
The observed apparent resistivity data were inverted to a true geological model (Figure 5) of the subsurface using WingLink software. The inversion technique finds a resistivity model which approximates measured data within the limit of data errors and is in agreement with an area's known geology (Matias et al, 1994). VES results' interpretation was used for producing the geoelectric sections (Fig. 6); a resistivity map (Fig. 7) was drawn for 100 m (AB/2) electrode spacing.
Results and Discussion
The magnetic survey
Figure 3 shows the magnetic anomaly and total field computed horizontal gradient maps. Two anomalous zones were delineated at the southern part of the survey area, across T2 and T3 and on the north-eastern part, across T4 and T5 (Figure 3a). Magnetic anomaly amplitude for these two identified anomalous zones ranged between -5.3 and -127.8 nT. The horizontal gradient map (Figure 3b) partitioned the survey area into two broad anomalous zones.
The western flankwas characterised by relatively low amplitude (0.1 nT/m-0.7 nT/m) while the eastern flank had relatively high amplitude, ranging from 0.7 nT/m-11.6 nT/m. The area having high horizontal gradients correlated to intensely fractured/faulted quartzite block (Figure 4), having an approximately north-easterly trend. The width of the block varied from 150 m to greater than 290 m. The spring outlet was located at the interface between the low and high horizontal gradient zones. The inverse magnetic models (Figure 4) identified fractured quartzite/faulted zones at depths of about 100 m below T1, 40 m below T2,45 m below T3, especially around the spring location, andless than 30 m below T4 and T5.
The resistivity survey VES data
The typical VES curves and interpreted geoelectric models are displayed in Figure 5. The geoelectrical sections (Figure 6) delineated four subsurface layers composed of topsoil/weatheredlayers, fresh quartzite, fractured/faulted quartzite and the fresh quartzite bedrock. The topsoil/weathered material was composed of silt, clayey sand and sand; its thickness ranged between 0.3 and 25.3 m while resistivity ranged from 57 to 4,245 Ωm. This horizon rested on a
variably thick (0.9-67.8 m) first fresh quartzitic basement, resistivity ranging from 1,702-15,960 Ωm. This fresh quartzite acted as confining layer above fractured quartzite in several places, resistivity ranging from 80 to 2,720 Ωm.The fractured quartzite constituted the main aquifer unit, having sub-artesian/artesian characteristics. Its delineated thicknesses varied from 38.1 to 189.2 m. This aquifer unit had large storage capacity, having been delineated beneath all the VES stations. Fresh quartzite constituted the bedrock and had 4,969-99,43 5 Ωm resistivity. The depth to the top of the fresh quartzite ranged from 50.9 to 227.7 m.
Apparent resistivity map
Figure 7 is an apparent resistivity map produced from the VES data for 100 m half current-electrode separation (AB/2). The map displays high resistivity (2,494-7,407 ?m) (typical of fresh massive quartzite) on the western flank and relatively low resistivity (263-1,896 ?m) (characteristic of fractured quartzite) on the eastern flank. The spring outlet was located at the interface between both zones. Map relief was similar to that of the horizontal magnetic gradient map (Figure 3b) where the area having a relatively low horizontal gradient correlated with the high resistivity area and the area having relatively high gradient correlated with the low resistivity area. The interface between the lowand high horizontal gradients on the magnetic map significantly correlated with the interface between the high and low resistivity area on the resistivity map (compare Figures. 3b and 7).
Conclusions
Magnetic and verticalelectricalsounding data have been usedto studythe structures beneath the Ikogosi warm spring located in Ekiti State, south-western Nigeria. The magnetic data identified the fractured quartzite/faulted zone as a result of the magnetic minerals containedin itwhile thesubsurfaceareas weredelineateddueto variationsinresistivityvalues related to the degree of fracturing and quartzite saturation. The low resistivity areas corresponded to the fractured quartzite/faulted zone delineated by magnetic inversion. It was suspected that the fractured/faulted quartzite may have acted as conduits for the movement of warm groundwater from profound depth to the surface while the spring outlet was located on a geological interface (lineament).
Acknowledgements
The authors wish to acknowledge Geotech Consultancy Services Ltd, Nigeria, for providing the data and appreciate the use of the WingLink software for this study.
References
Aboud, E., Goussev, S., Hassan, H., Supriyanto, S., and Ushijima, K., 2005. Horizontal gradientand band-pass filter of aero magnetic data image the subsurfac estructure; Example from Esh El Mellaha Area, Gulf of Suez, Egypt. Proceedings of the SEG/EGS/EPEX/EPA International Conference, Cairo 2005: Imaging the Future, May 16-19,2005. [ Links ]
Adegbuyi, O., O.S. Ajayi and I.B. Odeyemi, 1996: Prospects of hot-dry-rock (HDR) geothermal energy spectrophotoresource around the Ikogosi warm spring in Ekiti state, Nigeria. J. Renew. Energy, 4: 58-64. [ Links ]
Ajayi, O.S., O. Adegbuyi, I.P. Farai and T.R Ajayi, 1996. Determination of natural radionuclides in rocks ofthe Ikogosi Ekiti warm spring area, Ondo State, Nigeria. Nig. J. Sci., 30:15-21. [ Links ]
Black, R., Caby, R., Monssine Pouchkin, A., Bayer, R., Betrand, J.M., Boullier, A.M., Fabre, J. and Lesquer, A., 1979. Evidence for late Precambrian plate tectonics in West Africa. Nature, 278, 223-227. [ Links ]
Black, R., and Liegeois, J. P., (1993): Cratons, mobile belts, alkaline rocks and continental lithospheric mantle - the Pan-African testimony. Journal of the Geological Society, London, vol. 150, pp. 89 - 98. [ Links ]
Burke, K.C. and Dewey, J.F., 1972. Orogeny in Africa. In: Dessauvagie, T. F. J. and Whiteman, A.J; (eds); African Geology- University of Ibadan, 583-608. [ Links ]
Caby, R., Bertrand, J.M. and Black, R., 1981. Pan-African closure and continental collision in the Hoggar-Iforas segment central Sahara. In: Kroner A. (ed) Precambrian Plate Tectonics, Elsevier, Amsterdam 407-434. [ Links ]
Caby, R. and Boesse J.M., 2001. Pan-African Nappe system in south west Nigeria; the Ife-Ilesha schist belt. Journal ofAfrican Earth Sciences 33 (2), 211-225. [ Links ]
Dempter, A. N., 1967: Geol. Surv. Nigeria 1 :250,000 Sheet 61, Akure [ Links ]
De Swardt, A.M.J., 1953. The geology of the country around Ilesha. Geol. Surv. Nigeria. Bulletin; No. 28, 54. [ Links ]
Fieberg, F. C., (2002): Ground magnetic investigations for gold prospecting in south-western Nigeria. Presentation given at the 62nd Meeting of the German Geophysical Socieity, Hannover. [ Links ]
Hansen,R. O., Louis Racic and Grauch, V.J.S., 2005: Magnetic method sinnear-surface geophysics. In: D. K. Butler (ed) Near Surface Geophysics. Society of Exploration Geophysics, Tulsa Oklahoma, 151-175. [ Links ]
Hood, P.J. and Teskey, D.J., 1989, Aeromagnetic gradiometer program of the Geological Society of Canada. Geophysics, 54,1012-1022. [ Links ]
Hubbard, F. H., Ogbukagu, I. K., A. M. J. De Swardt, A.M.J., Van Coppenhagen, J.D., 1966. The geological map of Ife-Ilesha area. Geological Survey of Nigeria. 1:250,000 series Iwo sheet 60. [ Links ]
Lyatsky, H.V., Thurston, J.B., Brown, R.J. and Lyatsky, V.B., 1992, Hydrocarbon-exploration applications of potential-field horizontal-gradient maps. Canadian Society of Exploration Geophysicists Recorder, 17(9), 10-15. [ Links ]
Matias, M. S., Macques da Silva M., Ferreira, P., and Ramallio, E., (1994): A geophysical and hydrogeological study of aquifers contamination by a landfill. J. Applied Geophysics 32: 155-162. [ Links ]
Oladipo, A. A., Oluyemi, E.A., Tubosun, I. A., Fasisi, M.K. and Ibitoye, F. I. (2005): Chemical examination ofIkogosi warm spring in south-western Nigeria. Journal of Applied Sciences 5 (1): 75-79, 2005 [ Links ]
Parasnis, D. S., (1986): Principles ofApplied Geophysics, Chapman Hall, London, pp. 43-44. [ Links ]
Rahaman, M.A.O., 1976. Review of the basement geology of south-western Nigeria. In Kogbe C.A (ed.), Geology of Nigeria, Elizabethian Publishing Co. Lagos; 41-58. [ Links ]
Rahaman, M.A.O., 1988. Recent advances in the study of the basement complex of Nigeria. In Oluyide, P.O, Mbonu, W.C, Ogezie, A.E, Egbuniwe, I.G, Ajibade, A.C. and Umeji, A.C. (eds.)Precambrian Geology of Nigeria;11-41. [ Links ]
Reynolds, J. M, 1997: An Introduction to Applied and Environmental Geophysics. John Wileyand Sons, England. pp 118-121. [ Links ]
Roy, A. and Apparao, A. 1971: Depth of investigation in direct current resistivity prospecting. Geophysics, vol. 36, pp. 943-959. [ Links ]
Thurston, J.B. and Brown, R.J., 1994, Automated source-edge location with a new variable pass-band horizontal-gradient operator. Geophysics, 59, 546-554. [ Links ]
Zonge, K., Wynn, J., and Urquhart, S., (2005): Resistivity, induced polarization and complex resistivity. In: Near Surface Geophysics, Butler, D. K (ed.). Society of Exploration Geophysics, pp 265-300. [ Links ]

