


Services on Demand
Journal
Article
 English (pdf)
 Article in xml format
 Article references
 Send this article by e-mail
Indicators
-
 Cited by SciELO
 -
 Access statistics
Related links
-
 Cited by Google
 -
 Similars in
SciELO
Similars in
SciELO -
 Similars in Google
Share

 Permalink
Earth Sciences Research Journal
Print version ISSN 1794-6190
Earth Sci. Res. J. vol.16 no.1 Bogotá Jan./June 2012
Geophysical exploration of disseminated and stockwork deposits associated with plutonic intrusive rock: a case study on the eastern flank of Colombia's western cordillera
Orlando Hernández Pardo, Gretta C. Alexander E. and Iraida M. Pintor B.
Geociences Department, Universidad Nacional de Colombia, Bogotá, Ciudad Universitaria, Edificio Manuel Ancizar, office 335, Telephone: 571 3165000 ext 16568, Fax 571 3165390. E-mail: ohernandezp@unal.edu.co; gcalexandere@unal.edu.co
Record
Manuscript received: 16/02/2012 Accepted for publications: 03/05/2012
ABSTRACT
Disseminated deposits are low-grade, large tonnage deposits which are mainly mined for gold, copper, molybdenum and tin. These deposits are normally associated with intermediate to acid plutonic intrusive rocks and all are characterized by intense, extensive hydrothermal alteration of host rocks Disseminated deposit exploration in the tropics suffers from difficult geological mapping due to dense vegetation, lack of rock outcrops and extensive but variable saprolytic weathering Geophysical exploration of these deposits normally includes magnetic, induced polarization and gamma ray spectrometry surveys. The largest RTP total magnetic field anomaly highs are usually associated with diorite porphyry intrusive bodies. Diorites are usually less magnetic than basaltic rocks; thus when magnetic anomaly highs are related to intrusions they can be explained by basic metals' intensive mineralization (including magnetite) associated with porphyry intrusions Magnetic anomaly gradients regularly help delineate local discontinuities which can be interpreted as local faults and joints that can be mineralized. Gamma ray spectrometry is useful for determining anomalous potassium, uranium and thorium concentration as it can map alteration halos and linear discontinuities Statistical analysis of the data also can determine the intermediate intrusive / extrusive nature of porphyry intrusions Gamma ray spectrometry can help to determine elemental potassium concentration, regardless of the associated potassium mineral species, thereby enabling alteration mapping in a geological setting related to volcanic-associated massive sulphide base metal and gold deposits An induced polarization survey is useful in outlining disseminated sulphide distribution in porphyry deposits related to chargeability anomaly highs. The results of the Quinchia project's geophysical exploration program are discussed.
Keywords: disseminated deposit, stockwork, magnetic exploration, gamma ray spectrometry, induced polarization, western Andes, Colombia
RESUMEN
Los depósitos de sulfuros diseminados son depósitos de bajo tenor y alto tonelaje, los cuales son importantes fuentes en la explotación de oro, cobre, molibdeno y zinc. Estos depósitos están asociados a rocas plutónicas intermedias a acidas y se caracterizan por una intensa y extensa alteración de la roca huésped o encajante. La exploración de estos depósitos en las zonas tropicales presenta una gran dificultad debido a la densa vegetación, escasez de afloramientos y alteración saprolitica variable. La exploración geofísica de los depósitos de sulfuros diseminados, por lo general incluye la aplicación de los métodos de magnetometria, polarización inducida y espectrografia de rayos gamma Las anomalias positivas magnéticas, reducidas al polo, más intensas usualmente están asociadas a la presencia de cuerpos intrusivos porfiriticos de dioritas. Estos cuerpos dioriticos son por lo general menos magnéticos que las rocas basálticas que intruyen, por lo tanto, cuando las anomalias magnéticas positivas están asociadas a las intrusiones se debe a la intensa mineralización de metales básicos (incluyendo magnetita) asociada con las intrusiones Los gradientes de las anomalias magnéticas permiten delinear discontinuidades locales las cuales son interpretadas como fallas locales y diaclasas que pueden estar mineralizadas La espectrografia de rayos gamma es útil para determinar anomalias en la concentración de potasio, uranio y torio permitiendo la delimitación y mapeo de halos de alteración y detección de discontinuidades lineales El análisis estadistico de los datos de rayos gamma también permite determinar la naturaleza intrusiva o extrusiva de las intrusiones La espectrografia de rayos gamma permite determinar la concentración de potasio sin implicar la presencia de minerales de potasio, permitiendo el mapeo de las zonas de alteración en un ambiente geológico relacionado con sulfuros de metales bases y depósitos de oro asociados a sulfuros masivos volcánicos. El estudio de polarización inducida es útil para delimitar la distribución de sulfuros diseminados en los depósitos porfiriticos asociados a valores anómalos positivos de cargabilidad Los resultados del programa de exploración geofisica integrada del proyecto Quinchia son discutidos
Palabras claves: depósitos diseminados, estovercas, exploración magnética, espectrografia de rayos gamma, polarización inducida, Cordillera Occidental, Colombia
Introduction
Disseminated deposits are low-grade, large tonnage deposits which are mainly mined for gold, copper, molybdenum and tin (Evans, 1993; Ariosa, 1990). The ore minerals in these deposits are scattered throughout host rock as what is called disseminated mineralization or they are largely or wholly restricted to quartz veinlets forming a ramifying complex called stockwork; both forms of mineralization occur In many deposits Many alkaline and calc-alkaline porphyry Au-Cu deposits have extensive potassic hydrothermal alteration halos, varying both laterally and vertically, with changes in pressure, temperature, eH and pH during magmatic, hypogene and subsequent supergene processes (Wilson, 1986). A well established alteration-mineralization potassic zoning sequence may be evident within a single deposit, ranging from a central, orthoclase and/or biotite core, sericite as fracture-controlled and pervasive replacements, outwards through successive phyllic, sericitic, argillic and propylitic areas Although phyllic areas may contain less bulk potassium gain than potassic cores, their peripheral distribution usually offers much larger targets for gamma ray spectrometry detection A number of potassium anomalies are directly associated with intermediate intrusive bodies and their associated alteration systems within porphyry copper belts. Potassium anomalies' proximity to mineralization provides evidence of significant mineralizing event-associated fluid/rock interaction. Being able to map and quantify this potassium alteration has important implications for porphyry gold and copper exploration and mapping (Shives et al., 1997). The study area is located at the southern end of the mid-Cauca gold belt along the Romeral fault system in Colombia, north-western South America (Figure 1) Tertiary gold and cooper mineralised intrusive bodies have been mapped in this area Various Miocene intrusive centres have been identified (i.e. La Cumbre, Manzanillo and Dos Quebradas) holding gold and copper mineralization Additional targets have been identified from comprehensive ground geophysics, geochemical and field mapping programs (www.baterogold.com, 2012). This paper describes the application of an integrated geophysical exploration program based on contrasting magnetic susceptibility, charge-ability, electrical resistivity and Th, U and K concentration between the porphyry intrusions and host rocks. The results were useful for modelling mineralized bodies' 3D geometry and recommending a drilling program to estimate the mining project's gold and associated mineral reserves.
Ground geophysical survey
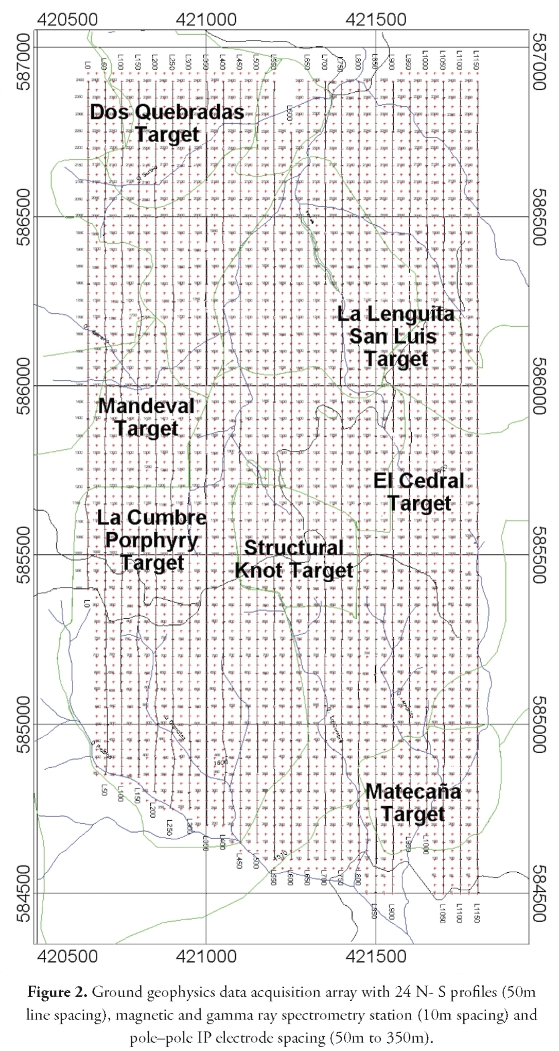
The Quinchia Project is located about 190 kilometres WNW of the Colombian capital, Bogotá, at the southern end of the mid-Cauca gold belt (Figure 1), within 100 kilometres of two world-class gold deposits: Marmato (20 km N) having 12.4 million ounces of gold at a 0. 3g/t cut-off and La Colosa (100 km S) having 16 27 million ounces of gold at 0 3g/t cut-off (Pintor, 2011; www.baterogold.com, 2012). This belt also hosts other gold and copper porphyry deposits, including Titiribi, La Mina and Quebradona Compared to the projects noted above, Quinchia has been the least explored in the mid-Cauca gold belt. The Quinchia concessions cover 1,407 hectares. Three Miocene intrusive centres (La Cumbre, El Centro and Dos Quebradas) have been identified as having a north-south trend and strike extension of around three kilometres at 1,600 and 1,950 meters above sea-level. These centres all host gold and copper mineralization. All mineralised areas identified to date form part of a large, regional mineralizing system covering more than 300 hectares La Cumbre porphyry is a high-priority area, which continues to be open at depth to the north-northwest and south-southeast. Significant elevated gold mineralization from near surface and at depth is present in La Cumbre porphyry A geophysical exploration program was carried out along 24 northsouth profiles having different lengths (2.4 km predominant length), 50m line spacing and 10m station spacing for gamma ray spectrometry and magnetic and polepole array for an induced polarization survey (Angoran and Madden, 1977; Bleil, 1953: Ward, 1990: Ward et al., 1995) with 50m dipole spacing for a total of 57.6 km. The survey covered a 2.4 Km long by 1.2 km wide area (2.88 km2) (Figure 2)
Gamma ray spectrometry
5,417 stations were acquired using a Pico Envirotec PGIS21 spectrometer. The gamma ray spectrometric results were represented by four maps: total count (Figure 3a), potassium (Figure 3b), equivalent uranium (Figure 3c) and equivalent thorium (Figure 3d) to present the four primary measured variables Four additional maps were produced to represent derived products eTh/K (Figure 4a), eU/eTh (Figure 4b), eU/K (Figure 4c) ratios and ternary K-eU-eTh ratio (Figure 4d; Keary & Brooks 1992; Lowrie, 2007; Telford et al , 1994) Oasis Montaj mapping software was used for data processing (Geosoft, 2010)
Magnetic survey
Magnetic readings were taken every 10 meters with two (base station and rover) Scintrex ENVI proton precession magnetometers. The current International Geomagnetic Reference Field model (IGRF2011) parameters for the study area were F=31822.5 nT total magnetic field, I=+30.47° inclination an D=-5.28° declination. Magnetic rover and base data was processed in a number of steps (Keary & Brooks 1992; Lowrie, 2007; Telford et al , 1994; Merrill, 2010) Diurnal variation was removed from the raw magnetic data thereby obtaining a total magnetic field intensity map. The regional total magnetic field intensity map was obtained by data interpolation of the IGRF11 values. Total magnetic field anomaly map (TFMA) values were obtained by subtracting regional IGRF TFMI from TFMI (Figure 5a) A reduction-to-the-pole (RTP) filter was applied thereby obtaining the RTP total magnetic field anomaly map (Cooper and Cowan, 2005; Figure 5b) to simplify magnetic anomaly dipolar asymmetry regarding survey area magnetic inclination and declination. Other frequency domain filters were applied to the total magnetic field intensity map including analytic signal (Figure 5c) Only the longer wavelength components were taken for modelling magnetic sources from the surface to hundreds of meters depth Euler 3D depth solutions were obtained by calculating the first derivative in X, Y and Z and their fast Fourier transforms (FFT) to obtain point data solutions for structural indexes for sphere and barrel causative bodies. The database was represented as proportional symbols for depth solutions (Figure 5d).
Induced polarization
The IP survey was carried out by taking readings every 50 meters, using pole-pole (2-array) electrode configuration, with a plotting point at mid-distance between moving electrodes C1 and P1; successive "a" 50m, 100m, 150m, 200m, 250m, 300m and 350m spacing was used to measure chargeability and electrical resistivity. The transmitter was an IRIS VIP4000, a 220V-60Hz motor generator energising field with direct current (time-domain) with 2" pulse duration, a maximum available 3,000 volts tension and applied current up to 3A true intensity. The receiver wasn an IRIS ELREC PRO with 1mV resolution. Polepole time domain-induced polarization chargeability and resistivity data was interpreted regarding the ore deposit model to indicate possible alteration areas associated with porphyry style copper and gold mineralization Chargeability and resistivity data were 3D modelled and displayed in a series of chargeability and resistivity maps at 310m, 260m, 210m, 170m, 100m, 50m and 20m depth.
Discussion
The total count map (Figure 3a) showed three areas A, B and C, where areas A and C were interpreted as geophysical units associated with the recognition of alteration related to intrusive bodies located in topographic highs which were partially outcropping and had been differentially weathered while area B was interpreted as the intrusive bodies' host rock located in topographic lows Some linear patterns were recognized, inferring the presence of geological discontinuities or local faults. The K map (Figure 3b) shows the same three areas A, B and C observed on the total count map indicating the dominance of K in the radioactive elements. The spatial distribution of K was interpreted as K-alteration related to intermediate intrusive rocks close to the surface. The areas of intense K-feldspar enrichment were less directly associated with porphyry gold and copper mineralization than sericitic and chloritic alteration; potassium anomalies' proximity to mineralization provided evidence of significant fluid/rock interaction associated with mineralization Areas A and C were interpreted as potassium alteration providing powerful exploration guidance for locating mineralised areas The uranium map (eU; ppm; Figure 3c) shows several high frequency local anomalies peripheral to the potassium anomalies and related to numerous small discontinuities which could be associated with mineralized veins. This pattern suggested that the uranium moved laterally away from the hydrothermal centre of the system Some linear patterns were recognized, inferring the presence of geological discontinuities or local faults orientated NE-SW, NW-SE and N-S. The thorium map (eTh; ppm; Figure 3d) shows several high frequency local anomalies similar to those recognized on the uranium map, inferring the presence of geological discontinuities or local faults orientated NE-SW, NW-SE and N-S As thorium enrichment does not usually accompany potassium during hydrothermal alteration, the eTh/K ratio map provided an excellent distinction between potassium associated with alteration and anomalies related to normal lithological variations (Figure 4a). This important correlation of low eTh/K ratio with alteration was evident in porphyry gold and copper belts. The eTh/K map ratio showed the characteristic lows interpreted as alteration associated with mineralization produced by potassium, this being clearly differentiated from normal lithology. The potassium alteration was more intensive in shear hosted gold deposits. The strong potassium anomaly was characterized by less than 2.5 x 10⁻⁴ eTh/K ratio values. Unaltered lithologies typically reflect the normal K and Th crustal abundance ratio (5 x 10⁻⁴). Thorium does not usually accompany potassium during potassium alteration; however, the resulting low eTh/K ratio thus enabled distinguishing potassium anomalies having exploration significance from those solely related to lithological variations. Uranium enrichment, evident on the eU/eTh ratio map, was peripheral to the potassium anomaly and related to numerous small pitchblende veins (Figure 4b) Such mineralization may have shown that uranium moved laterally away from the system's hydrothermal centre. Local discontinuities infer an intensive fracture system that has affected intrusive intermediate porphyry intrusions. Uranium enrichment, evident on the eU/Kx10-4 ratio map, was peripheral to the potassium anomaly and related to mineralized veins (Figure 4c). This mineralization may have shown that uranium moved laterally away from the system's hydrothermal centre Local discontinuities infer an intensive fracture system that has affected the intrusive intermediate porphyry intrusions. The ternary K-eU-eTh radioelement map (Figure 4d) was a K-eU-eTh ternary colour presentation which is useful in outlining the areal extent of the potassium alteration but ambiguous for interpreting local discontinuities
A ground magnetic survey is useful for modelling the surface and hidden geology associated with Eocene gold and cooper mineralised intrusive bodies and related mineralization and structural features affecting them. Magnetic data has been useful for detecting magnetic susceptibility contrast among Diorites, basalts, pyroclastic rocks, breccias, mineralised areas and halos of alteration thereby helping to define drill targets together with the results of radiometry and induced polarization surveys. The extreme maximum and minimum values were related to cultural anomalies TFMA highs (~1000 nT) were concentrated in the southern region. Interpreting magnetic field data at low magnetic latitudes is difficult because the vector nature of the magnetic field increases the complexity of anomalies from magnetic rocks Magnetic data is reduced to the magnetic pole to simplify the observed anomalies. The RTP total magnetic field anomaly map (RTP-TFMA) (Figure 5b) showed that the largest magnetic anomaly highs were located in the southern region of the study area, in La Cumbre and Matecaña sectors having values ranging from 1600 nT to 2000 nT. These anomalies were attributed to diorite porphyry intrusive bodies which are intensively mineralised Intermediate anomaly highs, having values greater than 2000nT, were observed in the central region in Mandeval, la Lenguita and el Cedral. These anomalies were attributed to diorite porphyry intrusive bodies that seemed to be smaller in size than those from La Cumbre and Matecaña anomaly areas but could be more mineralised, as inferred from their higher amplitudes. The smallest magnetic anomaly highs were located in the northern region in Dos Quebradas and San Luis, having anomalies similar in size and amplitude regarding those from Mandeval, La Lenguita and el Cedral but more isolated, separated by anomaly lows RTP-TFMA magnetic anomalies gradients were interpreted as two local discontinuity systems orientated NE-SW and NW-SE. These discontinuities could be associated with local faults and joints affecting the intrusive bodies. The TFMI map's vertical integration analytic signal (MacLeod et al., 2004; Figure 5c) showed that 3-D analytic signal amplitude produced maxima over magnetic contacts regardless of the direction of magnetisation. The absence of magnetization direction in the shape of analytic signal anomalies was a particularly attractive characteristic for interpreting magnetic field data near the magnetic equator. Although analytic signal amplitude was dependent on magnetization strength and the direction of geological strike regarding the magnetization vector, this dependency was easier to deal with when interpreting analytic signal amplitude than original total field data or pole reduced magnetic field. Euler 3D deconvolution processing was applied to automatically locate and determine depth for gridded RTP total magnetic field anomalies. The Euler depth solutions were obtained by calculating the first derivative of the RTP TFMA in X, Y and Z directions and applying the fast Fourier transform to estimate the depth location of the bodies causing local RTP TFMA anomalies. The point data solutions were mainly from 0m to 170m in depth. These depth solutions were represented by proportional symbols (Figure 5d) showing that the main mineralised areas were located from the surface to the first 170 m depth (32m to 50m depth). Shallow depth solutions from 0m to 30m-50m could be associated with the weatheredfresh rock interface.
The chargeability maps at 310m (M310; Figure 6a), 260m (M260; Figure 7a), 210m (M210; Figure 8a), 170m (M170; Figure 9a), 100m (M100; Figure 10a), 50m (M50; Figure 11a) and 20m depth (M20; Figure 12a) showed several chargeability anomaly highs located within the Cumbre, Matecaña, Mandeval-La Lenguita, el Cedral, San Luis and Dos Quebradas target areas, respectively. These chargeability anomaly highs were related to sulphur mineralization of diorite porphyry intrusions. The resistivity maps at 310m (R310; Figure 6b), 260m (R260; Figure 7b), 210m (R210; Figure 8b), 170m (R170; Figure 9b), 100m (R100; Figure 10b), 50m (R50; Figure 11b) and 20m depth (R20; Figure 12b) showed several resistivity highs associated with diorite rocks without significant mineralization while resistivity lows were related to sulphur mineralization of diorite porphyry intrusions and mineralised fracture areas with intensive alteration. The induced polarization survey was useful in outlining sulphide distribution in porphyry deposits related to chargeability anomaly highs. The survey identified few major chargeability highs and few discontinuities at depths from 170m to 310m and several small chargeability highs and several discontinuities at depths from 20m to 100m depth. These chargeability highs and discontinuities suggested that diorite porphyry intrusion had been intensively fractured and sulphur mineralization had been emplaced throughout these fracture areas (Figure 13a, b) Interpreting inferred structural features was complex Most linear features did not coincide with 20m to 310m or the interpreted applied radiometry, magnetic and IP methods However, the interpreted linear features showed that intrusive bodies and host rocks had been intensively fractured, allowing the flow of mineralized solutions. These linear features' vertical and horizontal offset also suggested that most of them were dipping at high angles Only a few of these linear features seemed to be vertical. The 3D target distribution inferred a 3D model of intensively fractured porphyry rocks which were also intensively altered at shallow depths from the surface to 20m and 50m depth (Figure 14) Chargeability anomalies were locally coincident with mapped diorite porphyry rocks at La Cumbre, Matecaña, La Lenguita, el Cedral, Mandeval, San Luis and Dos Quebradas and were also coincident with gold soil geochemical anomalies at La Cumbre and were proximal to electrical resistivity lows Interpreting the geophysical data was based on discussions regarding Quinchia geology; mineralization models including both sulphides and magnetite (chargeable) could have been associated with Cu and Au mineralization and the presence of Cu and Au mineralization between 170m and 300m inferred a possible characteristic geophysical response for alteration and mineralization consisting of a moderate resistivity / resistivity low, coincident with moderate chargeability high / edge of a chargeability high (Brett, 2007; Figure 15).
Conclusions
Gamma ray spectrometry has been useful in determining the anomalous potassium, uranium and thorium concentration interpreted as alteration halos and linear discontinuities, associated with intermediate intrusive / extrusive rocks (Dickson and Scott, 1997). The total counts, K, Th/ Kx10-4, U/Kx10-4 and ternary K-U-Th maps clearly showed areas A and C, located in the south and northwest, respectively, as being the most prospective areas. The U, Th, and U/Th maps revealed linear gradients which were interpreted as local discontinuities associated with local fault and/or joint systems orientated NE SW and N-S, which were also prospective for basic and precious metals
Depth estimates of the bodies causing magnetic anomalies showed that the main mineralized areas were located from the surface to the first 170 m depth (32m to 50m depth average mean value)
Targets were identified on all induced polarization maps, with priority target areas identified for immediate drilling to test and develop the exploration model. These targets included deeper and shallower chargeable areas, having apparent line-to-line continuity. The highest priority targets were interpreted to conform to an idealized model for sulphide or magnetite associated alteration areas which might be associated with gold mineralization and are recommended for follow-up via drilling Further geophysical, geological and geochemical data integration work and model development is recommended to expand the Quinchia mining project's potential. The induced polarization survey has also been useful in outlining sulphide distribution in porphyry deposits related to resistivity anomaly lows. The induced polarization survey identified few major resistivity lows and few discontinuities at depths from 170m to 310m and several small resistivity lows and several discontinuities at depths from 20m to 100m depth. These resistivity lows and discontinuities suggested that the diorite porphyry intrusion has been intensively mineralized and altered throughout these fracture areas. The chargeability anomaly highs and resistivity anomaly lows that were outlined at each depth solution map were spatially superimposed and inversely correlated. The chargeability highs had values ranging from 35 mV/V and exceptionally up to 170mV/V to 75mV/V against a background of 20 mV/V related to intermediate to high grade sulphur mineralization. The highest mean chargeability values and most associated mineralized areas were located at 170m depth The resistivity lows had values from 7 ohm-m to 300 ohm-m related to sulphur mineralization and altered igneous rocks It was concluded that about 40% of the studied area covered by the induced polarization survey had the potential to host porphyry style alteration areas and sulphide areas which might be mineralized with base and precious metals in the porphyry intrusion of La Cumbre, Matecaña, la Lenguita, el Cedral, Mandeval, San Luis and Dos Quebradas. The 3D target distribution inferred a 3D model of intensively fractured porphyry rocks which were also intensively altered at shallow depths from the surface to 20m and 50m depth It should be noted that the chargeability anomalies had moderate to high intensity (up to 170mV/V against a background of 30mV/V) and were interpreted here to be consistent with the intermediate sulphide concentrations typical of low-grade porphyry targets
Acknowledgements
Elements of this research were produced with support from Minera Quinchia SAS, TEP Ltda and the Universidad Nacional de Colombia's Geosciences Department's Geophysics Group We thank the anonymous reviewers for their comments, corrections and contributions
References
Angoran, Y, and Madden, T R, 1977, Induced polarization: a preliminary study of its chemical basis: Geophysics, 42, 788-803. [ Links ]
Ariosa, J. 1990. Curso de Yacimientos Minerales Metálicos, Editorial Pueblo y Educación. La Habana, Cuba, 306 p. [ Links ]
Bleil, D F, 1953, Induced polarization: a method of geophysical prospecting: Geophysics, 18, 636-661. [ Links ]
Brett, J S 2007 Report on the interpretation of induced polarization data, Kenville Gold Project, prepared for Anglo Swiss Resources, MHP Geophysical Interpretation Report, p 1-25. [ Links ]
Cooper, G. R.J. Cowan. R. D, 2005. Differential reduction to the pole. Computer & Geosciences, Elsevier 31 (2005) 989999. [ Links ]
Dickson B L and Scott K M 1997 Interpretation of aerial gamma-ray surveys adding the geochemical factors AGSO Journal of Australian Geology and Geophysics 17:187200 [ Links ]
Evans, A M 1993 Ore Geology and Industrial Minerals: An Introduction. Geosciences Texts, Blackwell Scientific Publications, 389 p. [ Links ]
Geosoft, 2010, Geosoft Oasis Montaj: Software for Earth Sciences Mapping and Processing (www.geosoft.com/) [ Links ]
Keary, P and Brooks, M 1992, An introduction to exploration geophysics, second edition, Blackwell series, London, 254 pp [ Links ]
Lowrie, W 2007 Fundamentals of Geophysics, second edition, Cambridge University Press, New York, USA [ Links ]
MacLeod, I N, Jones K, Ting Fan Dai, 2004 3-D Analytic Signal in the interpretation of Total Magnetic Field Data at Low Magnetic Latitudes Geosoft technical notes [ Links ]
Merrill, R. T. 2010. Our Magnetic Earth. The Science of Geomagnetism. The University of Chicago Press. 261 p. [ Links ]
Pintor, B. I. M., 2011. Exploración geofísica integrada de los pórfidos auriferos del Sector de La Cumbre, Municipio de Quinchia, Risaralda, Colombia Tesis MSc en Ciencias - Geologia, Universidad Nacional de Colombia. [ Links ]
Shives, R. B. K., B. W. Charbonneau, Ken L. Ford, 1997. The detection of potassic alteration by gamma ray spectrometry - recognition of alteration related to mineralization, Radiation Geophysics Section, Mineral Resources Division Geological Survey of Canada [ Links ]
Telford, W. M., Geldarty, L.P., Sheriff, R.E., 1994, Applied Geophysics. Second edition, Cambridge University Press, New York, 770 pp [ Links ]
Ward, S H, 1990, Resistivity and induced polarization methods, in Ward, S H,, Geotechnical and environmental geophysics: Volume I, Review and tutorial, Soc Explor Geophys, 147-190 [ Links ]
Ward S H, Sternberg B K, LaBrecque D J, and Poulton M M, 1995, Recommendations for IP research: The Leading Edge, April 1995, 243-247 [ Links ]
Wilson, M 1989, Igneous petrology, Winchester, Unwyn Hyman, 466 pp (www.baterogold.com, 2012) [ Links ]

