


Serviços Personalizados
Journal
Artigo
 Inglês (pdf)
 Artigo em XML
 Referências do artigo
 Enviar este artigo por email
Indicadores
-
 Citado por SciELO
 -
 Acessos
Links relacionados
-
 Citado por Google
 -
 Similares em
SciELO
Similares em
SciELO -
 Similares em Google
Compartilhar

 Permalink
Earth Sciences Research Journal
versão impressa ISSN 1794-6190
Earth Sci. Res. J. v.16 n.1 Bogotá jan./jun. 2012
Analysis of aeromagnetic data over Wamba and its adjoining areas in north-central Nigeria
G. K. Anudu1, 5*, L. N. Onuba2, 5, A. G. Onwuemesi3 and A. E. Ikpokonte4
1 Department of Geology and Mining, Nasarawa State University, PMB 1022 Keffi, Nasarawa State Nigeria
2 Department of Geology, Anambra State University, PMB 01Uli, Anambra State Nigeria
3 Department of Geological Sciences, Nnamdi Azikiwe University, Awka Anambra State Nigeria
4 Department of Geology, Ahmadu Bello University, Zaria, Kaduna State Nigeria
5 Department of Geology and Petroleum Geology, University of Aberdeen AB24 3UE, United Kingdom
* Corresponding author. E-mail: anudugoodluck@yahoo.co.uk; goodluck.anudu@abdn.ac.uk
Record
Manuscript received: 11/07/2011
Accepted for publications: 29/05/2012
ABSTRACT
An aeromagnetic intensity contour map of Wamba was acquired, digitised and analysed. The study was aimed at mapping metalliferous mineral deposits in basement rocks, delineating structural lineaments and their trends as well as estimating the depth to magnetic source bodies. Regional- residual separation was applied to a total aeromagnetic intensity contour map to produce a residual aeromagnetic intensity contour map. The rose diagram of the orientations or azimuth direction of the structural lineaments delineated on the maps depicted major trends being NE-SW, NW-SE and NNESSW (Pan-African trends) with minor NNW-SSE and E-W trends (pre-Pan-African trends). Depths to the magnetic source bodies were estimated using Peter's (half-slope) method, indicating two depth source models. The deeper sources ranged from 0.88km to 3.15km and had -32nT to -225nT magnetic intensity, whereas the shallower sources ranged from 0.23km to 0.76km and had -10nT to 20nT magnetic intensity. The deeper sources were most likely due to intra-basement basic intrusive bodies underlying the sediment-covered marginal areas of the Benue Trough. The sedimentary cover in the area was generally low and therefore not likely to favour hydrocarbon generation.
Keywords: Wamba, aeromagnetic, lineaments, magnetic source, Peter's method.
RESUMEN
Un mapa del contorno de la intensidad aeromagnética de Wamba fue adquirido, digitalizado y analizado. El estudio tuvo como objetivo mapear los depósitos minerales metalíferos en rocas basamentales, delinear las configuraciones estructurales y sus tendencias, así como estimar la profundidad a los cuerpos de la fuente magnética. La separación residual regional fue aplicada a un mapa del contorno de intensidad aeromagnética total para producir un mapa del contorno intensidad aeromagnética residual. El diagrama rosa de las orientaciones o la dirección del azimut de los lineamientos estructurales delineados sobre los mapas represento las principales tendencias come NE-SW, NW-SE y NNE-SSW (tendencias panafricanas), con menor tendencias NNW-SSE y EW (tendencias pre-panafricanas). Las profundidades a los cuerpos de la fuente magnética se calcularon a partir del método de Peter (método half-slope), lo que indica dos modelos sobre la profundidad de la fuente. Las fuentes más profundas oscilaron de 0,88 km hasta 3.15 km y tuvieron una intensidad magnética de 32nT hasta 225nT, mientras que las fuentes menos profundos oscilaron de 0,23 km hasta 0.76 km y tuvieron una intensidad magnética de -10nT hasta 20NT. Muy probablemente las fuentes más profundas fueron debido a los cuerpos intrusivos básicos intra-basamentales que subyacen a las zonas marginales cubiertos de sedimentos de la depresión de Benue. En general, la cubierta sedimentaria en la zona fue baja y, por lo tanto, no es probable que favorecen la generación de los hidrocarburos.
Palabras claves: Wamba, aeromagnético, lineamientos, fuente magnética, método de Peter.
Introduction
The magnetic method is one of the best geophysical techniques used for determining depth to magnetic source bodies (and possibly sediment thickness) and delineating subsurface structures. Large-scale aeromagnetic surveys have been used to locate faults, shear zones and fractures. Such zones may serve as potential hosts for a variety of minerals and may be used as guidance for exploration of the epigenetic, stress-related mineralisation in the surrounding rocks (Paterson and Reeves, 1985). Sediment thickness required for hydrocarbons (oil and/gas) to form or be generated varies from place to place. The minimum sediment thickness required for producing oil usually varies from 2km to 4km, compared to 3km to 7km for gas production/formation (Dow, 1978; Cornford, 1990; Gluyas and Swarbrick, 2005).
Aeromagnetic maps usually reflect variations in the earth's magnetic field resulting from the underlying rocks' magnetic properties (e.g. magnetic susceptibilities). Sedimentary rocks have the lowest magnetic susceptibility, whereas metamorphic and acidic igneous rocks intermediate and basic igneous rocks have the highest magnetic susceptibility (Kearey et al., 2002). The largest proportion of a magnetic signal or anomaly is thus generated at crystalline (igneous or metamorphic) basement level (GETECH, 2007). Magnetic anomalies are caused by magnetic minerals contained in rocks; such anomalies are usually caused by underlying basement (igneous and/or metamorphic) rocks or by igneous features such as intrusive plugs, dykes, sills, lava flows and volcanic centres when magnetic anomalies are observed over sedimentary terrain (Gunn, 1997). Nevertheless, high sensitivity measurements could also be associated with cultural iron contamination and authigenic alterations in sedimentary rocks, possibly caused by hydrocarbon migration (Costanzo-Alvarez et al., 2000; Aldana et al., 2003).
Several articles have been published on the Nigerian basement complex's structural and tectonic framework, based on analysing aeromagnetic data (Ajakaiye et al., 1986; Olasehinde et al., 1990). Ajakaiye et al., (1986) studied the Benue Trough's tectonic framework and that of parts of the adjoining Nigerian basement complex using aeromagnetic maps, delineating NE-SW and ENE-WSW directions as being the dominant aeromagnetic lineament trends. They stated that these aeromagnetic lineaments depicted a possible continental continuation of the four Atlantic fracture zones (St Paul's, Romanche, Chain and Charcot) abutting the West African coast into the Nigerian basement complex. According to Olasehinde et al., (1990), analysing aeromagnetic data over central Nigeria's basement complex has shown that the Nigerian basement complex's structural and tectonic framework comprises NE-SW and NW-SE lineaments superimposed over a dominant N-S trend. Overall NE-SW aeromagnetic lineaments of the Benue Trough and Atlantic fracture zones apparently signified an ancient zone of weakness in the Nigerian basement complex. According to Nur et al., (1994), depths to magnetic basement in the middle Benue Trough varied from 0.066km to 4.938km, whereas Onyedim et al., (2006) have stated depth values ranging from 0.11km to 5.5km.
The present study was focused on analysing and interpreting aeromagnetic data over Wamba and its adjoining areas. Its purpose was to map metalliferous mineral deposits in the basement rocks, delineate structural lineaments and their trends as well as to determine the depth to magnetic source bodies (and possibly sediment thickness) in the sedimentary part of the area. Such structural lineaments (i.e. fractures, faults, shear zones and veins) usually serve as potential hosts or migration paths for groundwater, hydrocarbons and minerals. Sediment thickness is very important in any sedimentary basin regarding to hydrocarbon formation.
The study showed the usefulness of aeromagnetic data in mapping metalliferous mineral deposits (especially iron ore having a high magnetite to haematite ratio), delineating structural lineaments and estimating sedimentary cover (sediment thickness) in Wamba and its adjoining areas. This study is novel as there has been no record regarding this aspect of research in the area.
The study area's location and geology
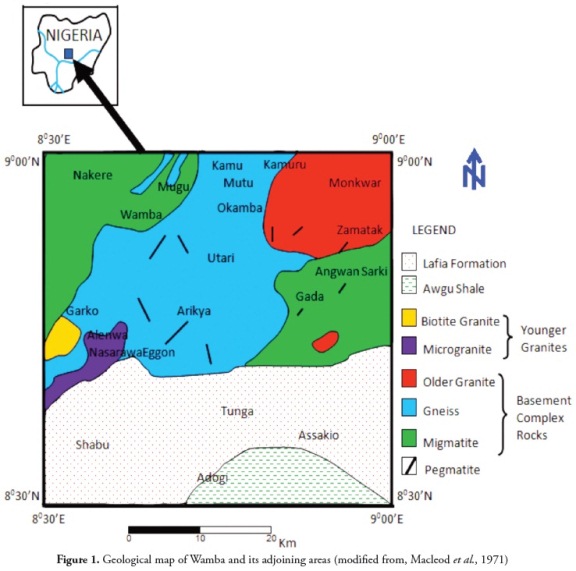
The study area is located in Nasarawa state, north-central Nigeria, covering Wamba, Nasarawa Eggon, Garko, Shabu, Adogi, Assakio, Tunga, Utani, Panda, Nakere, Ninkade, Angwa Madaki, Lange, Arikya, Kumuru, Zamatak and Monkwar. It is located between latitudes 8o 30'N and 9o 00'N, and longitudes 8o 30'E and 9o 00'E (Figure 1). It is accessible through three major roads, namely Abuja-Keffi-Akwanga-Lafia road, Makurdi-Lafia road and Jos-Namu-Lafia road.
The study area's climate is characterised by rainy season (April to October) and dry season (November to March) with annual rainfall and temperature varying between 1300mm-1500mm and 28oC-36oC, respectively (Adefolalu, 2002).
The study area is underlain by the basement complex rocks, younger granites and Cretaceous Middle Benue Trough's sedimentary rocks (Figure 1) (Macleod et al., 1971). The basement complex rocks in the area are grouped into two, namely migmatite-gneiss complex and the older granites (or Pan-African granitoids). The migmatite-gneiss complex is Neo- Proterozoic to Meso-Archean (542Ma-3200Ma) in age and composed of migmatites and gneisses. It is the most extensive rock type in the area. The older granites (or Pan-African granitoids) are Pan-African (600 ± 200Ma) in age and consist mainly of granites, diorites and dolerites. Both the migmatites and gneisses were deformed and intruded by the older granites (or Pan-African granitoids) during the 600 ± 200 Ma Pan-African episodes. The pegmatite veins associated with these basement complex rocks usually show N-S, NNE-SSW, NE-SW and NNW-SSE trends (Figure 1). The younger granites in the study area are Jurassic (145-210Ma) in age and are high-level, anorogenic granites; they mainly consist of microgranites and biotite granites. The southern part of the area forms part of the middle Benue Trough and is underlain by Cretaceous sedimentary rocks, namely the Awgu shale and Lafia formation. The Awgu shale is composed mainly of bluish-gray to black shales, whereas the Lafia formation consists mainly of sandstones and claystones. According to Obaje et al., (1994), Paleogene basalt flows and dolerite sills have been encountered within the Lafia formation.
Materials and Methods
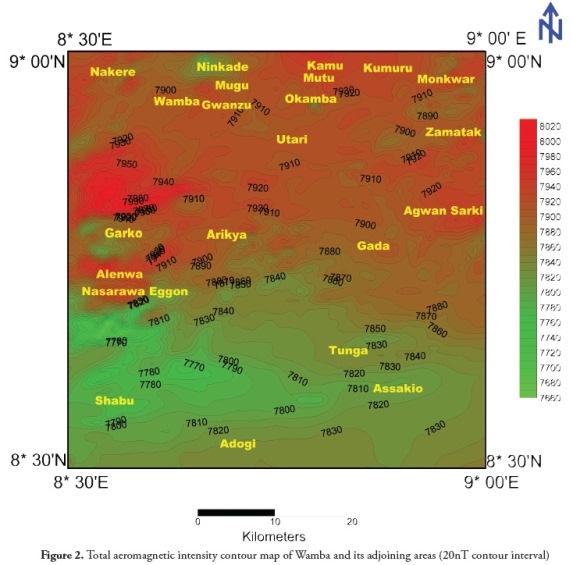
An aeromagnetic contour map of Wamba (Sheet 210) was used in this study; it was compiled by the Geological Survey of Nigeria, published on scale of 1:100,000. The aeromagnetic data was acquired by using a proton precession magnetometer towed in a housing known as a 'bird' along a series of NW-SE flight lines, spaced 2km apart, with 20km tie-line spacing and 500ft (152m) nominal flight altitude. The geomagnetic gradient was removed using the January 1974 International Geomagnetic Reference Field (IGRF). The map was digitised at 1km intervals to avoid aliasing error. This interval imposed a 1/2km-1 (i.e. 0.5km-1) Nyquist wavenumber and therefore, the thinnest magnetic source body that would have been delineated from the digitised data would have had around 2km width. The digitised data was gridded, applying the minimum curvature method and the resulting grid was contoured at 20nT intervals using Surfer 8 software to produce the total aeromagnetic intensity contour map (Figure 2). A plane surface regional anomaly was fitted to the digitised data by least squares multi-regression analysis to obtain the residual anomaly data. The expression obtained for the regional fields T(R) was:

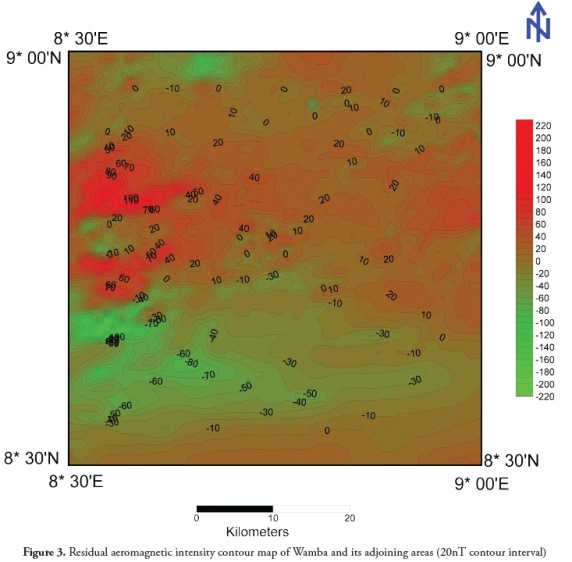
where, x and y were units spaced along the horizontal and vertical axes. The regional field values obtained were subtracted from the observed (total aeromagnetic intensity) data to obtain the residual anomaly data. Furthermore, the residual anomaly data obtained was subsequently gridded using the minimum curvature method and the resulting grid was contoured at 20nT intervals to produce the residual aeromagnetic intensity contour map (Figure 3).
Results and Discussion
Qualitative interpretation
The qualitative interpretation of aeromagnetic data directly illustrates geological information by looking at an aeromagnetic map without any calculations (Grant and West, 1965). A visual study of magnetic maps can be fruitful for preliminary interpretation (Telford et.al., 1998). Visual studies of total aeromagnetic intensity contour map (Figure 2) and the residual aeromagnetic intensity contour map (Figure 3) of Wamba and its adjoining areas revealed variations in magnetic field intensity throughout the area. Magnetic field intensity usually increases from the south towards the northern part of the area; such variation is a function of the rock types. The southern part of the area is part of the middle Benue Trough and is underlain by Cretaceous sedimentary rocks (Awgu shale and Lafia formation) and thus exhibited low (highly negative) magnetic intensity, whereas the Pre-Cambrian basement rocks (migmatites, gneisses and older granites) and Jurassic younger granites occupied the northern portion of the area and hence had high (positive) magnetic intensity. The magnetic anomaly contours in the southern portion were smooth and characterised by highly negative, long wavelength, magnetic anomalies having E-W and NE-SW direction trends (Benue Trough trend), while the magnetic anomaly contours in the northern portion had complex, positive, short wavelength, magnetic anomaly variations trending NESW and NW-SE.
Furthermore clear, localised, well-defined, high magnetic anomalies could be observed around the western and west-central portions of the aeromagnetic maps of the study area (Figures 2 and 3). Total magnetic intensity values in the aforementioned areas varied from 7960nT to 8020nT, whereas residual magnetic intensity values ranged from 160nT to 220nT. Iron ore is being mined by unskilled miners about 4km north of the town of Nasarawa Eggon; it could thus be inferred that the localised and welldefined high magnetic anomalies may have been associated with the presence of iron ore (having high magnetite to haematite ratio) or other metalliferous mineral deposits within the basement rocks in the area.
Quantitative interpretation
Structural lineament trends
Residual aeromagnetic intensity anomaly data was used to produce the residual aeromagnetic intensity shaded relief maps of the area to delineate structural lineament trends in the area (Figure 4). The residual aeromagnetic intensity shaded relief maps were modelled using the central difference gradient relief method, the Lommel-Seeliger law shading method, 0.02262781 Z-scale factor and different horizontal and vertical position light angles. The horizontal and vertical position light angles used in the modelling were HPLA= 0, VPLA= 0; HPLA= 45, VPLA= 0; HPLA= 90, VPLA= 0; and HPLA= 135, VPLA= 0. The aforementioned position light angles were used in modelling the residual aeromagnetic intensity shaded relief maps of the study area, because they are very useful in enhancing, illuminating and delineating structural lineament trends on shaded relief maps.
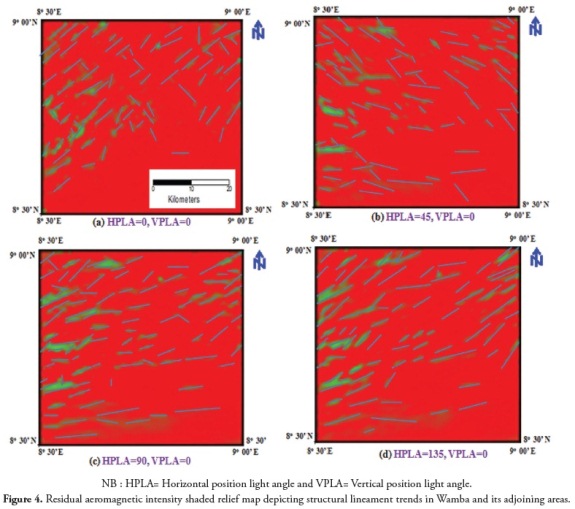
Hassanein and Soliman (2009) have stated that changing the horizontal position light angle (HPLA) helps define subsurface structures' predominant trends in an area. The trends generated and shown on the residual aeromagnetic intensity shaded relief maps of the area depicted the structural lineament trends on the magnetic basements beneath the area (Figure 4). The major structural lineament trends were NE-SW, NNESSW and NW-SE with minor ENE-WSW, E-W trends. Most of these trends agreed with previous work carried out in the Benue Trough and parts of the adjoining basement complex by Ajakaiye et al., (1986), Olasehinde et al., (1990) and Anudu et al., (2012).
Furthermore according to Dobrin and Savit (1988), lineation in the magnetic contours usually follows regional geology (e.g., intrusive bodies or large faults' strikes) and is thus useful in mapping structural trends. They also stated that well-defined boundaries between zones having appreciably different degrees of magnetic relief often indicate the presence of major basement faults and fractures. The structural lineaments in the area were thus mainly faults and fractures, as well as veins and foliations. A structural lineament map of the area (Figure 5) was produced using Dobrin and Savit's (1988) aforementioned assertions together with Figure 4.
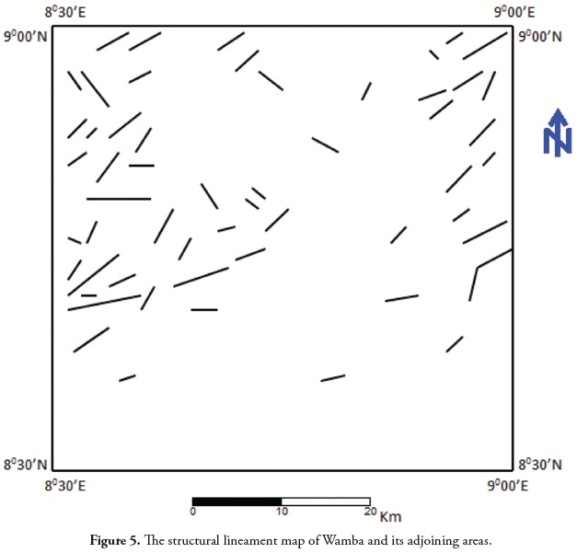
The comparative study of the geological map (Figure 1) and generated structural lineament map (Figure 5) of Wamba and its adjoining area showed that structural lineaments were more concentrated in the Pre-Cambrian basement rocks (migmatites, gneisses and older granites) and Jurassic younger granites than on the Cretaceous sedimentary rocks (Awgu shale and Lafia formation). This was due to the effect of several tectonic deformations which occurred throughout the Nigerian basements.
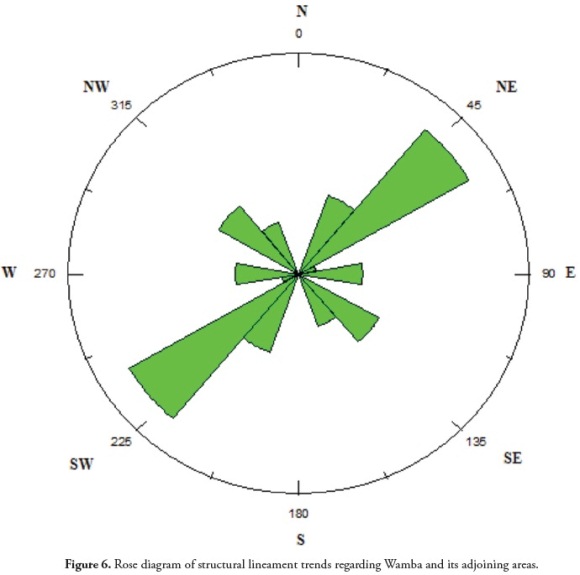
Structural lineament orientation or azimuth direction on the structural lineament map (Figure 5) was measured and plotted on a rose diagram using Grapher 5 software. The rose (azimuth-frequency) diagram depicted the structural lineaments' major trends being NE-SW, NW-SE and NNESSW, with minor NNW-SSE and E-W trends (Figure 6). Structural lineament (fractures, faults, shear zones, veins and foliations) orientation or trends' measurement can be used to date the events that produced the rocks from which they were obtained. According to Obiora (2009), NNESSW / N-S trends are Pan-African, while E-W / NNW-SSE trends are pre-Pan-African. Hence the NE-SW, NW-SE and NNE-SSW trends in the study area may probably have been Pan-African (younger than 800 Ma), whereas the NNW-SSE and E-W trends may have been pre-Pan- African (over 800 Ma).
Estimating depth
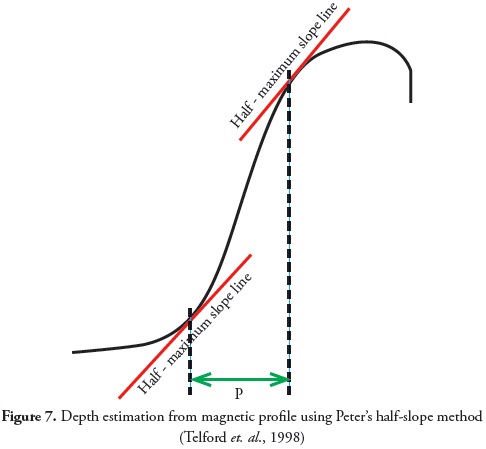
Peter's half-slope method was used to estimate the depth to magnetic source body. It is much simpler and faster and provides more depth estimates than model curve fitting analysis. It uses magnetic profiles' half maximum sloping flanks (Figure 7) to estimate depth especially in aeromagnetic interpretation (Peters, 1949; Nettleton, 1971; Rao and Babu, 1984; Telford et.al., 1998; Milsom, 2003). The depth to the source body beneath these portions of the curve was given by: H = 0.63P, where P was the horizontal distance between points where the slope was half the maximum slope (Figure 7).
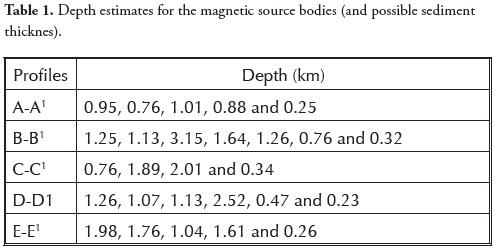
Five profiles were taken across the sedimentary part of the residual aeromagnetic intensity contour map of the area to estimate the depth to magnetic bodies (and possibly sediment thickness), namely A-A1, B-B1, C-C1, D-D1 and E-E1 (Figure 8). They were taken perpendicular to the most prominent anomalies' strike direction to obtain the best estimate of body parameters from the profiles so selected.
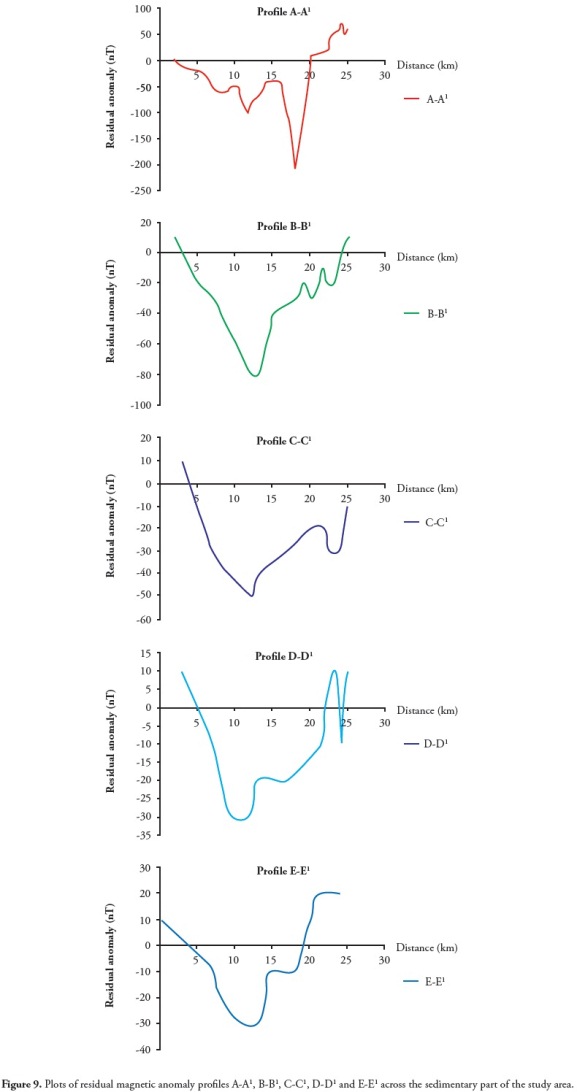
The afore-mentioned five profiles were plotted, as shown in Figure 9, and then interpreted using Peter's half-slope method.
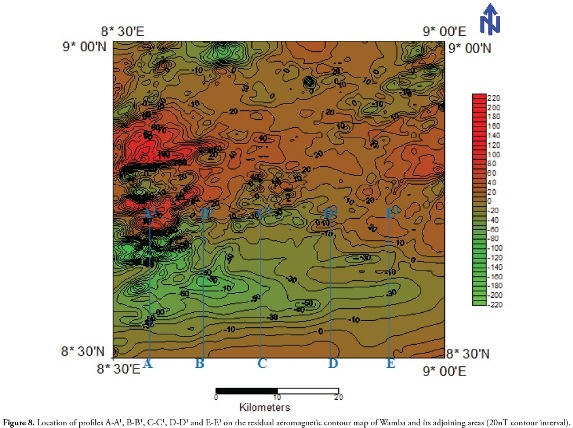
Table 1 above shows the magnetic source bodies' depth estimates (and possibly sediment thickness) throughout the study area's sedimentary part. Two depth source models were established using depth values determined by Peter's half-slope method; the deeper sources ranged from 0.88km to 3.15km, anomaly values varying from -32nT to -225nT, characterised by longer wavelength anomaly, while the shallower sources ranged from 0.23km to 0.76km, anomaly values ranging from -10nT to 20nT, characterised by short wavelength anomaly. The shallower sources probably depicted depths to pre-Cambrian basement or near surface basic igneous intrusive rocks (such as basalt flows and dolerites) and/or low-lying river valleys. The deeper sources were characterised by high negative anomaly values having longer wavelength and depicted basic intrusive rock at depth.
Since the southern part of the area lies on the sediment-basement boundary (part of the Cretaceous Benue Trough's northern margin), the causative sources were considered to be deeper-seated intra-basement basic intrusive rock bodies. The anomaly occurred in the NE-SW and E-W trend following the Benue Trough's general trends. The results were in good agreement with interpreted positive gravity anomalies characterising the trough's northern margin (Ikpokonte, 2009; Fairhead and Okereke, 1987).
The depth values obtained for the study area also agreed with those computed from aeromagnetic data over some parts of the middle Benue Trough by Nur et al., (1994) and Onyedim et al., (2006) using spectral analysis and HDEP software, respectively, hence depicting the sedimentary cover (sediment thickness) across the sedimentary part of the study area being generally low and therefore not likely to favour hydrocarbon (oil and/gas) generation or formation.
Conclusions
A total aeromagnetic intensity contour map, residual aeromagnetic intensity contour map and structural lineament map of the area being studied were obtained in this work. Visual studies of total aeromagnetic intensity contour map and residual aeromagnetic intensity contour map depicted that the southern part of the area underlain by Cretaceous sedimentary rocks (Awgu shale and Lafia formation) had low and smooth magnetic intensity, whereas the northern part underlain by the Pre-Cambrian basement rocks (migmatites, gneisses, Older Granites) and Jurassic younger granites had high and complex magnetic intensity. Structural lineament orientation suggested that they were products of Pan-African orogeny (NE-SW, NW-SE and NNE-SSW trends) and pre-Pan-African orogeny (NNW-SSE and E-W trend). Magnetic source bodies' (and possibly sediment thickness) depth estimated across the sedimentary part of the area using Peter's half-slope method, indicating two depth source models. Deeper sources varied from 0.88km to 3.15km, while shallower sources varied from 0.23km to 0.76km. This showed that the sedimentary cover was generally low and hence would not likely to favour hydrocarbon (oil and/gas) generation.
Acknowledgement
The authors are grateful to the two anonymous reviewers for their useful suggestions and criticism which have greatly improved the revised manuscript. We would also like to thank Jason Garry for comprehensive editing of this paper which added significantly to its quality and content.
References
Adefolalu, A.D. 2002. Climate. In: Africa Atlases; Atlas of Nigeria. Les Editions J. A. Aux E'dition du Jaguar 57 bis, rue d'Auteuil-75016 Paris-France. [ Links ]
Aldana, M., Costanzo-Alvarez, V. and Diaz, M. 2003. Magnetic and mineralogical studies to characterise oil reservoirs in Venezuela. The Leading Edge, Vol. 22, No. 6, Pp. 526. [ Links ]
Anudu, G.K., Obrike, S.E., Iyakwari, S. and Ikpokonte, A.E. 2012. Preliminary structural study of Landsat imagery over Wamba and environs, Nasarawa State north-central Nigeria. Research Journal of Applied Sciences, Vol. 7, No. 1, Pp. 1-9. [ Links ]
Ajakaiye, D.E., Hall, D.H., Miller, T.W, Verherjen, P.J.T., Awad, M.B. and Ojo, S.B. 1986. Aeromagnetic anomalies and tectonic trends in and around the Benue Trough Nigeria. Nature, 319, Pp. 582-584. [ Links ]
Cornford, C. 1990. Source rocks and hydrocarbons of the North Sea. In Glennie, K.W. (ed.) Petroleum Geology of the North Sea. Basic Concepts and Recent Advances. Blackwell Science, Oxford, Pp. 376-462. [ Links ]
Costanzo-Alvarez, V., Aldana, M., Aristeguieta, O., Marcano, M.C. and Aconcha, E. 2000. Study of magnetic contrasts in the Guafita oil field (South-western Venezuela). Physics and Chemistry of the Earth, Part A: Solid Earth and Geodesy, Vol. 25, No. 5, Pp. 437- 445. [ Links ]
Dobrin, M.B. and Savit, C. H. 1988. Introduction to Geophysical Prospecting, 4thEdition, McGraw-Hill, New York. 867pp. [ Links ]
Dow, W.G.1978. Petroleum source beds on continental slopes and rises (2). American Association of Petroleum Geologists (AAPG) Bulletin Vol. 62. [ Links ]
Fairhead, J.D and Okereke, C.S. 1987. A regional gravity study of the West African Rift System in Nigeria and Cameroun and its tectonic interpretation. Tectonophysics, Vol. 143, Pp. 141-159. [ Links ]
GETECH. 2007. Advanced Processing and Interpretation of Gravity and Magnetic Data. GETECH Plc., Kitson House Elmete Hall Leeds, UK. 27pp. [ Links ]
Gluyas, J. and Swarbrick, R. 2005. Petroleum Geoscience. Blackwell Science, Oxford, 358pp. [ Links ]
Grant, F.S. and West, G.F. 1965. Interpretation theory in Applied Geophysics. New York: McGraw-Hill. [ Links ]
Gunn, P. J. 1997. Application of aeromagnetic surveys to sedimentary basin studies. Australian Geological Society Organisation (AGSO) Journal of Australian Geology and Geophysics, Vol. 17, No. 2, Pp. 133-144. [ Links ]
Hassanein, H.I.E. and Soliman. K.S. 2009. Aeromagnetic data interpretation of Wadi Hawashiya area for identifying surface and subsurface structures, northeastern desert, Egypt. Journal of KAU: Earth Sci., Vol. 20, No. 1, Pp. 117-139. [ Links ]
Ikpokonte, A.E. 2009. A continental structural junction: Evidence of shallow crustal discontinuities deduced from the gravity data over the Niger-Benue Troughs (confluence) area, Nigeria. Nigerian Journal of Physics, Vol. 21, No. 1. [ Links ]
Kearey, P., Brook, S.M. and Hill, I. 2002. Introduction to geophysical exploration. 3rd Edition. Blackwell Scientific Publication, Oxford. 262pp. [ Links ]
Macleod, W.N., Turner, D.C. and Wright, E.P. 1971. The Geology of Jos Plateau. Geological Survey of Nigeria, Bull. No. 32, Vol. 2, Pp. [ Links ]
Milsom, J. 2003. Field geophysics. 3rd Edition. John Wiley and Sons Ltd, London. 232pp. [ Links ]
Nettleton, L.L., 1971. Elementary Gravity and Magnetics for Geologists and Seismologists: Society of Exploration Geophysicists Monograph Series No. 1, Pp. 83-87. [ Links ]
Nur, M.A., Onuoha, K.M. and Ofoegbu, C.O. 1994. Spectral analysis of aeromagnetic data over the Middle Benue Trough, Nigeria. Journal of Mining and Geology, Vol. 30, No.2, Pp. 211-217. [ Links ]
Obaje, N.G., Ligous, B. and Abaa, S.I. 1994. Petrographic composition and depositional environment of Cretaceous coals and coal measures in the Middle Benue Trough of Nigeria. International Journal of Coal Geology, 26, Pp. 233-260. [ Links ]
Obiora, S.C. 2009. Field measurements in descriptions of igneous and metamorphic rocks. In Lambert-Aikhionbare, D.O. and Olayinka, A.I. (eds.) Proceedings of Field Mapping Standardisation Workshop, Ibadan University Press, Pp. 105-125. [ Links ]
Olasehinde, P.I., Pal, P.C. and Annor, A.E. 1990. Aeromagnetic anomalies and structural lineament in the Nigerian Basement Complex. Journal of African Earth Sciences, Vol. 11, No. 3/4, Pp. 351-355. [ Links ]
Onyedim, G. C., Awoyemi, M. O, Ariyi, E. A. And Arubayi, J. B. 2006. Aeromagnetic imaging of the basement morphology in part of the Middle Benue Trough, Nigeria. Journal of Mining and Geology, Vol. 42, No. 2, Pp. 157-163. [ Links ]
Paterson, N.R. and Reeves, C.V. 1985. Applications of gravity and magnetic surveys: the state-of-the-art in 1985. Geophysics 50, Pp. 2558-94. [ Links ]
Peters, L.J. 1949. The direct approach to magnetic interpretation and its practical application. Geophysics 14, Pp. 290-320. [ Links ]
Rao, D. A., and Babu, H.V.R. 1984. On the half-slope and straight-slope methods of basement depths determination. Geophysics 49, Pp. 1365 - 8. [ Links ]
Telford, W. M., Geldart, L. P. and Sheriff, R. E. 1998. Applied Geophysics, 2nd Edition, Cambridge University Press, USA. 770pp. [ Links ]

