


Services on Demand
Journal
Article
 English (pdf)
 Article in xml format
 Article references
 Send this article by e-mail
Indicators
-
 Cited by SciELO
 -
 Access statistics
Related links
-
 Cited by Google
 -
 Similars in
SciELO
Similars in
SciELO -
 Similars in Google
Share

 Permalink
Earth Sciences Research Journal
Print version ISSN 1794-6190
Earth Sci. Res. J. vol.16 no.1 Bogotá Jan./June 2012
Subsurface cavity detection in a karst environment using electrical resistivity (er): a case study from yongweol-ri, South Korea
Muhammad Farooq1*, Samgyu Park2, Young Soo Song3, Jung Ho Kim2, Mohammad Tariq1 and Adepelumi Adekunle Abraham4
1 Department of Earth Sciences, COMSATS Institute of Information Technology, Abbottabad, Pakistan
2 Mineral Resources Research Division, Korea Institute of Geoscience and Mineral Resources, South Korea
3 Department of Mineral Resources and Energy Engineering, Chonbuk National University, South Korea
4 Department of Geology, Obafemi Awolowo University, Nigeria
* Corresponding author. E-mail: farooq@ciit.net.pk
Record
Manuscript received: 19/10/2011
Accepted for publications: 04/05/2012
ABSTRACT
Karst voids were encountered during road construction in Yongweol-ri, South Korea. Attempts to determine the extent of the karst voids through drilling was expensive, time-consuming and too dangerous. An electrical resistivity survey was thus carried out to investigate current subsurface geology beneath the proposed road network. This investigation was aimed at imaging karstic voids and detecting areas prone to ground subsidence through the collapse of cavities beneath a road segment overlying such features. A numerical modelling study preceded the field survey to determine whether the electrical resistivity method could identify such features. The field data set consisted of eleven electric profiles acquired using dipoledipole array; electrical resistivity profiles (100 m and 300 m length) were measured using a dipole-dipole electrode configuration and electrode spacing was kept at 5 m to ensure good coverage of the study area. The resistivity data was inverted using 2D and 3D algorithms based on the least squares smoothness constraint technique. The inverted resistivity images provide a clear view of weathered soils, the distribution of weak areas or karst voids and bed rock. Several low resistivity areas were identified and the subsequent drilling of such anomalous areas led to the discovery of several weak zones or clayfilled underground cavities; the drilling results had excellent correlation with the resistivity images. The electrical resistivity imaging result proved precise and extremely efficient in delineating the karstic void investigation and should be taken into account when choosing an investigation technique to be used at complex geological sites. A remedial action plan involving consolidation grouting work has been suggested prior to road construction.
Keywords: cavity, dipole-dipole, karst void, resistivity modelling, subsidence.
RESUMEN
Cuevas kársticas fueron encontrados durante la construcción de unas carreteras en Yongweol-Ri, Corea del Sur. Los intentos para determinar el grado/extensión de las cuevas kársticas a través de perforaciones eran costosos, lentos y muy peligrosos. Así, un estudio de resistividad eléctrica (RE) se llevó a cabo para investigar la geología actual del subsuelo por debajo de la red de carreteras propuesta. La presente investigación fue dirigida a obtener imagen de las cuevas kársticas y la detección de zonas propensas al hundimiento del terreno a través del colapso de las cavidades debajo de un segmento de una carretera encima de las mismas.
Un estudio de modelación numérica precedió a la investigación de campo para determinar si el método RE podría identificar tales características. El conjunto de datos de campo constaban de once perfiles eléctricos adquiridos con arreglo dipolo-dipolo; perfiles RE (100 m y 300 m de longitud) fueron medidos usando una configuración de electrodos dipolo-dipolo y la separación entre electrodos se mantuvo a 5 m para garantizar una buena cobertura del área de estudio. Los datos de resistividad fueron invertidos utilizando algoritmos 2D y 3D basados en la técnica mínimos cuadrados amortiguados.
Las imágenes de resistividad invertidas proporcionan una vista clara de los suelos erosionados, la distribución de las áreas débiles o de cuevas kársticas y de lecho de roca. Varias zonas de baja resistividad fueron identificadas y la perforación posterior de dichas áreas anómalas llevó al descubrimiento de varias zonas débiles o de cavidades subterráneas llenas de arcilla; los resultados de las perforaciones tuvieron una excelente correlación con las imágenes de resistividad. El resultado del mapa de RE demostró ser precisa y extremadamente eficiente en la delimitación de la investigación de cuevas kársticas y debería tomarse en cuenta cuando se escoja una técnica de investigación para ser usada en sitios geológicos complejos. Ha sido sugerido un plan de acción de medidas correctivas que implica el trabajo de consolidación de anclajes antes de la construcción de carreteras.
Palabras claves: Cavidad, dipole-dipolo, cuevas kársticas, modelo de resistividad, hundimiento.
Introduction
Karst voids are often a major engineering risk associated with construction in areas underlain by carbonate rocks. Several problems are associated with subsurface karstic voids, such as road and highway subsidence, building foundation collapse and dam leakage. Large void formation in a karst environment may lead to sudden and catastrophic pavement failure, whilst fine particles' slow migration from the sub-base may cause gradual ground subsidence. Any of the above situations in a karst environment can be expensive for engineering structure design. Boring within karst areas often does not meet areas of concern in the subsurface. Mislaid borings can provide insufficient data and can misrepresent the subsurface system. Examining aerial photographs and satellite images is a classical karst detection technique which has led to reasonably good maps being produced over the past decade. However, such dataset is spatially and temporally discontinuous, representing only immediate snapshots. Geological and geomorphological methods cannot be directly applied in many urban areas where rapid development has concealed surface features.
Reliable hazard mapping, especially for detailed civil engineering studies, cannot rely solely on a limited source of information; other techniques are thus required for accurate measurement. Subsurface voids represent disturbances of the close subsurface layered system in karst areas; such disturbances can be identified using geophysical techniques. Karst void characterisation using geophysical methods has gained wide interest in the past few decades.
A variety of geophysical techniques can be used for detecting karst voids below the surface. All of them are based on the physical contrast between a void and the surrounding rocks. Geophysical techniques allow large areas to be covered in a short period of time and represent an efficient way of detecting subsurface heterogeneities including voids and subsidence areas (i.e. seismic reflection, microgravity, ground penetrating radar and electrical resistivity). All such techniques have shown great potential for accurately mapping subsurface conditions; however, geo-electrical imaging is considered one of the most promising techniques for karst voids (Roth and Nyquist, 2003).
Promising results have been obtained by researchers around the world during the last two decades involving electrical resistivity surveys in karst terrains. Their objectives were to map karst structures such as voids, sinkholes and weathered areas (Gautman et al., 2000; Van Schoor, 2002; Zhou et al., 2002; Gibson et al., 2004). These investigations have demonstrated the electric resistivity method's efficiency regarding mapping karst structures due to the large contrast in resistivity between filled cavities (low resistivity) and limestone bedrock. However, karst areas represent a very unfriendly environment for 2D geophysical exploration due to large subsurface heterogeneity.
An engineering firm encountered subsidence during road construction in the Yongweol-Ri area (Figure1); the project was thus halted and a geophysical investigation was embarked on to understand such subsidence. Research was thus designed to use electrical resistivity (ER) and drilling boreholes to detect and investigate the extent of karst voids and underground cavities in the subsurface of the route to be taken by the road in question. ER was chosen due to previous researchers' promising results. Ground penetrating radar could not be applied in the study area due to high salinity. 2D and 3D ER surveys were thus carried out to evaluate these methods and data regarding eight boreholes acquired in the area was analysed.
Site descriptions
The field test site was located in Yongweol-Ri Muan-gun, southwestern Korea; ground subsidence has been reported in nearby rice fields. The area is underlain by limestone bedrock overlain by alluvial deposits. Ubiquitous bedrock underground cavities are known to exist within the area. Structural damage resulting from ground subsidence has already affected some road networks and buildings in this area; the risk of future damage resulting from subsidence is thus considered high regarding future development programmes. The origin of the network of cavities in the area has been ascribed to bedrock limestone dissolution by groundwater flowing through a network of fractures associated with a large fault zone near the site known as the Kwangju fault. All the boreholes drilled for agricultural purposes in the area have had very high groundwater yield, possibly due to such cavities and fractures (Kim et al., 2007; Park et al., 2009).
The sinkhole collapse mechanism at the test site involves happening during the farming off-season, the water-table lying above the regolithlimestone boundary (conversely, when the water-table drops into or below cavities due to a large volume of groundwater pumped for irrigation during the farming season this causes regolith arches, spanning the openings in the bedrock) and collapse occurring due to loss of buoyant support for regolith arches, attributed to downward moving groundwater. The area's overall geology consists of pre-Cambrian basement complex rocks (i.e. schist and granitic gneiss) usually overlain by unknown metasediments whose exact age has not been determined; part of the site is covered by Cretaceous volcanic sediments, basal quartzite and schist intercalated with thinly-bedded, lensshaped limestone and quartzite beds (Park et al., 2009; Park et al., 2010).
The electrical resistivity (ER) method
The ER method involves determining subsurface resistivity distribution by taking ground surface measurements; it is based on Ohm's law. Current is usually introduced into the ground by one pair of electrodes and a second pair is then used to measure the resulting potential difference. An apparent resistivity ρa is determined by measuring potential difference âV at a different couple of electrodes' spacing:
where k is a geometric constant depending on the four electrodes' reciprocal positions and is injected current intensity. However, data is acquired simultaneously if multiple electrodes are used and the area will be efficiently covered though probes at various depths. A fast numerical approach is then required to optimise an initial multi-layer model constructed from such apparent resistivity values. This data can be converted to a true geological model of the subsurface through inversion techniques. A finite difference or finite element method (FEM) is usually used to calculate the model's 2D or 3D forward response. Successive iteration will ensure that the model will improve until a minimum root mean square (RMS) misfit between observed and model pseudosection is achieved. Resistivity differences normally correspond to changes in subsurface materials or pore fluids.
Synthetic modelling
Synthetic modelling was carried out prior to field data acquisition in this study for deciding on a suitable electrode array to be used during data acquisition. EM2DMODEL numerical forward model software (South Korean Institute of Geosciences and Mineral Resources' Geo-electrical Imaging Laboratory) was used to simulate subsurface cavity electrical response. A finite element algorithm was used to calculate direct response (apparent resistivity) from a set of resistivity models intended to reflect cavity area pattern. The resulting apparent resistivity from forward modelling was input into DIPRO software and inverted into earth resistivity models. The forward model tested (Figure 2) had three layers having 20 Ω-m, 70 Ω-m and 500 Ω-m resistivity; 70 Ω-m was selected to represent the top layer of overburden material (weathered soils), 20 Ω-m a subsurface cavity in the bedrock and 500 Ω-m bedrock resistivity (i.e. limestone).
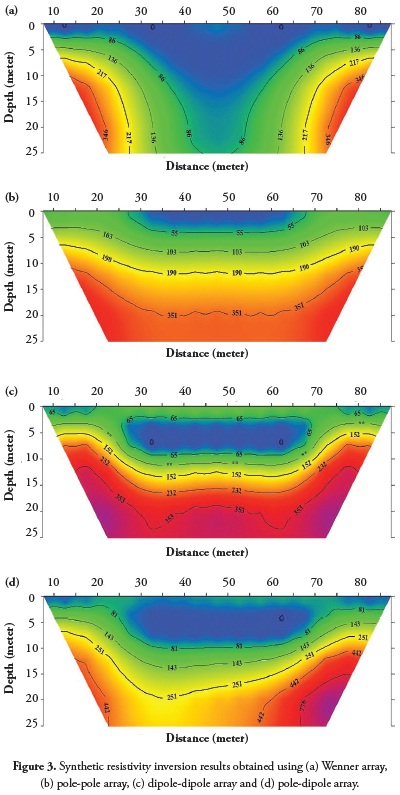
Figure 3 shows inverted resistivity images obtained for Wenner, polepole, dipole-dipole and pole-dipole arrays (a, b, c & d, respectively) to determine which array best imaged the subsurface cavity; inverted resistivity representing the arrays were compared. Figure 3a shows an inverted model obtained using a Wenner array; the image shows that inverted resistivity was underestimated and the model did not resolve the embedded 20 Ω-m area (subsurface cavity) and thus its image was not a true representation of the subsurface model used. The estimated pole-pole array model shown in Figure 3b overestimated subsurface cavity location whilst the dipole-dipole array model (Figure 3c) revealed a subsurface cavity giving the best approximation to the initial model (its resistivity and thickness were well resolved). The pole-dipole array (Figure 3d) was similar to that of the dipole-dipole model but the pole-dipole inverted model gave an asymmetrical array; this gave the dipole-dipole array a slight advantage over the pole-dipole array. The dipole-dipole array was thus adopted for this study as it reproduced subsurface cavity images more precisely than other electrode array types.
Data acquisition and processing
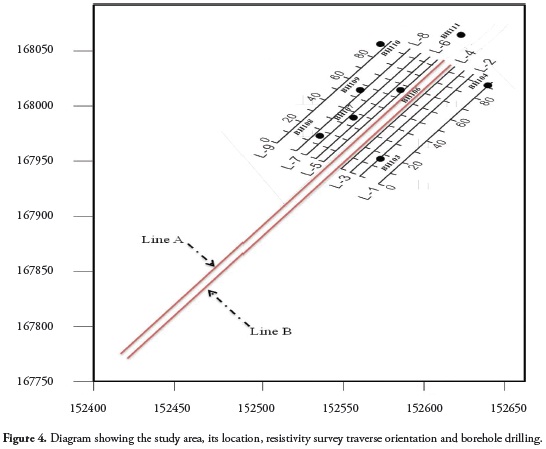
SuperSting R8/IP was used for data acquisition in profiling mode, using the dipole-dipole array; data acquisition involved two phases. Profile lines "A" and "B" (300 m length) were acquired with 5 m electrode spacing on both sides of the road during phase 1. A small portion of the road was selected for detailed investigation based on the results for lines A and B. Nine traverses (lines 1 to 9, 100 m length) were acquired using 5 m electrode spacing along the road during phase 2. These lines' orientation and extent and borehole drilling locations are shown on the location map (Figure 4). The geoelectrical data was processed and inverted using DIPRO resistivity software. The inversion routines were based on the smoothness constrained least squares optimisation technique (Yi et al., 2001; Yi et al., 2003); forward resistivity calculations involved applying an FEM-based iterative algorithm. Inversion divided the subsurface into a number of small rectangular blocks; the blocks' resistivity values were determined.
Results and interpretation
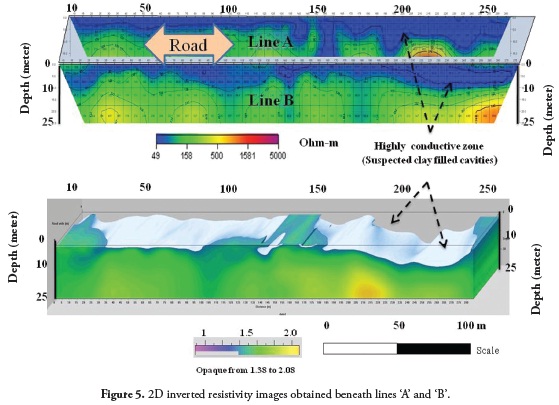
Figure 5 shows the inverted resistivity sections for the two parallel traverses (A and B); two distinct resistivity areas could be noted. The first had weathered, low conductivity soils occurring near the surface, beginning from 0 to 150 m (horizontal distance). The second area had high conductivity within weathered soils; the highly conductive area occurred between 150 to 250 m horizontal distances. The former could have be due to seasonal variation whilst the other area was probably due to the presence of highly weathered limestone. Depth in this area appeared to be about 5m to 15 m. This area's resistivity values ranged from 20 to 90 Ω-m. Increased weathering suggested increased clay content, indicating a less resistive environment (increased conductivity). This area was interpreted as being the subsurface cavity area.
Nine parallel resistivity profiles were acquired on both sides of the road to obtain more reliable and realistic subsurface images of the risky area (cavity area) (Figure 4). Figure 6 (a & b) shows the nine parallel traverses' inverted resistivity sections. The whole area was divided into two regions (lines 1 to 4 are shown in Figure 6a and lines 5 to 9 in Figure 6b).
The first region's images (Figure 6a) were interpreted to represent two main areas having moderate and high resistivity; the first extended from ground level to a depth of 5-13 m and had moderate resistivity and the second (Figure 6b) had three distinct resistivity areas that characterised lines 5 to 9. The uppermost part extended beyond 13 m and had higher resistivity than the previous area. The shallow area having moderate resistivity values (50-70 Ω-m) was interpreted to represent unconsolidated material consisting of silty and/or sandy gravel lenses (conductive material). The deeper area having higher resistivity values (>200 Ω-m) was interpreted to represent weathered limestone. The very low resistivity anomalies observed within this layer could have represented incompetent rock or possibly clay/ water-filled cavities. The result obtained along lines 5 to 9 (Figure 6b) was considerably different from the results for lines 1 to 4 (Figure 6a). This difference was attributed to contrasting resistivity between shallow, moderate and deeper resistivity areas.
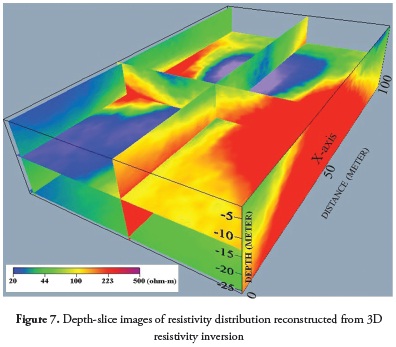
The dipole-dipole resistivity data was further subjected to advanced 3D resistivity processing using an algorithm developed by Yi et al., (2001) to obtain a more reliable and realistic representation of subsurface structure. The subsurface 3D images obtained were represented as horizontal slices of the subsurface at different depths (Figure 7). Figure 7 shows resistivity slices at various depths. These images clearly showed that the lateral extent and depth of the subsurface cavities beneath the survey area had been effectively mapped.
Core drilling results
After processing and interpreting the resistivity data, exploratory drilling confirmed whether areas delineated as having low resistivity were actually cavities. Borehole drilling was carried out along lines 1 to 9 and eight locations were selected for coring along these lines. The borehole drilling area was selected based on the strength of the anomalies. Figure 8 shows a comparison of the geoelectrical cross-section for line 5 and BH 106 and borehole drilling results from other boreholes. Figure 8 clearly shows that the subsurface consisted of limestone cavities; each borehole's results were comparable to delineated low resistivity areas along survey lines. It also shows weak rock and/or clay-filled cavities and that the corresponding resistivity images identified low resistivity areas within the study region.
Conclusions and recommendations
The ER survey of a proposed road construction site revealed several low resistivity regions which were interpreted as clay/water-filled voids in a karst terrain. A shallow boring programme involving the anomalous portion of the surveyed area revealed numerous cavities and verified the resistivity measurements' overall accuracy. The synthetic model and the field survey results demonstrated the efficacy of dipole-dipole array ER method in subsurface cavity mapping. The drilling result validated cavity location and existence delineated by the ER technique and lent credence to its applicability in karst terrain. It is recommended that cement-based grout should be injected into the subsurface cavities to improve the strength of subsurface materials and reduce permeability.
Acknowledgments
This research work has been supported by the Korean Institute of Geosciences and Mineral Resources' Basic Research Project funded by the Korean Ministry of Knowledge Economy (MKE).
References
Adepelumi, A.A., Solanke, A.A., Sanusi, O.B. and Shallangwa A.M. (2006). Model tank electrical resistivity characterization of LNAPL migration in a clayey-sand formation. Environmental Geology 50, 1221-1233. [ Links ]
Adepelumi A, Yi MJ, Kim JH, Ako BD, Son JS (2006). Integration of surface geophysical methods for fracture detection in crystalline bedrocks of south-western Nigeria. Hydrogeology Journal 14, 1284- 1306. [ Links ]
Gautman, P., Pant, S.R., and Ando, H. (2000). Mapping of Subsurface Karst Structure with Gamma Ray and Electrical Resistivity Profiles: a Case Study from Pokhara Valley, Central Nepal. Journal of Applied Geophysics 45, 2, 97-110. [ Links ]
Gibson, P.J., Lyle, P. and George, D.M. (2004). Application of Resistivity and Magnetometry Geophysical Techniques for Near-Surface Investigations in Karstic Terranes in Ireland. Journal of Cave and Karst Studies, 66, 2, 35-38. [ Links ]
Kim, J., Yi, M., Hwang, S., Song, Y., Cho, S and Synn, J. (2007). Integrated geophysical surveys for the safety evaluation of a ground subsidence zone in a small city. Journal of Geophysics and Engineering, 4, 332-347. [ Links ]
Park, G., Park, S., Yi, M.J., Rim, H., Cho, S.J., and Kim, J.H. (2010). Geostatistical integration using 2-D electrical resistivity and 3-D gravity methods for detecting cavities in a Karst area, Environmental Earth Sciences 60, 965-974. [ Links ]
Park, S., Kim C., Son J. S., Yi, M.J., and Kim, H.H. (2009). Detection of cavities in a karst area by means of a 3D electrical resistivity technique. Exploration Geophysics 40, 27-32. [ Links ]
Roth, M. J. S. and Nyquist, J. E. (2003). Evaluation of Multi-Electrode Earth Resistivity Testing in Karst. Geotechnical Testing Journal, ASTM, 26, 167-178. [ Links ]
Van Schoor, M. (2002). Detection of Sinkholes Using 2D Electrical Resistivity Imaging: Applied Geophysics Journal, 50, 4, 393-399. [ Links ]
Yi, M. J., Kim, J. H., and Chung, S. H. (2003). Enhancing the Resolving Power of Least-Squares Inversion with Active Constraint Balancing. Geophysics, 68, 931-941. [ Links ]
Yi, M. J., Kim, J. H., Song, Y. H., Cho, S. J., Chung, S. H., and Suh, J. H. (2001). Three Dimensional Imaging of Subsurface Structures Using Resistivity Data. Geophysical Prospecting, 49, 4, 483-497. [ Links ]
Zhou, W. F., Beck, B. F., and Adams, A. L. (2002). Effective Electrode Array in Mapping Karst Hazards in Electrical Resistivity Tomography. Environmental Geology, 42, 8, 922-928. [ Links ]

