


Services on Demand
Journal
Article
 English (pdf)
 Article in xml format
 Article references
 Send this article by e-mail
Indicators
-
 Cited by SciELO
 -
 Access statistics
Related links
-
 Cited by Google
 -
 Similars in
SciELO
Similars in
SciELO -
 Similars in Google
Share

 Permalink
Earth Sciences Research Journal
Print version ISSN 1794-6190
Earth Sci. Res. J. vol.16 no.2 Bogotá July/Dec. 2012
Statistical correlation between b-value and fractal dimension regarding Turkish epicentre distribution
Serkan Ozturk
Gumushane University. Turkey. E-mail: seko6134@gmail.com
Record
Manuscript received: 13/02/2012 Accepted for publications: 06/05/2012
ABSTRACT
This study was aimed at analysing the relationship between seismic b-value and fractal dimension Dcvalue for Turkish epicentres. The earthquake catalogue consisting of 99,737 instrumentally-registered Turkish events was analysed for the period between 1970 and 2011; Turkey was divided into 55 tectonic zones for making a detailed comparison. The b-values were calculated by the maximum likelihood method and the Dc-values were obtained with 95% confidence limits by linear regression. The results showed that higher Dc-values were associated with lower b-values and this could have been an indication of relatively high stress intensity and stronger epicentre clustering in these regions.
Orthogonal regression was used to estimate a suitable statistical correlation between two seismotectonic parameters; the Dc = 2.44 - 0.30*b relationship was obtained with a strong negative correlation (r = -0.82) between b-value and Dc-value for Turkish earthquake distribution. This seemed to agree with other regional results obtained for different parts of Turkey and the rest of the world.
Keywords: Turkish earthquake, fractal dimension, b-value, correlation.
RESUMEN
Este estudio tuvo como objetivo analizar la relación entre el valor b y la dimensión del valor fractal Dc para los epicentros de Turquia. El catálogo sísmico que consiste en 99.737 eventos registrados instrumentalmente fue analizado para el período comprendido entre 1970 y 2011; Turquía se dividió en 55 zonas tectónicas para hacer una comparación detallada. Los valores de b se calcularon por el método de máxima verosimilitud y la Dc-valores se obtuvieron con límites de confianza del 95% mediante regresión lineal. Los resultados mostraron que el aumento del valor fractal Dc se asocia con menores valores b y esto podría haber sido un indicador de intensidad de tensiones relativamente altas y una más fuerte agrupación de epicentro en estas regiones.
Se utilizó una regresión ortogonal para estimar la correlación estadística adecuada entre dos parámetros sismotectónicos la relación de la dimensión fractal Dc = 2,44 a 0,30*b, se obtuvo con una fuerte correlación negativa (r = -0,82) entre valores b y valores fractales Dc para la distribución de terremotos en Turquía. Esto parece estar de acuerdo con otros resultados regionales obtenidos para las diferentes partes de Turquía y el resto del mundo.
Palabras claves: Terremoto de Turquía, dimensión fractal, valor-b, correlación.
Introduction
Since fractal description was developed for the geometry of natural objects (Mandelbrot B.B., 1982), it has been recognised that many complex space-time phenomena, such as seismicity, may be described and interpreted in terms of fractal distributions with power-law scaling (e.g. Hirata T., 1989; Oncel A.O. et al., 1995; Caneva A., Smirnov V., 2004; Oncel A.O., Wilson T.H., 2007; Roy S. et al., 2011). However, studies of possible correlation between seismicity and fault distribution are limited. Applying seismic hazard assessment to fractal association between seismotectonic variables requires distinguishing normal and anomalous correlations between such data sets’ fractal attributes. Since the statistical behaviour of seismicity may potentially represent sensitive short-term predictors of major earthquakes, this study’s main aim was to find an empirical relationship between seismic b-values and the fractal distribution of epicentres for Turkish earthquakes.
Data regarding earthquakes and tectonic zoning
Several earthquake catalogues are available for Turkey from both national and international sources. Earthquakes occurring between 1970 and 2006 were taken from Ozturk’s catalogue of instrumental data (2009), including duration magnitude (MD) for 73,530 earthquakes occurring in Turkey between 1970 and 2006; Ozturk used empirical relationships to compile a homogenous and complete earthquake catalogue (1970 to 2006). The Bogazici University’s Kandilli Observatory and Research Institute (KOERI) catalogue was also used for 2006 to 2011; KOERI usually gives local magnitudes (ML) for local earthquakes having missing MD. If an MD was unknown in the KOERI catalogue for 2006 to 2011, then MD were calculated using the relationships given in Ozturk (2009). 26,207 earthquakes in and around Turkey were thus selected for the aforementioned period. This earthquake catalogue was homogeneous for MD and contained 99,737 earthquakes occurring between 1970 and 2011.
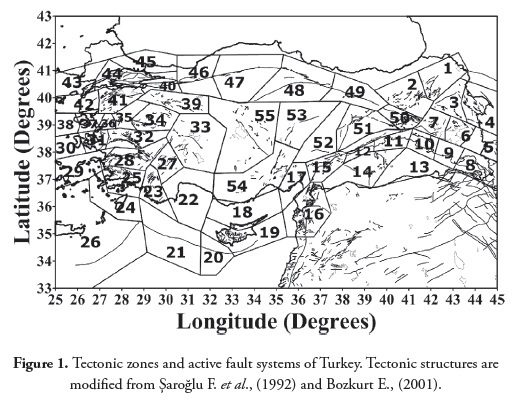
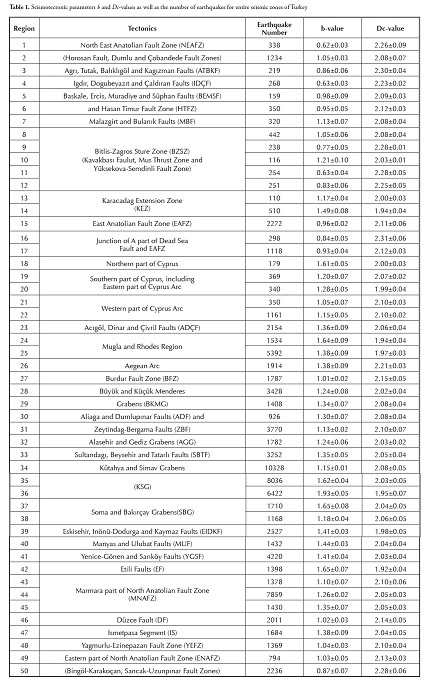
Many authors have suggested tectonic zoning as a widely-used methodology for evaluating the hazard of an earthquake occurring (e.g. Erdik M. et al., 1999; Jiménez M. et al., 2001; Bayrak Y. et al., 2009). The present study’s new seismic source zones for Turkey and its adjacent areas were based on tectonic zoning studies by Erdik (1999) and Bayrak (2009), the existing tectonic structure and earthquake epicentre distribution (Fig. 1). Turkey was divided into 55 different zones, as shown in Fig. 1. New smaller zones were selected to compare such tectonic zoning in detail, in the same regions. Fig. 1 shows Turkey’s active tectonics and many details regarding Turkey’s tectonic structure can be found in Saroglu (1992), McClusky (2000) and Bozkurt (2001). The numbers of earthquakes occurring in each zone were sufficient for analysis; Table 1 shows the seismic zones in this study (numbered 1 to 55) with their tectonic environments.
Earthquakes’ frequency-magnitude distribution (seismic b-value)
Earthquakes’ magnitude distribution (Md) is usually parameterised using Gutenberg-Richter’s (G-R) power law relationship (Gutenberg B., Richter C.F., 1944); such frequency-magnitude relationship has been found to be applicable (in simplified form) as follows:
where N(M) is the cumulative number of events having a magnitude greater than M, b describes the slope of the size distribution of events and a is proportional to the productivity of a volume, or the seismicity rate.
The b-value is one of the most important statistical parameters for describing the size scaling properties of seismicity; b-values change roughly in the range of 0.3 to 2.0, depending on the different regions. However, average regional scale estimates of b-value are usually equal to 1 (Frohlich C., Davis S., 1993). Many factors can cause perturbation of average b-value (b~1.0); regions having lower b-values are probably regions subjected to higher applied shear stress after the main shock, whereas regions having higher b-values are areas which have experienced slip. High b-values are reported from areas having increased geological complexity, indicating the importance of multi-fracture areas; a low bvalue is thus related to a low degree of heterogeneity of cracked medium, large stress and strain, high deformation speed and large faults (Bayrak Y., Ozturk S., 2004).
Many methods can be usedfor calculating any region’s b-value but the maximum likelihood method is the most robust and widely-accepted method for estimating b-values (Aki K., 1965):
where M is average magnitude value and Mmin is minimum magnitude value. 0.05 in equation (2) is a correction constant. If b=1 and Mmin =1 is used, Maverage=3.25 will be obtained. However, this is an extreme Mminvalue. Mmin=1 did not occur in previous Turkish earthquake catalogues; Mmin in Turkish earthquake catalogues was around 3.0 until the beginning of the 2000s. Many stations have been built in Turkey, especially after two destructive earthquakes in 1999, minimum earthquake magnitude now being seen to be around 1.5 (average value may sometimes be higher than 3.25 which is not high value for Turkish earthquakes). The standard deviation of seismic b-value (95% confidence limit) may be determined using the equation suggested by Aki (1965) as î¶ 1.96b / ân, where n is the number of earthquakes used to make the estimate. This would yield ±0.1 0.2 confidence limits regarding b-value for a typical sample consisting of n=100 earthquakes. Such sample consisting of n=100 events represents a specific calculation. The number of earthquakes in this study was 97,737; Table 1 shows that sometimes 110 earthquakes were used (in region 13) or 10,328 earthquakes on other occasions (in region 34). This value for n=100 earthquakes is thus a typical sample for the aforementioned calculation.
Fractal dimension (correlation dimension, Dc) of epicentres’ spatial distribution
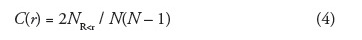
Earthquake distribution spatial patterns and temporal patterns of occurrence were demonstrated to be fractal using a two-point correlation dimension (Dc). Analysing correlation dimension is a powerful tool for quantifying a geometrical object’s self-similarity. Grassberger and Procaccia (1983) defined Dc and correlation sum C(r) as follows:
where C(r) is the correlation function, r is the distance between two epicentres and N is the number of pairs of events separated by distance R<r. If the epicentre distribution has a fractal structure, the following relationship would be obtained:
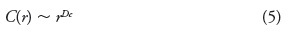
where Dc is the fractal dimension (more strictly, the correlation dimension). Distance r between two earthquakes would be calculated (in degrees) from:

where (θi,øi) and (θj,øj) are the latitudes and longitudes of the ith and jth events, respectively (Hirata T., 1989). By plotting C(r) against r on a double logarithmic coordinate, fractal dimension Dc would be obtained from the slope of the graph.
Fractal analysis is often used to quantify size scaling attributes and seismotectonic variables’ clustering properties. Fractal dimension Dc can be calculated to determine possible unbroken sites and such unbroken sites have been suggested as being potential seismic gaps to be broken in the future. Variations in fractal correlation dimension mainly depend on the complexity or quantitative measurement of the degree of heterogeneity of seismic activity in a fault system. In areas of increased complexity in an active fault system (higher Dc) associated with lower b-value, stress release occurs on fault planes having smaller surface area (Oncel A.O., Wilson T.H., 2002).
Results and Discussion
An investigation of seismotectonic parameters in and around Turkey involved using the b-value of the G-R relationship (Equation 1) and fractal correlation dimension Dc-value of Turkish earthquake distribution from 1970 to 2011; Turkey was divided into 55 seismic source zones in an attempt to find an empirical relationship between b-value and Dc-value. ZMAP software was used for calculating b and Dc-values for each region (Wiemer S., 2001). The b-values were calculated by using the maximum likelihood method (95% confidence limit) because it yields a more robust estimate than the least-square regression method (Aki K., 1965). The Dcvalues for all Turkish areas were obtained with 95% confidence limits by linear regression. Table 1 shows the results for two seismotectonic parameters with their standard deviations as well as the number of earthquakes for entire tectonic areas.
The first seismic parameter b-value ranged from 0.62 to 1.93 for 55 Turkish areas. b-values smaller than 0.8 were found in regions 1, 4, 9 and 11, including the north-eastern Anatolian fault zone (NEAFZ) including the Dumlu and Ãobandede fault zones, Igdir, Dogubeyazit and Ãaldiran faults (IDÇF) and two parts of the Bitlis-Zagros thrust zone (BZTZ). Such low values may have depended on the position of these regions neighbouring the easternmost part of the north Anatolian fault and the BZTZ. The conjugate strike-slip fault system related to these areas dominates eastern Anatolia’s active tectonics and thrust faults can produce destructive earthquakes in the Bitlis thrust which forms a complex continent-continent and continent-ocean collision boundary (Bozkurt E, 2001). These systems generate major earthquakes, such as Patnos in 1903 (MS=6.3), Pasinler in 1924 (MS=6.8), Lice-Diyarbakir in 1975 (MS=6.6), Ãaldiran in 1976 (MS=7.5) and Horasan in 1983 (MS=6.8). Global positioning system (GPS) data gives 10±2 mm/yr for total shortening between the strike slip faults in eastern Turkey and thrusting along the Caucasus. The BZTZ’s north-western motion is 18±2 mm/yr and such motion is related to that of Eurasia (McClusky S. et al., 2000); small b-values in these regions are thus related to a low degree of heterogeneity and large faults resulting in strong earthquakes.
The other small b-values changing between 0.8 and 1.0 were observed in regions 3, 5, 6, 12, 15, 16, 17 and 50 covering the Agri, Tutak, Balikligöl and Kagizman faults (ATBKF), the Baskale, Ercis, Muradiye and Suphan faults (BEMSF) and the Hasan Timur fault zone (HTFZ), the western part of BZTZ, the east Anatolian fault zone (EAFZ), the junction of a part of the Dead Sea fault and EAFZ, the eastern part of the north Anatolian fault zone (ENAFZ) including the Bingöl-Karakoçan and Sancak- Uzunpinar fault zones. Table 1 shows that regions 15, 16 and 17 are connected with the east EAFZ which is not as seismically active as the NAFZ. Unlike NAFZ, the EAFZ in region 15 has been relatively quiescent in the instrumental period compared to the historical period (McClusky S. et al., 2000). The data used in this study only included the instrumental period for earthquakes occurring from 1970 to 2011. According to the fault slip rate and observed seismicity during recent years, relatively larger b-values were observed in these regions than in regions 1, 4, 9 and 11. According to Scholz (1968), low b-values indicate that the state of stress is high. Special interest should thus be given to whole regions where low b-values have been observed, especially after the occurrence of the MW=6.0 Elazig earthquake (in region 15) on 8th March 2010 and the MW=7.2 Van Lake earthquake (in region 6) on 23rd September 2011.
earthquake (in region 6) on 23rd September 2011. Regions such as 2, 8, 21, 27, 46, 48, 49 and 52 have almost the similar b-values (very close to 1.0); these regions are related to the NEAFZ, the eastern part of BZTZ, the western part of the Cyprus Arc, the Burdur fault zone (BFZ), the Duzce fault (DF), the Yagmurlu-Ezinepazari fault zone (YEFZ) the another part of the ENAFZ and Surgu fault. The maximum b-value was estimated as being 1.93 in region 36, such region lying around the Soma and Bakirçay grabens. Other largest b-values greater than 1.5 were calculated in regions 18, 24, 35, 37 and 42; these zones were covered by the northern part of Cyprus, the Mugla and Rhodes region, the Kutahya and Simav grabens (KSG) and the Etili fault (EF). The b-values obtained for the rest of the zones were between 1.1 and 1.5. The NAFZ is a very active structure and, according to geodesy, accommodates 24±2 mm/ yr of dextral motion (McClusky S. et al., 2000). Two large earthquakes occurred in regions 44 and 46 during August and November 1999 and, of course, the stress level in these regions would thus not have been so high in recent years. The regions characterised by large ;b-values had a greater proportion of low magnitude earthquakes whereas regions having low bvalues represented areas in which large magnitude earthquakes occurred. b-values estimated using the maximum likelihood approach for the G-R method seemed to have a good relationship to the tectonics and level of seismicity.
The second seismotectonic parameter Dc-value ranged from 1.92-2.31 for the 55 tectonic source regions in Turkey and the surrounding areas. Dcvalues smaller than 2.0 were estimated in regions 14, 20, 24, 25, 36, 39, 42 and 53. These zones were related to the Karacadag extension zone (KEZ), the southern part of Cyprus including the eastern part of the Cyprus Arc, the Mugla and Rhodes region, the SBG, the Eskisehir, Inönu-Dodurga and Kaymaz faults (EIDKF), the EF, the central Anatolian fault zone (CAFZ) including the Yildizeli fault zone. Dc-values greater than 2.2 were observed in regions 1, 3, 4, 9, 11, 12, 16, 26 and 50 which were related to the NEAFZ including the Dumlu and Ãobandede fault zones, the ATBKF, the IDÃF, the BZTZ, the junction of part of the Dead Sea fault and the EAFZ, the Aegean Arc and the ENAFZ. Dc-values ranged from 2.0 to 2.2 in the rest of the seismic source areas. The results obtained from analysis of data along the NAFZ (regions 43-49) suggested that epicentre distribution became less clustered (higher Dc) as the probability of larger magnitude earthquakes became smaller (larger b-value). This implied greater fracture toughness in the central portions of the NAFZ. As stated in Oncel and Wilson (2002), stress becomes released on fault planes having smaller surface area in regions of increased complexity in an active fault system (higher Dc) associated with lower b-values. This means that areas in a fault network characterised by higher Dc-values would be associated with greater complexity in a fault pattern and the persistence of such complexity on smaller scales. Higher order fractal dimension (especially greater than 2.0) is increasingly sensitive to heterogeneity in magnitude distribution, suggesting that seismicity is more clustered at larger scales (or in smaller areas) in these fault zones. It may also be related to the number of events to a certain extent. Since the uniform distribution of earthquakes decreases with an increase in the clustering of events, it is reasonable to assume that higher Dc values (â¥2.2) and lower bvalues (0.8â¤) are the dominant structural feature in the study area and may have arisen due to clusters.
Correlation between b and Dc-value
This study was aimed at determining a statistical relationship between seismic b-values and fractal dimension Dc-value for Turkish epicentres. The orthogonal regression (OR) method (e.g, Carroll R.J., Ruppert D., 1996) was used to find the most suitable correlation between both seismotectonic parameters selected here. As the standard least squares method is based on the assumption that horizontal axis values are estimated without error (Carroll R.J., Ruppert D., 1996), OR was applied in fitting the relationship.
gives a graphical representations of OR fit between b and Dc-values for Turkish earthquake epicentres. Fig. 2 shows that the correlation coefficient of regression fit was very strong (r=-0.82). Linear fit was used for regression and the following equation was derived: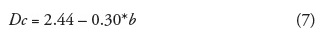
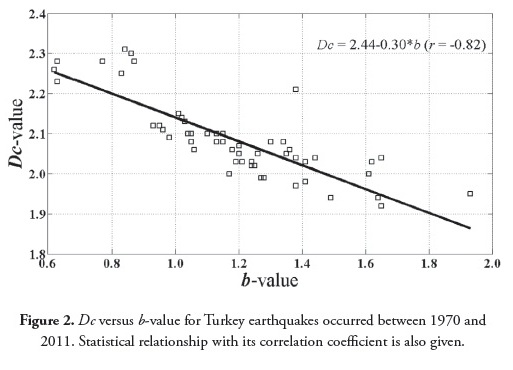
The correlation between fractal dimension and b-value has been studied in several parts of the world (e.g. Aki K., 1981; Hirata T., 1989; Henderson J. et al., 1992; Caneva A., Smirnov V., 2004; Roy S. et al., 2011) and particularly the Turkish region (e.g. Oncel A.O. et al., 1995 and 1996; Oncel A.O., Wilson T.H., 2002 and 2007). Since Aki (1981) proposed a simple relationship between b-value and fractal dimension having D=2b positive co-relationship, both positive (e.g. Oncel A.O., Wilson T.H., 2004; Roy S. et al., 2011) and negative co-relationships (e.g. Hirata T., 1989; Henderson J. et al., 1992; Oncel A.O. et al., 1995 and 1996) between these two scaling exponents have been reported and debated in the pertinent literature. Such co-relationships could even change from negative to positive (e.g. Oncel A.O., Wilson T.H., 2002 and 2007).
to positive (e.g. Oncel A.O., Wilson T.H., 2002 and 2007). Hirata’s results (1989) did not support Aki’s assumption that D=2b but showed, on the contrary, a negative co-relationship Dc=2.3-0.73*b (r=-0.77) between b and fractal dimension of epicentres in the Tohoku region of Japan. Henderson (1992) obtained a similar result for the Riverside catalogue in southern California. Similarly, a study of seismicity in the NAFZ, Turkey, revealed a long-term negative co-relationship between b and Dc (Oncel A.O. et al., 1995). The b-value was found to be weakly negatively correlated with fractal dimension Dc=2.74-1.52*b (r=-0.56) for the NAFZ (including the northern Aegean sea) by Oncel (1995). Oncel (1996) has also observed a strong negative correlation (r=- 0.85) between Dc and b-values as Dc=2.32-1.09*b was associated with the NAFZ. By contrast, Oncel and Wilson (2002) found weak positive correlation (r=0.48) between variations in b and Dc in the western NAFZ.
However, variability between b and Dc along the length of the fault zone in this study revealed divergence between b and Dc in the central NAFZ and spatial variation yielded a strong negative correlation (r=-0.85) between b and Dc. Analysis presented in Oncel and Wilson (2004) revealed a strong positive correlation (r=0.81) between Dc and b-values along the NAFZ preceding the 1999 Izmit earthquake. Oncel and Wilson (2007) observed a strong positive co-relationship between Dc and b-value during 1992-1994 (r=0.84) and 1996-1998 (r=0.94) and negative correlation (r=-0.71) extending from mid-1994 to mid-1996 in north-western Turkey. Table 2 T2 gives previous studies on the b-value and Dc-value relationship.
Conclusion
This study tried to estimate a suitable and reliable correlation between two seismotectonic parameters: b and Dc-values for Turkish earthquakes. Statistical analysis of the available data included 99,737 earthquakes from 1970 to 2011. The maximum likelihood method was used for calculating b-values and the linear regression technique for obtaining Dc-values (95% confidence limit). It was observed that the largest events were associated with low b and high Dc-values, respectively, implying relatively high stress intensity and stronger epicentre clustering.
Orthogonal regression was used for correlating the chosen seismotectonic parameters. The results showed strong negative correlation between b-value and fractal dimension Dc-value for Turkish earthquakes Dc = 2.44 - 0.30*b (r=-0.82) given by OR. The results had good agreement with previous studies for different parts of Turkey and the rest of the world.
Acknowledgements
The author would like to thank to Prof. Dr. Stefan Weimer for providing ZMAP software and anonymous reviewers for their useful and constructive suggestions in improving this paper. I am grateful to Dr. Dogan Kalafat (KOERI) for providing us with the earthquake catalogue. I would also like to thank KOERI for providing an earthquake database via internet.
References
Aki K. (1965): -Maximum likelihood estimate of b in the formula log N = a bM and its confidence limits-. Bull Earthq Res Inst Tokyo Univ. 43, 237-239. [ Links ]
Aki K. (1981): -Earthquake prediction-. Am Geophys Union. vol 4. Washington, pp 566-574. [ Links ]
Bozkurt E. (2001): -Neotectonics of Turkey -a synthesis-. Geodinamica Acta. 14, 3-30. [ Links ]
Bayrak Y., Ozturk S. (2004): Spatial and temporal variations of the aftershock sequences of the 1999 Izmit and Duzce earthquake. Earth Planets Space. 56, 933-944. [ Links ]
Bayrak Y., Ozturk S., Cinar H., Kalafat D., Tsapanos T.M., Koravos G.Ch., Leventakis G.A. (2009): Estimating earthquake hazard parameters from instrumental data for different regions in and around Turkey. Eng Geol. 105, 200-210, [ Links ]
Carrol R.J., Ruppert D. (1996): -The use and misuse of orthogonal regression estimation in linear errors-in-variables models-. The American Statistician. 50, 1-6. [ Links ]
Caneva A., Smirnov V. (2004): -Using the Fractal Dimension of Earthquake Distributions and Slope of the Reccurence Curve to Forecast Earthquakes in Colombia-. Earth Sci Res J. 8(1), 3-9. [ Links ]
Erdik M., Alpay B.Y., Onur T., Sesetyan K., Birgoren G. (1999): -Assessment of earthquake hazard in Turkey and neighboring regions-. Annali di Geofisica. 42, 1125-1138. [ Links ]
Frohlich C., Davis S. (1993): -Teleseismic b-values: Or, much ado about 1.0-. Journal of Geophysical Research 98 (B1), 631-644. [ Links ]
Grassberger P., Procaccia I. (1983): -Measuring the strangeness of strange attractors-. Physica 9(D), 189-208. [ Links ]
Gutenberg R., Richter C.F. (1944): -Frequency of earthquakes in California-. Bull Seismol Soc Am. 34, 185-188. [ Links ]
Henderson J., Main I.G., Meredith P.G., Sammonds P.R. (1992): -The evolution of seismicity-observation, experiment and a fracturemechanical interpretation-. J Struct Geol. 14, 905-913. [ Links ]
Hirata T. (1989): -Correlation between the b-value and the fractal dimension of earthquakes-. J Geophys Res. 94, 7507-7514. [ Links ]
Jimenez M.J., Giardini D., et al(2001): Unified seismic hazard modelling throughout the Mediterranean region1. Bolletino Di Geophysica Teorica Ed Applicata. 42, (1-2), 3-18. [ Links ]
Mandelbrot B.B. (1982): -The fractal Geometry of Nature-. Freeman Press, San Francisco. [ Links ]
McClusky S., Balassanian S.,et al. (2000): Global positioning system constraints on plate kinematics and dynamics in the eastern Mediterranean and Caucasus. J Geophys Res. 105 (B3), 5695-5719. [ Links ]
Oncel A.O., Alptekin A-., Main I.G. (1995): -Temporal variations of the fractal properties of seismicity in the western part of the North Anatolian fault zone: possible artifacts due to improvements in station coverage-. Nonlinear Processes Geophys. 2, 147-157. [ Links ]
Oncel A.O., Main I.G., Alptekin A-. Cowie P.A. (1996): -Temporal variations of the fractal properties of seismicity in the north Anatolian fault zone between 31A E and 41A E-. Pure Appl Geophys. 146, 148-159. [ Links ]
Oncel A.O., Wilson T.H. (2002): -Space-time correlations of seismotectonic parameters: Examples from Japan and from Turkey preceding the Izmit earthquake-. Bull Seism Soc Am. 92(1), 339-349. [ Links ]
Oncel A.O., Wilson T.H. (2004): -Correlation of seismotectonic variables and GPS strain- measurements inwestern Turkey-. J Geophys Res. 109 (B11), B11306. [ Links ]
Oncel A.O., Wilson T.H. (2007): -Anomalous seismicity preceding the 1999 Izmit event, NW Turkey-. Ggeophys J Int. DOI: 10.1111/j.1365- 246X.2006.03298.x. [ Links ]
OztAkrk S. (2009): -An application of the earthquake hazard and aftershock probability evaluation methods to Turkey earthquakes-. Doctoral dissertation, Karadeniz Technical University, Trabzon, Turkey (in Turkish with English abstract). [ Links ]
Roy S., Ghosh U., Hazra S., Kayal J.R. (2011): -Fractal dimension and bvalue mapping in the Andaman-Sumatra subduction zone-. Nat Hazards. 57, 27 37. [ Links ]
Azaroaylu F., Emre O., Kuaycu I. (1992): -Active fault map of Turkey-. General Directorate of Mineral Research and Exploration, Ankara, Turkey. [ Links ]
Scholz C.H. (1968): -The frequency-magnitude relation of microfracturing in rock and its relation to earthquakes-. Bull Seism Soc Am. 58, 399-415. [ Links ]
Wiemer S. (2001): -A software package to analyze seismicity: ZMAP-. Seismol Res Lett. 72(3), 373-382. [ Links ]
