


Services on Demand
Journal
Article
 English (pdf)
 Article in xml format
 Article references
 Send this article by e-mail
Indicators
-
 Cited by SciELO
 -
 Access statistics
Related links
-
 Cited by Google
 -
 Similars in
SciELO
Similars in
SciELO -
 Similars in Google
Share

 Permalink
Earth Sciences Research Journal
Print version ISSN 1794-6190
Earth Sci. Res. J. vol.17 no.1 Bogotá Jan./June 2013
Human health risk due to trace element contamination in groundwater from the Anjani and Jhiri river catchment area in northern Maharashtra, IndiaÂ
Golekar R. B.1, Patil S. N.2 and Baride M. V.3
1Departamento de Química, Facultad de Ciencias, Universidad Nacional de Colombia, sede Bogotá, Carrera 30 N° 45-03, Bogotá, Colombia.
1Department of Applied Geology, School of Environmental and Earth Sciences, North Maharashtra University Jalgaon, 425001 (M.S.), India E-mail: rbgolekar@gmail.com
2Department of Applied Geology, School of Environmental and Earth Sciences, North Maharashtra University Jalgaon, 425001 (M.S.), India E-mail: sanp2@rediifmail.com
3Department of Geology, Z.B. Patil College, Dhule 424002 (M.S.), India E-mail: baridemv@gmail.com
Corresponding author: M. V. Baride (e-mail): baridemv@gmail.com
Recibido: 24/10/2012 - Aceptado: 20/032013
ABSTRACT
The present study was aimed at assessing ground water chemistry, with reference to drinking water quality; the Anjani and Jhiri river catchment area in the Jalgaon district, northern Maharashtra, India, was selected. Ten ground water samples were collected from different locations in two urban areas (Daharangaon and Erandol) and some samples from rural water supply wells during the pre-monsoon 2011 and post-monsoon 2011 seasons. Trace elements were analysed from collected groundwater samples using standard techniques. The ground water pollution observed at some study area sites was mainly due to waste disposal and agricultural activities and vehicles burning fossil fuel. The present investigation was based on the occurrence of trace elements such as Fe, Zn, Cu, Ni, Mn, Pb and Cd in groundwater samples, concentration ranging from 0 to 0.096 ppm, 0.066 to 0.427 ppm, 0 to 0.012, 0.026 to 0.361 ppm, 0 to 0.160 ppm, 0.968 to 1.516 ppm and 0 to 1.064 ppm, respectively. The analysis of ground water chemistry and results were compared to BIS drinking water standards. The concentration of lead, cadmium and nickel exceeded the maximum permissible limit, as per BIS drinking water standards.
Key words: trace element, ground water, health hazard, Anjani - Jhiri River catchment area, northern Maharashtra, India.
RESUMEN
El presente estudio está enfocado en una evaluación química con referencia a los estándares de calidad del agua potable. Para su ejecución se seleccionó la zona de captación de los ríos Anjani y Jhiri, en el distrito Jalgaon, en Maharashtra, al norte de la India. Se recolectaron diez muestras de agua en diferentes locaciones de dos áreas urbanas (Daharangaon y Erandol) y algunas muestras en pozos de zonas rurales antes y después de la temporada monsónica de 2011. Los elementos Traza fueron analizados en las muestras con técnicas estandarizadas. La contaminación de las aguas subterráneas en algunas zonas de estudio se debe, principalmente, a la disposición de aguas residuales, a la actividad agrícola y al residuo generado por motores que trabajan con combustibles fósiles. La presente investigación se basó en la presencia de elementos Traza como Fe, Zn, Cu, Ni, Mn, Pb y Cd en los ejemplos hechos y que se concentran en rangos de 0 a 0.096 ppm; de 0.066 a 0.427 ppm; de 0 a 0.012 ppm; de 0.026 a 0.361 ppm; de 0 a 0.160 ppm; de 0.968 a 1.516 ppm, y de 0 a 1.064 ppm. El análisis químico de las aguas subterráneas y los resultados fueron comparados a los estándares de agua potable de BIS. Las concentraciones de cadmio y níquel, sobre todo, exceden el límite permitido por BIS.
Palabras clave: Elementos Traza, riesgos de salud, captación, ríos Anjani y Jhiri, Maharashtra, India.
Introduction
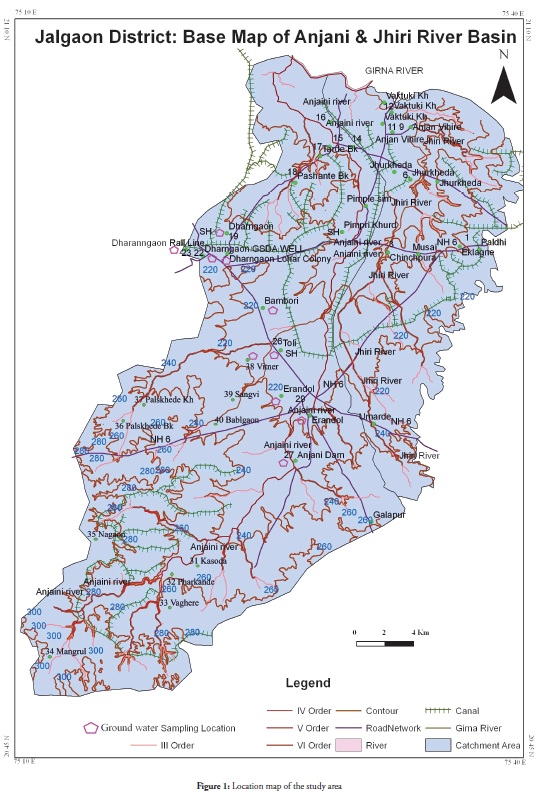
Ground water pollution is a major concern in urban areas in many countries around the world. The study area, the Anjani and Jhiri river catchment areas (TAPM006), covered part of northern Maharashtra, India.
Location map of study has shown in figure 1. This area’s drinking water supply depends upon the Anjani dam but rainfall has been very scanty during the last few years in the study area, groundwater being the only remaining source of water; ground water level has declined in the study area due to overexploitation. Some wells or bore holes’ ground water level
is deeper than 30 to 60 meters below the surface. Another major current issue in the study area concerns ground water quality which has been badly affected by urban waste water and the excessive use of pesticides/fertiliser in agricultural areas. Another source of ground water pollution may be heavy transport vehicles burning fossil fuel.
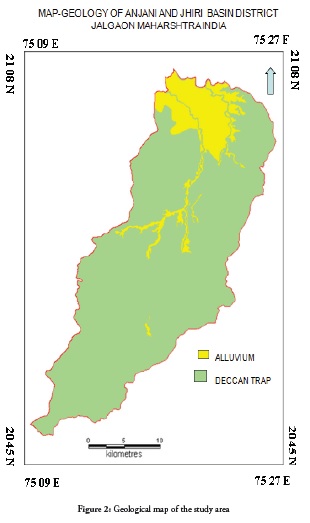
The study area is geologically covered by Deccan trap rocks from the Cretaceous to the lower Eocene age, consisting of amygdaloidal and vesicular basalts. Some areas are covered by thick alluvium from the Quaternary age along river channels. Geological map of study area has shown in figure 2. Hydro-geologically, the study area has two types of aquifer (shallower under unconfined and deeper under confined types). The study area’s ground water has been polluted due to the influence of waste water in groundwater and agricultural activities and transport burning fossil fuel. The results from of analysing ground water chemistry were compared to recommended guidelines as per Bureau of Indian standards (BIS-2003).
2. Materials and Method
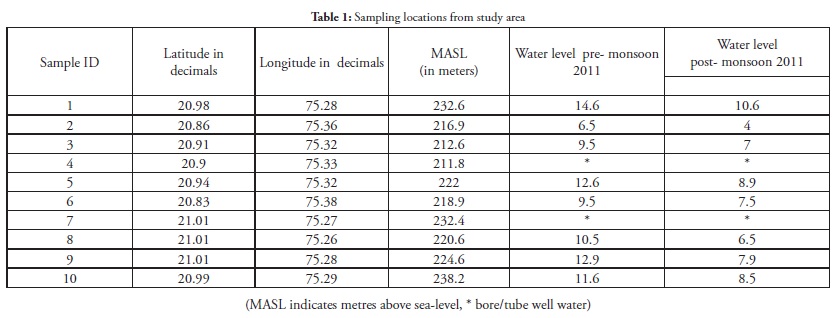
The 10 ground water samples were collected during May 2011 and November 2011 for pre-monsoon and post-monsoon periods, respectively. Water samples were collected from wells in clean one-litre polyethylene Indiasample bottles. Sampling locations are shown in Table 1.Water samples were analysed by adopting standard procedure (APHA, 1998). Trace elements Viz. Ni, Mn, Zn, Cd, Pb, Cu and Fe were analysed from ground water samples by Atomic Absorption Spectrometer (Thermo Scientific) using acetylene gas and hollow cathode lamps. The data obtained from hydro-chemical analysis was compared to BIS 2003 and WHO guidelines for drinking water standards. A global positioning system (GPS, Garmin make) was used for determining precise sampling point locations in the field and giving the exact latitude, longitude and altitude. Iso-concentration/contour maps were prepared with the help of Surfer 7.0 software to delineate spatial variation regarding trace elements from the study area’s groundwater samples.
3. Result and Discussion
3.1 Trace elements
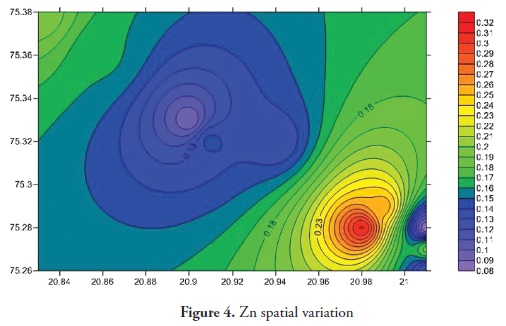
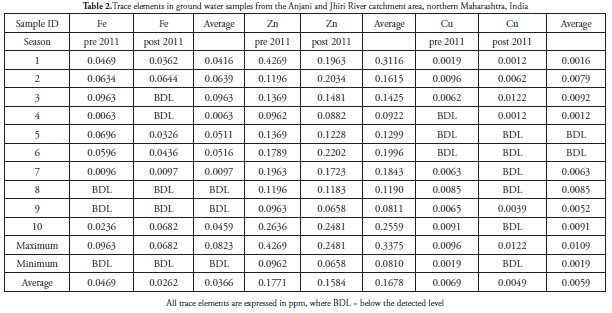
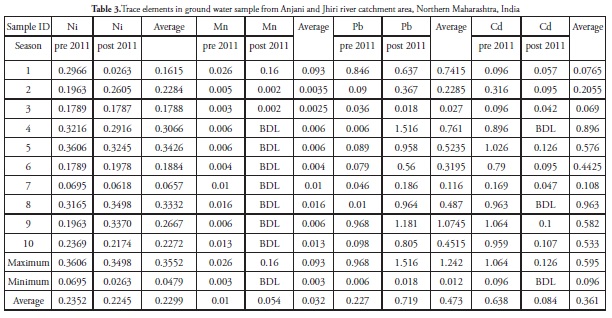
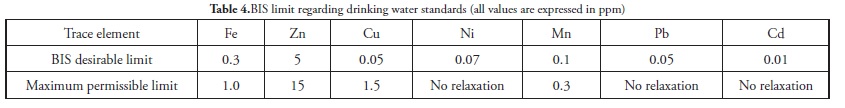
Trace elements primarily come from source rocks due to weathering and, in moderate contamination levels, are usually harmless to organisms; however, when their concentration increases they become considerably harmful to human and other living organisms. Trace elements have increased in ground water during the last few years as it has become contaminated by human activities, like agriculture, fossil fuel burning and industrial effluent, etc. It is clear that trace elements are entering aquatic systems from either point or non-point sources (Elder 1988). Trace element concentration in ground water was thus determined for the Anjani - Jhiri river catchment area, mainly consisting of urban and rural water supply wells. The results for trace elements are shown in Tables 2 and 3; the recommended guidelines as per Bureau of Indian standards (BIS-2003) are given in Table 4. Figures 3, 4, 5, 6, 7, 8 and 9 indicate spatial variation for Fe, Zn, Cu, Ni, Mn, Pb and Cd, respectively, regarding the present study area.
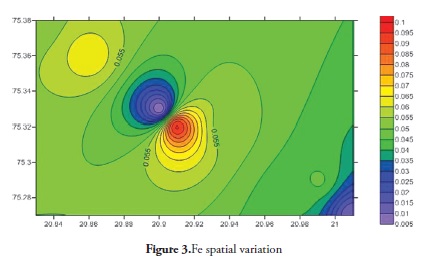

Iron
Fe concentrations were found during the pre-monsoon period in 2011, ranging from BDL to 0.096 ppm (average 0.047) and the post-monsoon period 2011 from BDL to 0.068 ppm (average 0.026 ppm). A maximum permissible Fe concentration of 1 mg/l for drinking purpose (BIS 2003) suggested that the all the samples from the study area were excellent.
Zinc
Zinc concentration during the pre-monsoon period 2011 ranged 0.096 to 0.427 ppm (average 0.177 ppm) and ranged from 0.066 to 0.248 ppm post-monsoon period 2011 (average 0.158 ppm). Zinc concentration in all samples of the study area within the permissible limit of (15 ppm BIS-2003). The main source of zinc was fertilisers, pesticides and herbicides used for agricultural purposes. Zinc is an essential element for human health and agriculture; it plays an important role in protein synthesis and carbohydrate metabolism (Tylor and Demayo, 1980). Zinc is relatively non-toxic up to 25 ppm in drinking water (MC Neely et al., 1979).
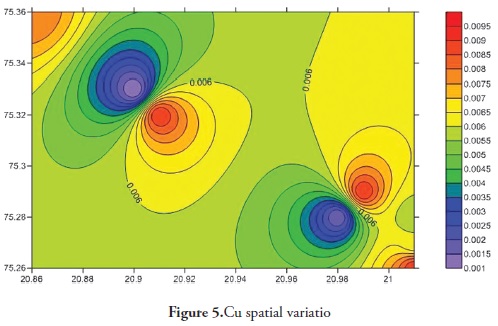
Copper
Cu ranged from 0.002 to 0.010 ppm (average 0.007 ppm) during the pre-monsoon period in 2011 and BDL to 0.012 during the post-monsoon period 2011 (average 0.005). Cu concentration in all water samples collected from the study area came within the maximum permissible limit (1.5 ppm, BIS 2003). Cu is an essential element for human health. It has a toxic effect on human health if the concentration is below the desirable limit. Anaemia, diarrhoea etc., can be caused due to Cu deficiency (Md. Abdullah Khan and Sarfaraz Ahmad, 2010). Overdoses of copper may also lead to neurological disorder, hypertension, liver and kidney dysfunction (Larocque and Rasmussen 1998; Rao et al. 2001; Krishna and Govil, 2004).
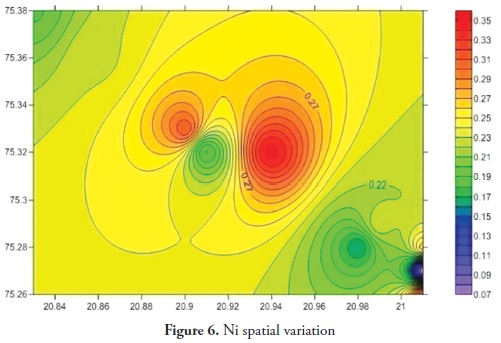
Nickel
Ni concentration during pre-monsoon season 2011 ranged from 0.070 to 0.361 ppm (average 0.235 ppm) and ranged from 0.026 to 0.350 during the post-monsoon season 2011 (average 0.225 ppm). Nickel concentration in most groundwater samples from the study area exceeded the permissible limit (0.07 ppm, BIS 2003). A higher nickel concentration is harmful to human health as this may lead to lung cancer (MC Neely et al., 1979).
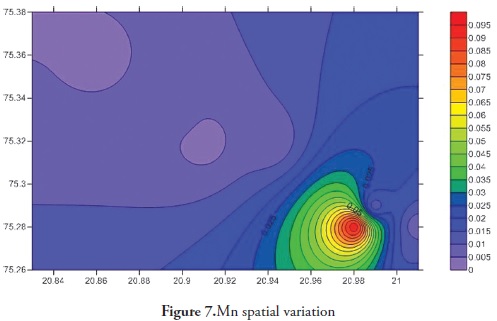
Manganese
Mn concentration during the pre-monsoon 2011 season ranged from 0.003 ppm to 0.026 (average 0.010 ppm) and ranged from BDL to 0160 levelppm post-monsoon season 2011 (average 0.054 ppm). Mn concentration in the study area was below the maximum permissible limit (0.5 ppm, BIS 2003). Manganese is an essential nutrient for humans; Mn deficiency can disrupt the central nervous system and reproductive functions (MC Neely et al., 1979).
Lead
Pb level during the pre-monsoon season 2011 varied from 0.006 to 0.968 ppm (average 0.227 ppm) and 0.018 to 1.516 during the post-monsoon season 2011 (average 0.719 ppm). 60% of water samples from the study area had a Pb concentration above the maximum permissible limit (0.05 ppm, BIS 2003); this suggested that the water was not suitable for drinking purposes in the study area. Lead is naturally present in trace amounts in all biological materials, i.e. in soil, water, plants and animals. The main source of lead contamination was due to transport burning fossil fuel (Smirjakova S et al., 2005).
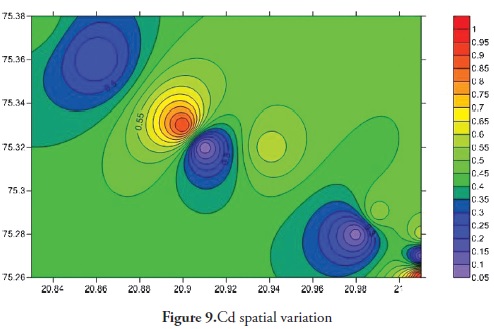
Cadmium
Cd in the pre-monsoon season 2011 varied from 0.096 to 1.064 ppm (average 0.638 ppm) and varied from BDL to 0.16 post-monsoon 2011 (average 0.084 ppm) in ground water samples from the study area. Cd concentration in 10 (55%) water samples was above the maximum permissible limit (0.01 ppm, BIS 2003); this suggested that the water was not suitable for drinking purposes in the study area. Cd is found in very low concentrations in most rocks; other sources of cadmium in groundwater come from burning fossil fuels and applying fertiliser, etc. Cd is found in basaltic rock (0.15 ppm) (Krasukopf K and Bird D, 1994), but is not essential for plants, animals and humans. Long-term exposure (over years or decades) to cadmium in drinking water may be a cause of kidney damage (BIS 2003) and can also lead to anaemia, cardiovascular disease and hypertension (Mielke H. W et al., 1991; Robards and Worsfold, 1991). Cadmium’s effect on the cardiovascular system can be explained by relating nutritional cadmium to hypertension (Schroeder, 1965).
Seasonal variation of trace elements in ground water
The percentage of average trace element concentration in ground water samples during the pre-monsoon and post-monsoon periods is given in Tables 2 and 3. A change in trace element concentration was observed with a change in season. Monsoon rainfall affected the concentration of most elements in different ways; the above Table shows that average Fe, Mn, Cd, Ni, Zn and Cu concentrations in ground water samples during the post-monsoon season were lower by varying degrees due to the dilution effect. On the other hand, Pb had a higher concentration in samples during the post-monsoon season. Surface run-off from the agricultural land where chemical fertilisers, pesticides and herbicides, etc, were present also contributed to enriching trace element concentration. Fe, Mn, Cd, Ni, Zn and Cu show had lower concentrations in post-monsoon ground water samples. The dilution effect shown by these elements was due to the influx of a greater amount of rainwater due to monsoon rainfall.
4. Conclusion
Ground water in the study area was polluted due to the influence of waste water from urban areas, excessive use of fertilisers and pesticide from agricultural areas and from transport burning fossil fuels. Most ground water samples had Pb, Ni and Cd concentrations exceeding the permissible limits recommended by BIS (2003) for drinking purposes.
Trace element concentrations in ground water were found to decrease in the following sequence: Cd >Pb> Zn > Ni > Fe > Cu >Mn. This study has thus shown that ground water in the study area was polluted by toxic and trace elements from samples collected during the pre-monsoon (May 2011) and post-monsoon seasons (December-2011).
The results showed that the ground water was significantly contaminated by Cd, Pb and Ni which might have led to various health problems. However, it has been assumed that the anomalous concentrations of Nickel in the vicinity of highways and industry resulted from anthropogenic input. Cd concentration in the study area was mainly due to its presence in basaltic rocks and Pb concentration was due to transport burning fossil fuels and farmers applying fertilisers.
Acknowledgements
Financial assistance, in the form of a Major Research Project (SR/S4/ES-328/2008), awarded to one of the authors (MVB) by the Department of Science and Technology (DST) Govt. of India, New Delhi, is gratefully acknowledged. The co-operation of North Maharashtra University officials is also acknowledged. The author would like to thanks unknown reviewers for their valuable comments and suggestions, which improved the quality of this manuscript.
5. References
APHA (1998) Standard methods for the examination of water and waste water, 19th edition. APHA, Washington DC, USA [ Links ]
BIS (2003) Drinking Water Standards (IS: 10500 91 revised 2003) [ Links ]
Edmonds, W. M. (1971) Hydro geochemistry of ground waters in the Derbyshire with special reference to trace Constituents Reports 71/7, Inst Geol. Sci. Great Britain [ Links ]
Elder (1988) Metal Biogeochemistry in Surface water system A revise of principles and concepts United States Geological Survey Circular 1013 pp 43 [ Links ]
Krasukopf Konrad and Bird Dennis K. (1994) Textbook of Introduction to Geochemistry Published by McGraw Hill INC 591 pp [ Links ]
Krishna, A. K., & Govil, P. K. (2004). Heavy metal contamination of soil around Pali industrial area, Rajasthan, India. Environmental Geology, 47, 38-44 [ Links ]
Larocque, A. C., & Rasmussen, P. E. (1998). An overview of trace metals in the environment: Mobilization to remediation. Environmental Geology, 33, 85-91 [ Links ]
McNeely R N Neimania v p and Dwyer L (1979) Water quality source book A guide to water quality parameter Inland water Directorate Water quality Branch Ottawa Canada pp 1-65 [ Links ]
Md. Abdullah Khan and Sarfaraz Ahmad (2010) trace metal concentration in the waters of Rivers and Ponds in valley Field Intermontane Basin In the eastern Himalaya [ Links ]
Mielke, H. W., Adams, J. L., Chaney, R. L., Mielke, P. W., and Ravikumar, V. C. (1991). The pattern of Cadmium in the environment of five Minnesota cities. Environmental Geochemistry and Health, 13, 29-34 [ Links ]
Rao, M. S., Gopalkrishnan, R., and Venkatesh, B. R. (2001) Medical geology-an emerging field in environmental science. In National symposium on role of earth sciences (pp. 213-222). Integrated and Related Social issues GSI Special. Pub. No. 65(II). [ Links ]
Robards, K., and Worsfold, P. (1991). Cadmium: Toxicology and analysis, a review. Analyst, 116, 549-568 [ Links ]
Schroeder, H. A. (1965). Cadmium as a factor in hypertension Journal of Chronic Diseases, 18, 647-656 [ Links ]
Smirjakova and Ondrasovicova O., Kaskova A., Lakticova K (2005) Folia Veternaria 49, 3 - Supplementum The effect of cadmium and lead pollution on human health pp 31- 32 [ Links ]
