Servicios Personalizados
Revista
Articulo
Indicadores
-
 Citado por SciELO
 -
 Accesos
Links relacionados
-
 Citado por Google
 -
 Similares en
SciELO
 -
 Similares en Google
Compartir
Earth Sciences Research Journal
versión impresa ISSN 1794-6190
Earth Sci. Res. J. vol.17 no.1 Bogotá ene./jun. 2013
Applying DC resistivity imaging to investigating the relationship between water quality and transpiration beneath circular islands in the Okavango Delta, Botswana: a case study of Thata Island
*E.M. Shemang1 L. N. Molwalefhe2 and K. Mickus3
1 Department of Earth and Environmental Sciences, Botswana International University of Science and Technology, P. Bag BO 041 Gaborone, Botswana
2 Department of Geology, University of Botswana, P. Bag UB 00704, Gaborone, Botswana
3 Department of Geography, Geology and Planning, Missouri State University Springfield, MO 65897 Missouri USA
*e-mail: shemange@biust.ac.bw; eshemang@yahoo.co.uk
Recibido: 08/10/2012 - Aceptado: 20/06/2013
ABSTRACT
An electrical resistivity survey was carried out on Thata Island, one of the numerous circular islands in the Okavango Delta, to investigate the mechanism governing interactions between surface water, vegetation and groundwater. Seven data profiles were collected across the island and modelling results indicated that the centre of the island had low resistivity values (less than 10 ohm-m), while resistivity values increased laterally outside the island. Such lateral resistivity zoning responded to variation in shallow groundwater chemistry below the islands having a high concentration of solutes inside and the presence of fresh water outside the islands. Borehole to surface resistivity imaging results for the island indicated a plume of saline water sinking to depths of 60 m. Groundwater salinity below the island ranged from 11.7 g/l from the margin of the island to 122 g/l at the centre of the island. Beyond the 60m depth, groundwater salinity dropped to about 0.33 g/l at the centre of the island. Lateral and down-hole imaging results, as well as water salinity values, showed a migrating plume of high salinity groundwater from the surface of the island invading a relatively deeper low-density fresh groundwater environment. Combining geochemical, isotopic and electrical resistivity data indicated that capillary evaporation may have been the most important mechanism in creating high saline water under the centre of the island; however, high transpiration rates along the edges of the island may have been important in producing salts which could migrate toward the island's centre. The results of this study showed how high salinity levels may have formed in near surface aquifers in natural inland delta environments in semi-arid areas.
Key words: seismic resistivity imaging, salinity, circular island, Okavango delta.
RESUMEN
Este estudio sobre la resistividad eléctrica fue llevado a cabo en Thata, una de las numerosas islas circulares en el Delta del Okavango, para analizar los mecanismos que gobiernan las interacciones entre la superficie acuática, la vegetación y las aguas subterráneas. Siete perfiles de datos fueron recolectados y los resultados modelados indicaron que el centro de la isla tiene bajos valores de resistividad (menos de 10 ohm-m), mientras que estos niveles se aumentan lateralmente fuera de la isla. Esta zonificación lateral de resistividad responde a la química de las aguas subterráneas poco profundas debajo de la isla que tienen una gran concentración de disoluciones al interior y presencia de agua fresca fuera del territorio. Perforaciones para medir los resultados de la resistividad en la isla mostraron una columna de agua salina que se hunde hasta 60 metros de profundidad. La salinidad de las aguas subterráneas en la isla oscila entre 11.7 g/l en el margen y 122 g/l en el centro. Debajo de los 60 metros de profundidad, la salinidad de las aguas profundas cae hasta el 0.33 g/l en el centro de la isla. Los resultados del sondeo lateral y debajo de las perforaciones, además de los valores de salinidad en el agua, mostraron una columna de alta salinidad en aguas subterráneas que se desplaza desde la superficie de la isla y que invade un ambiente de aguas subterráneas medianamente profundo de baja densidad. La combinación de datos geoquímicos, isotópicos y de resistividad eléctrica indican que la evaporación capilar podría ser el mecanismo más importante en la creación de la alta salinidad en el centro de la isla; sin embargo, la alta tasa de transpiración en los extremos de la isla podría ser importante en la producción de sal que se desplazaría hacia el centro. Los resultados de este estudio muestran cómo los niveles de alta salinidad podrían haberse formado en acuíferos superficiales de ambientes naturales al interior del delta, en áreas semiáridas.
Palabras clave: Resistividad sísmica, salinidad, isla circular, delta del Okavango
Introduction
Surface and groundwater salinisation presents a formidable threat to water supply and remains a major problem for the global environment, especially in semi-arid regions. Water quality issues in Botswana's Okavango Delta, specifically high salinity and nutrients and arsenic pollution, have limited water being used for rural water supply. Solutes can enter the delta system through several pathways. Solutes resulting from dust and ash fires (Garstang et al., 1998) and chemical weathering reactions are typically derived from atmospheric deposition in the headwater region in Angola. During transit both natural (saline groundwater encroachment, hydrothermal springs and evaporite deposit dissolution) and anthropogenic (agricultural return flow and domestic/industrial effluent waste water) sources may add solutes to the river system. These increases are magnified by evapotranspiration from open water, agriculture involving irrigation or natural riparian areas, thus influencing the chemistry of ground and surface waters in stream ecosystems. Nutrient concentration often alters when subsurface water flows through riparian areas. Therefore, groundwater-surface water interaction dynamics can affect riparian vegetation ecology (Hughes, 1990) and can influence wetland hydrology through transpiration and uptake of groundwater (Doss, 1993; Sacks et al., 1992; Winter and Rosenberry, 1995). The sensitive links between water quality, sediment, flora and channel hydraulics have already been established for the Okavango Delta (McCarthy and Ellery, 1994; Gieske, 1996, 1997; Ellery et al., 2003; Wolski and Murray-Hudson, 2006).
A growing population, along with associated activities and shifts in consumption patterns contributing to water quality deterioration, and pressure being exerted on the Okavango's water resource, makes it become necessary to understand the delta's ecology in terms of solute sources and recycling element and nutrient pathways within the delta and associated environments on a local and basin scale. Within this framework lies the answer to sustainable wetland management and maintenance of ecosystem integrity while undertaking economic activities such as the thriving tourism industry, agriculture and drinking water supply without causing dire consequences regarding the needs of the ecosystem, people, and wildlife.
The present study was therefore aimed at applying electrical and borehole resistivity to surface electrical resistivity imaging (ERI) techniques for providing accurate areal information regarding the subsurface of the Thata island area, in terms of subsurface electrical conductivity within Thata island and the surrounding area. The study was also aimed at mapping and delineating the lateral and vertical distribution of low electrical resistivity zones which might be linked to areas where high salinity occurs and becomes accumulated, as well as investigating the pattern and associated processes concerning salt accumulation within the island.
1.1 The Okavango Delta
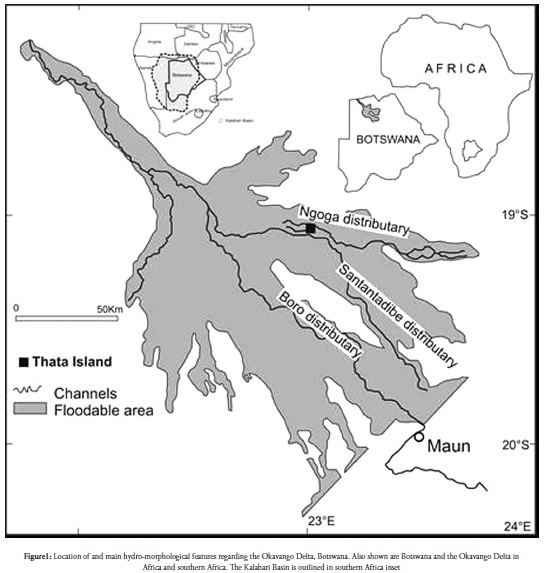
The Okavango Delta (Figure 1) is southern Africa's largest inland wetland (i.e. ∼12,000 km2, McCarthy et al., 2003) and is located on the northern fringes of the Kalahari desert (Figure 1). The delta is part of the Okavango River Basin (ORB), which spans the three riparian states of Angola, Namibia and Botswana. The Okavango Delta receives the annual arrival of a flood wave from the Angolan highlands bringing large volumes of water (Gieske, 1996, 1997; Wolski and Murray-Hudson, 2006) with lesser input coming from local rainfall. Both rainfall and flood pulse are temporally out of phase with rainfall occurring between November and March while the flood-cycle arrives in April, reaching its peak during August/September. Runoff from the catchment in Angola, some 600 km to the north, brings an estimated 11 cubic kilometres of water into the Okavango Delta (16 billion m3/yr of flood and rainfall; Gieske, 1996), carrying at least 300,000 tons (Bauer, 2004) of dissolved salts every year.
Within this flood-pulsed wetland with a mean surface gradient of approximately 1:3700, water is normally spread across through a complex system of meandering distributary branches, swamps and floodplains (McCarthy, 1992).
The surface water flowing out of the delta has a dissolved solid concentration (TDS) of about 90mg/L, only three times more concentrated (30mg/L) than the flows entering the delta (Bauer, 2004). The electrical conductivity of the groundwater beneath the centre of the islands may reach 40 mS/cm while that in the floodplain water ranges from 35.9 to 75.2 μS/cm, this being more than 500 times higher (Bauer, 2004). Total nitrogen in the surface water is less than 1mg/L while it may be around 5.2mg/L in the groundwater at the island's centre. Total phosphorus concentration in surface water is around 0.05 mg/L and about 22mg/L in the island's groundwater.
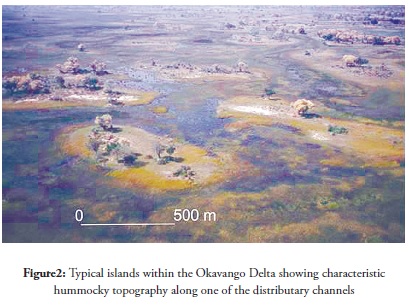
The Okavango Delta has been described as a mosaic of flat broad floodplains and round to shapeless islands (Figure 2); such islands vary in shape and size from several square metres to more than 500 km2 (Gieske, 1996; Wolski and Savenije, 2006). Irrespective of these morphological characteristics, all islands are usually fringed by a zone of broad leafed evergreen trees (phreatophytic) giving way to deciduous trees and eventually palms and open grassland. Such zoning results from a concentration gradient in the groundwater beneath the islands, due to evaporative uptake and reflects faunal species' differing degrees of salt tolerance (McCarthy and Ellery, 1994).
The depressed interior of the islands consists of bare soil having crusts of trona at the centre, precipitating from island groundwater because of evapotranspiration enrichment (McCarthy et al., 1991; McCarthy and Ellery, 1994) and may thus support only high salinity tolerant grasses.
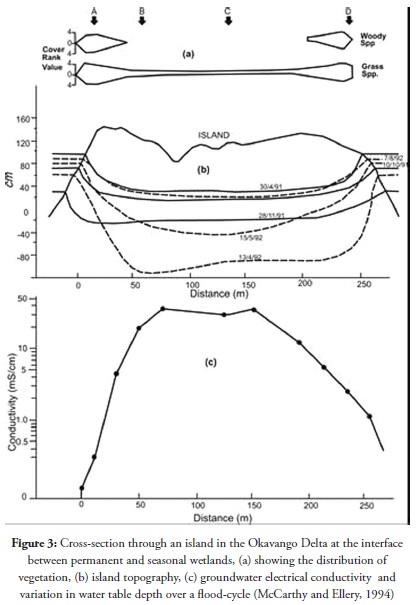
The water table below the islands (Figure 3) in the delta generally ranges from 0.5 m (Gieske, 1996) to almost 4 m below ground surface (Wolski and Savenije, 2006), depending on the time of the year and floodplain flood levels. Water table elevation usually decreases during the summer due to low rainfall and high evapotranspiration and increases rapidly early in the winter in response to the incoming floods. Groundwater level fluctuations are larger in the riparian belt (2 m) while being more stable at the centre of an island (0.5 m) where the groundwater table is normally depressed, so that groundwater continues to flow from the floodplains towards the islands throughout the year, i.e., no groundwater gradient reversal occurs during the flood subsidence phase (Gieske, 1996; Wolski and Savenije, 2006).
Groundwater salinity (determined by electrical conductivity) beneath islands in the downstream swamps is 50-100 times more concentrated than the surface water in the surrounding floodplains (Gieske, 1996; Bauer et al., 2006; Wolski et al., 2006). It also contains up to 400 times more phosphorus and five times more nitrogen inside the islands than in the floodplains, as Wolski has shown that nutrients and other inorganic ions accumulate underneath the islands (Wolski et al., 2006).
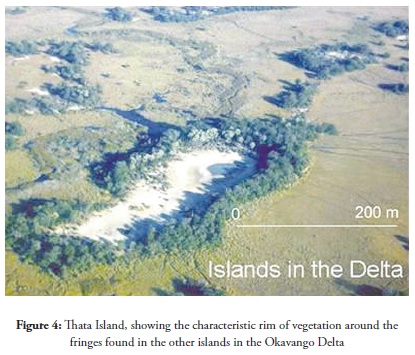
The preceding statements show that the existence and occurrence of shallow saline groundwater systems in the Okavango Delta's infill sediment provinces will indisputably be controlled by the delta's riparian structure and the history of flooding. However, more information is needed on this topic and this study was aimed at collecting additional electrical resistivity data regarding Thata Island (Figure 4: aerial photo) and our interpretation was aimed at supplementing Bauer et al.,'s electrical resistivity investigation (Bauer et al., 2006); they collected a series of 2-D electrical resistivity profiles across islands within the Okavango Delta, including Thata Island. They emphasised how near surface saline waters interact with deeper aquifers. 3-D inversion of surface resistivity data indicated that instability (called density fingers) brought the saline water to the deeper fresh water aquifers.
Thata Island is remotely located within one of the Okavango Delta's more extensive floodplains. This remote location makes it unaffected by all major anthropogenic sources of salt and nutrients which could interfere with its natural environment. The additional data collected by this study assisted in understanding the dynamic relationships between surface water, groundwater and vegetation regarding discrete salt build-up in a deltaic environment's water resources and conceptualising aquifer systems.
2.0 Data acquisition, processing and interpretation
The present study used ERI for studying surface and subsurface water interactions within islands in the Okavango Delta. ERI (also known as DC resistivity imaging or electrical resistivity tomography (ERT)) has become an increasingly popular method over the last decade for mapping subsurface electrical conductivity (Griffiths and Barker, 1993). It allows imaging groundwater salinity with relatively high spatial resolution, since formation resistivity as determined ERT strongly depends on groundwater salinity. ERT has been applied to mapping salt tracer movements in the subsurface (White, 1988; Bevc and Morrison, 1991; Kemna et al., 2002), as well as monitoring seawater intrusion (Gondwe, 1991; Kruse et al., 1998; Nowroozi et al., 1999). In addition to the geophysical experiment, groundwater sampling determined salinity and stable oxygen isotope content and depth to the water table.
2.1 Groundwater level measurement
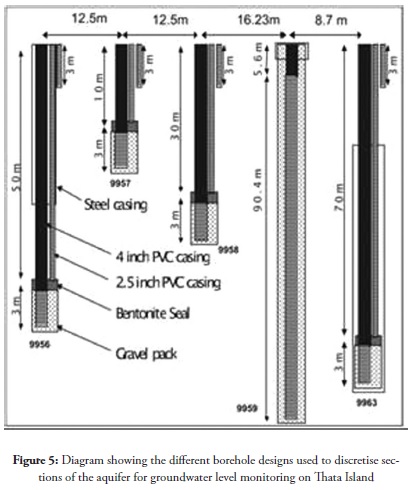
The depth to the groundwater table was determined through a network of deep boreholes and shallow piezometers located around Thata island. Piezometer depth varied from 3-73 meters and the deepest borehole was 96 meters. The bottom part of the pipes was slotted, covered with 3 m long filter pack and sealed using bentonite (Figure 5). All boreholes were cased in steel, depth depending on the desired aquifer level for monitoring.
2.2 Electrical resistivity imaging (ERI)
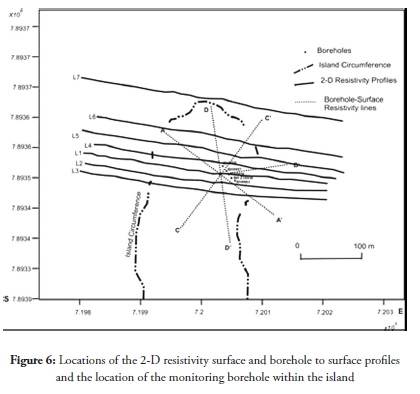
ERI in two-dimensional (2-D) profile mode was used for studying vertical and horizontal variation in electrical conductivity (resistivity) within and outside the Thata Island area. Seven data profiles were collected across the island in an east-west direction.
ABEM Lund Imaging System equipment was used for the survey as well as an IRIS SYSCAL R2 instrument having automatically-selected electrodes (Dahlin, 1996). The Wenner-Schlumberger array technique was used, current electrode spacing varying between 5 and 7.5 m. The profiles were arranged in such a way that the centre of each spread coincided with the centre of the island (Figure 6). One profile was situated outside the island in the swamps. Surface-to-borehole ERI was also carried out to increase surface imaging resolution using one of the boreholes drilled at the centre of the island. One current-potential pair of electrodes was positioned in the borehole and one pair on the surface for surface-borehole imaging (pure hole-surface configurations). The potential electrode in the hole was kept in a constant position to minimise the number of possible configurations. A radial electrode spread was used, such spread consisting of four profiles crossing each other at the centre of the salt accumulation zone (Figure 6) where the borehole was located. Each profile was then separated into two sections, incorporating 56 surface electrodes using 2m spacing and 24 borehole electrodes spaced at 4 m. After measurements for each section had been completed, the borehole cable was shifted 1 m and the measurements repeated. After completing two shifts and the second part of the profile measured in the same way, the combined data set was equal to a borehole-to-surface section having 112 surface and 96 borehole electrodes with the borehole in the centre. A typical data set for a profile consisted of around 6,000 single measurements.
2.3 Inverting 2-D ERI data
Resistivity data were inverted using a 2D smoothness-constrained inversion software (RES2DINV version 3.54) using a quasi-Newton technique to reduce calculations (Loke and Barker 1996). The inversion programme is a forward modelling method consisting of a number of rectangular blocks, block arrangement being loosely tied to data distribution in the pseudosection. The forward modelling subroutine calculated apparent resistivity values and a non-linear least-squares optimisation technique was used for the inversion routine (deGroot-Hedlin and Constable 1990; Loke and Barker 1996). Surface-borehole resistivity data were inverted as individual 2D vertical cross-sections.
3.0 Results and Discussions
3.1 Groundwater level measurement
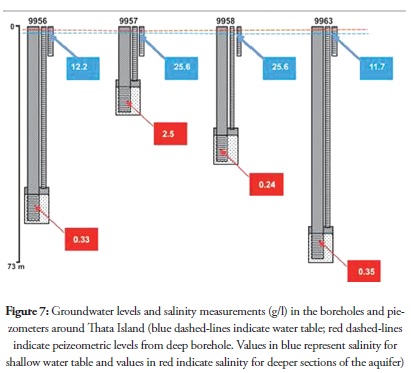
Groundwater levels beneath Thata Island varied between 2.79-2.82 m below the ground surface outside the riparian rim (Figure 7) and in the central parts of the island. Hydraulic pressure in each borehole for the deeper sections of the aquifer was higher than that measured in the shallow piezometers (i.e. 3 m depth). The foregoing may have indicated that the aquifer system had different hydraulic layers at depth and may have been (semi)confined at higher hydraulic pressure.
3.2 Groundwater salinity and δ18O
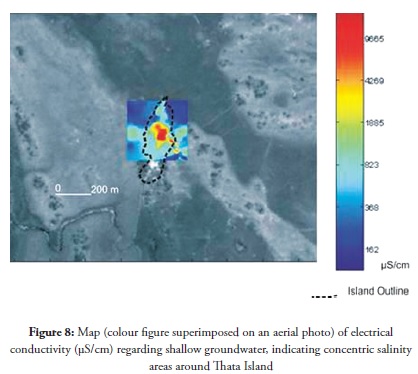
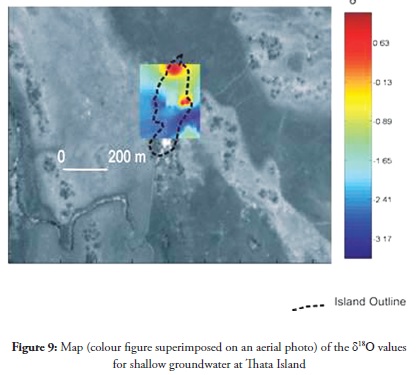
Groundwater salinity was measured for shallow piezometers and deep boreholes (Figure 7). Electrical conductivity was also much higher for areas lying directly beneath the centre of the island and was low in areas occupied by the swamp around the island (Figure 8). This showed that ions were being accumulated at the island centre and closer to the surface than at depth, because the groundwater became less saline with depth. Isotope measurements of groundwater δ18O were spatially out of phase with high salinity areas and showed enriched values of about +0.6 Ⱐat the island's margin directly beneath the vegetation rim, indicating intense transpiration activity in that area (Figure 9) compared to -3.17 Ⱐin the surrounding swamps. The fact that this area did not coincide exactly with areas of highest salinity indicated that transpiration was not the only process responsible for inorganic salt enrichment in the subsurface. Capillary evaporation was also important and was more prominent at the centre of the island; however, isotope results did not reveal which was more important.
3.3 Interpreting 2-D surface and surface-to-borehole resistivity sections
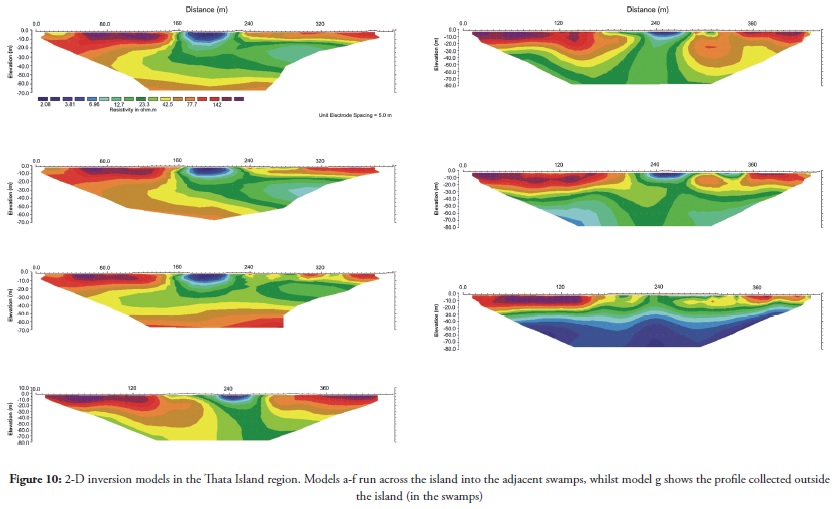
2-D resistivity profile inversion results are shown in Figure 10. As seen from the images in Figure 10, the central part of the profile consisted of low resistivity materials (about 10 Ωm) having increasing resistivity values (up to 150 Ωm) towards the edge of the profiles. The low resistivity seen in the central part of the island clearly suggested that the area was more conductive than other areas. Moving away from the centre of the island (towards the vegetation), imaged section resistivity values were seen be higher (about 50 Ωm). Resistivity values increased across the vegetation and into the swamps (up to 150 Ωm) being indicative of low ground conductance.
Low resistivity values for the central part of the island suggested that there may have been conductive fluids (saline water) associated with the fine clay-like materials characterising the centre of the island. The high salinity environment
on the resistivity images was seen to extend radially into the relatively fresh environment in the surrounding swamps. The saline horizon depth beneath the centre of the island (as interpreted Applying DC resistivity imaging to investigating the relationship between water quality and transpiration beneath circular islands in the Okavango Delta, Botswana: a case study of Thata Island from the 2-D models) was seen to persist up to 15 m below ground surface on all models, except 10 (L7).
Figure 10 (L7) shows the 2D inversion model of the profile collected outside the island. The model indicated that fresh water overlay saline water within the swamps and that such freshwater area persisted from the surface up to depths of about 25 m.
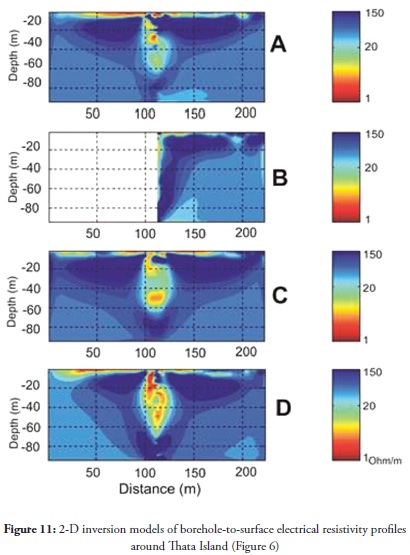
Surface to borehole imaging results (Figure 11) indicated that the low resistivity areas were mainly beneath the island and they existed mainly as plumes persisting to depths as great as 60 m. Lower conductivity, indicating fresh water was encountered below and next to these plumes.
The aforementioned modelling of electrical resistivity data indicated that Thata Island was underlain by saline water in its centre with less saline on its outer edges. However, oxygen isotopic data indicated that transpiration was highest along the island's edge, suggesting that salt accumulation may have been partially occurring due to some other mechanism, the most likely mechanism being capillary evaporation strongly occurring in winter months having little rain, high temperatures and low humidity. The isotopic data could not determine which mechanism was correct in the island's centre but low δ18O along its edges did show that capillary evaporation was important in the islands. The resistivity data did not suggest high salinity
groundwater at the edges, but instead showed high salinity at the centre resulting in vertical migration due to density contrasts and horizontal migration away from the centre due to hydrodynamic dispersion. This might have suggested that capillary evaporation at the centre is more important than evapotranspirative concentration at the islands' margins; however more detailed geochemical studies are needed.
4.0 Conclusions
This study has shown that the riparian areas of islands within the Okavango Delta were hotspots and warehouses for the discrete concentration of inorganic salts and other elements in the groundwater because of increased salinity as determined by surface and borehole-surface ERI data. The islands supported a variety of tree types and trees were potent transpiration pumps releasing water to the atmosphere at a high rate, as determined by δ18O measurements and by the depressed water table below the islands as this was always below the level of the surrounding swamps. Water was constantly lost beneath the islands, through evapotranspiration and groundwater became enriched in dissolved solutes, so that island centres were the final repositories of dissolved salts. The groundwater table was heavily depressed in the island's centre, resistivity values were low and δ18O values were enriched as salinity (electrical conductivity) gradually became accumulated.
ERI results revealed that fresh water overlay saline water in the swamps. This suggested that salinity beneath the islands or the saline water within the islands migrated below the fresh water in the swamps. The denser groundwater migrated downwards and eventually linked up with saline water from neighbouring islands displacing the fresh water and forming a saline layer at the bottom. This was believed to persist throughout the Okavango Delta and was responsible for both discrete salinity buildup below the islands and widespread shallow saline aquifers in the delta.
Whether evapotranspiration salt concentration, as indicated by enrichment of stable isotopes (Coplen et al., 2000), was sufficient to account for the high salinity in groundwater beneath the delta islands or whether there are other contributions from the terrestrial environment to these aquatic systems, remains enigmatic and requires further experimentation and research. The results of this study indicated that none of these methods (geochemistry, isotope or electrical resistivity) could uniquely determine the natural processes involved in creating high salinity environments; however, a unique model could be inferred when interpreted together. Whether, such model is unique to Thata Island is unknown as similar studies are needed at other islands within the Okavango Delta region. Our interpretation of the origin of localised high saline surface can be used as a first order model for similar regions worldwide.
5.0 References
Bauer, P. (2004). Flooding and salt transport in the Okavango delta, Botswana: Key issues for sustainable wetland management. A dissertation submitted to the Swiss Federal Institute of Technology Zurich. Diss. No. 15436. [ Links ]
Bauer, P. Supper, P., Zimmermann, S., and Kinzelbach, W. (2006). Geoelectrical imaging of groundwater salinizations in the Okavango Delta, Botswana. Journal of Applied Geophysics, 60, 126-141. doi:10.1016/j.jappgeo.2006.01.003 [ Links ]
Bevc, D., and Morrison, H.F. (1991). Borehole-to-surface electrical resistivity monitoring of a salt-water injection experiment. Geophysics 56, 769-777. doi:10.1190/1.1443094 [ Links ]
Chamberlain, T.A., Sellers, W., Protector, C., and Coard, R. (2000). Cave detection in limestone using ground penetrating radar, Journal of Archeological Science, 27, 957-964. doi:10.1006/jasc.1999.0525 [ Links ]
Coplen, T.B., Herczeg, A.L., and Barnes, C. (2000). Isotope engineering - using stable isotopes of the water molecule to solve practical problems: In environmental tracers in subsurface hydrology, P. Cook and A.L. Herczeg (Eds), Kluer academic, Dordrecht, pp. 79-110. [ Links ]
Dahlin, T., (1996). 2D resistivity surveying for environmental and engineering applications: First break, 14, 275-284. [ Links ]
DeGroot-Hedlin, C., and Constable, S. (1990). Occam's inversion to generate smooth, two-dimensional models from magnetotelluric data: Geophysics, 55, 1613-1624. doi:10.1190/1.1442813 [ Links ]
Doss, P.K. (1993) The nature and dynamics of water table in a system of non-tidal, freshwater coastal wetlands, Journal of Hydrology, 141, 107-126. doi:10.1016/0022-1694(93)90046-C [ Links ]
Ellery, W.N., McCarthy, T.S., and Smith, N.D. (2003). Vegetation, hydrology, and sedimentation patterns on the major distributary system of the Okavango Fan, Botswana, Wetlands, 23, 357-375. doi:10.1672/11-20 [ Links ]
Garstang, M., Ellery, W.N., McCarthy, T.S., Scholes, M.C., Scholes, R.J., Swap, R.J., and Tyson, P.D. (1998). The Contribution of Aerosol and Water-borne Nutrients to the Functioning of the Okavango Delta Ecosystem. South African Journal of Science, 94, 203-208. [ Links ]
Gondwe, E. (1991). Saline water intrusion in southeast Tanzania. Geoexploration 27 1-2, 25-34. doi:10.1016/0016-7142(91)90011-Z [ Links ]
Gieske, A. (1996). Vegetation driven groundwater recharge below the Okavango Delta (Botswana) as a solute sink mechanism - an indicative model, Botswana Journal of Earth Sciences, 3, 33-37. [ Links ]
Gieske, A. (1997). Modelling outflow from the Jao/Boro river system in the Okavango Delta, Botswana, Journal of Hydrology, 193, 214-239. doi:10.1016/S0022-1694(96)03147-2 [ Links ]
Griffiths, D.H., Barker, R.D. (1993). 2-dimensional resistivity imaging and modeling in areas of complex geology. Journal of Applied Geophysics 29, 211-226. doi:10.1016/0926-9851(93)90005-J [ Links ]
Hughes, F.M.R. (1990). The influence of flooding regimes on forest distriApplying bution and composition in the Tana river floodplain, Kenya, Journal of Applied Ecology, 27, 475-491. doi:10.2307/2404295 [ Links ]
Kemna, A., Vanderborght, J., Kulessa, B., and Vereecken, H. (2002). Imaging and characterisation of subsurface solute transport using electrical resistivity tomography (ERT) and equivalent transport models. Journal of Hydrology 267, 125-146. doi:10.1016/S0022-1694(02)00145-2 [ Links ]
Kruse, S.E., Brudzinski, M.R., and Geib, T.L. (1998). Use of electrical and electromagnetic techniques to map seawater intrusion near the Cross-Florida Barge Canal. Environmental and Engineering Geoscience 4, 331-340. [ Links ]
Loke, M.H., and Barker, R.D. (1996). Rapid least-squares inversion of apparent resistivity pseudosections by quasi-Newton method, Geophysical Prospecting, 44, 131-152. doi:10.1111/j.1365-2478.1996.tb00142.x [ Links ]
McCarthy, T.S., McIver, J.R., and Verhagen, B.T. (1991). Groundwater evolution, chemical sedimentation and carbonate brine formation on an island in the Okavango Delta swamp, Botswana. Applied Geochemistry, 6, 577-596. doi:10.1016/0883-2927(91)90071-V [ Links ]
McCarthy, T.S. (1992). Physical and biological processes controlling the Okavango Delta - a review of recent research, Botswana Notes and records, 24, 57-86. [ Links ]
McCarthy, T.S., and Ellery, W.N. (1994). The effect of vegetation on soil and groundwater chemistry and hydrology of islands in the seasonal swamps of the Okavango fan, Botswana. Journal of Hydrology, 154, 169-193. doi:10.1016/0022-1694(94)90216-X [ Links ]
McCarthy, J., Gumbrich, T., McCarthy, T.S, Frost, P.E., and Seidel, F. (2003). Flooding patterns of the Okavango wetland in Botswana between 1972 and 2000. Ambio 32, 453-457. doi:10.1579/0044-7447-32.7.453 [ Links ]
Nowroozi, A.A., Horrocks, S.B., and Henderson, P. (1999). Saltwater intrusion into the freshwater aquifer in the eastern shore of Virginia: a reconnaissance electrical resistivity survey. Journal of Applied Geophysics 42, 1-22. doi:10.1016/S0926-9851(99)00004-X [ Links ]
Sacks, L.A., Herman, J.S., Konikow L.F., and Vela A.L. (1992). Seasonal dynamics of groundwater-lake interactions at Doñana national park, Spain, Journal of Hydrology, 136, 123-254. doi:10.1016/0022-1694(92)90008-J [ Links ]
White, P.A. (1988). Measurement of groundwater parameters using saltwater injection and surface resistivity. Ground Water 26, 179-186. DOI: 10.1111/j.1745-6584.1988.tb00381.x [ Links ]
Winter, T.C. and Rosenberry, D.O. (1995). The interaction of groundwater with prairie pothole wetlands in Cottonwood Lake area, east-central North Dakota. 1979-1990, Wetlands, 15, 193-211. 10.1007/BF03160700 [ Links ]
Wolski, P., and Murray-Hudson, M. (2006). Flooding dynamics in a large low-gradient alluvial fan, the Okavango Delta, Botswana, from analysis and interpretation of a 30 year hydrometric record. Hydrology and Earth System Sciences, 10, 127-137. doi:10.5194/hess-10-127-2006 [ Links ]
Wolski, P., and Savenije, H.H.G. (2006). Dynamics of floodplain-island flow in the Okavango Delta, Botswana. Journal of Hydrology, 320, 283-301. doi:10.1016/j.jhydrol.2005.07.027 [ Links ]
Wolski, P., Murray-Hudson, M., Fernkvist, P., Liden, A., Hundsmann-Mapila, P., and Ramberg, L. (2006). Islands in the Okavango Delta as sinks of water-borne nutrients. Botswana Notes and Records, 37, 253-263. [ Links ]


