


Servicios Personalizados
Revista
Articulo
 Inglés (pdf)
 Articulo en XML
 Referencias del artículo
 Enviar articulo por email
Indicadores
-
 Citado por SciELO
 -
 Accesos
Links relacionados
-
 Citado por Google
 -
 Similares en
SciELO
Similares en
SciELO -
 Similares en Google
Compartir

 Permalink
Earth Sciences Research Journal
versión impresa ISSN 1794-6190
Earth Sci. Res. J. vol.17 no.2 Bogotá jul./dic. 2013
SEISMOLOGY
Detecting Ionospheric Precursors of a Deep Earthquake (378.8 km) on 7 July 2013, Mw=7.2, in Papua New Guinea under a Geomagnetic Storm: Two-Dimensional Principal Component Analysis
Jyh-Woei, Lin
Dept. of Earth Science, National Cheng Kung University, No. 1 University Road, Tainan City, Taiwan, Tel: +886-6-2757575 ext 65430. pgjwl1966@gmail.com
Manuscript received: 24/07/2013
Accepted for publication: 02/12/2013
ABSTRACT
Two-dimensional ionospheric total electron content (TEC) data were collected during the time period from 00:00 on 2 July to 12:00 UT on 08 July 2013. This period spanned 5 days before to 1 day after a deep earthquake (378.8 km) in Papua New Guinea at 18:35:30 on 7 July 2013 UT (Mw=7.2). Data were examined by two-dimensional principal component analysis (2DPCA) to detect TEC precursors related to the earthquake because TEC precursors have usually appeared in earlier time periods (Liu et al. 2006). A TEC precursor was highly localized around the epicenter on 6 July for 5 minutes, from 06:00 to 06:05. Ionizing radiation from radon gas release could possibly have caused the anomalous TEC fluctuation through, for example, a density variance. The plasma might have experienced large damping to cause short-term TEC fluctuations, and the gas released in a small amount in a short time period. 2DPCA can also identify short-term TEC fluctuations, but this fluctuation lasted for a considerable length of time. Other background TEC anomalies caused by the geomagnetic storm, small earthquakes and non-earthquake activities, e.g., equatorial ionization anomaly (EIA), resulted in small principal eigenvalues. Therefore, the detection of TEC precursors through large eigenvalues was not due to these background TEC anomalies.
Key words: Ionospheric Two-dimensional Total Electron Content, Papua New Guinea, TEC anomaly, Two-Dimensional Principal Component Analysis, Anomalous TEC fluctuations; Equatorial Ionization Anomaly (EIA)).
RESUMEN
Datos del contenido total de electrones ionosféricos en dos dimensiones (TEC) fueron medidos durante el período del 2 de julio de 2013, a las 0:00:00 horas GMT., hasta las 12:00 GMT. del 8 de julio. En este lapso se abarcan cinco días antes y un día después de un terremoto profundo (378,8 kilómetros) en Papúa Nueva Guinea, que se presentó a las 18:35:30 del 7 de julio (Mw=7.2). Los datos fueron examinados a través de los componentes principales en dos dimensiones (2DPCA) para detectar los precursores TEC relacionados al terremoto (Liu et al. 2006). Un precursor de los TEC fue localizado alrededor del epicentro el 6 de julio durante 5 minutos, desde las 06:00 a las 06:05. La radiación ionizada por la liberación de radón podría haber causado la fluctuación anómala de los TEC a través de, por ejemplo, una variación de densidad. El plasma podría haber experimentado una fuerte humectación lo que causaría fluctuaciones cortas de los TEC y la liberación de gas en pequeñas cantidades en poco tiempo. A través de los 2DPCA también se pueden identificar fluctuaciones cortas de los TEC, pero estas últimas duraron por un tiempo considerable. Otras anomalías en el entorno de los TEC causadas por tormentas geomagnéticas, pequeños terremotos y actividades no sísmicas, por ejemplo la anomalía ecuatorial de ionización (EIA, en inglés), resultaron en pequeños autovalores principales. Por lo tanto, la detección de precursores TEC a través de grandes valores propios no se debe al entorno de estas anomalías en los TEC.
Palabras clave: Contenido total de electrones ionosféricos en dos dimensiones, Papúa Nueva Guinea, anomalías TEC, análisis de componentes principales en dos dimensiones, fluctuaciones TEC anómalas, anomalía ecuatorial de ionización).
Introduction
Recent studies have shown that principal component analysis (PCA), which is a technique for mapping multidimensional data into lower dimensions with less loss of information (Kramer, 1991), can distinguish between the earthquake-related TEC anomalies and other possible causes of TEC disturbance, such as TEC long-term variance, solar flare and geomagnetic storm activity (Lin 2010; 2011). When applied to earthquake-related TEC anomalies, PCA has been able to detect and even describe the spatial pattern or physical shape of earthquake-related TEC anomalies (Lin 2011). TEC is an important quantity for describing the ionosphere of the earth. Lin's work in Taiwan (2010) used the one-dimensional TEC data from ground-based receiving stations near the epicenters of earthquakes to detect the earthquake-related TEC anomalies. The global ionospheric maps (GIMs) were decoded by image processing, and then the earthquake-related TEC anomalies were found by PCA (2011). In the current study, two-dimensional principal component analysis (2DPCA) was used to detect ionospheric TEC precursors related to an earthquake that occurred at 18: 35:30 on 7 July 2013 (UT) (Mw=7.2), with an epicenter of 3.939°S, 153.882 °E in Papua New Guinea. Interestingly, the epicenter was 378.8 km below the surface. Global ionospheric two-dimensional TEC data were collected from 2 July to 12:00 UT on 08 July 2013. This period began 5 days before this earthquake, providing time for any TEC precursors to develop and be revealed (Liu et al. 2006). TEC data were examined to detect TEC precursors, while GIMs were only used to observe the TEC situation.
GPS users with single-frequency receivers require ionospheric electron content information to achieve positioning accuracy that is similar to that of dual-frequency receivers. The GDGPS System provides a global real-time map of ionospheric electron content (currently producing a map every 5 minutes). These maps are also of value in monitoring the effect of the ionosphere on radio signals, power grids, and space weather. The maps are derived using data from approximately 100 real-time GDGPS tracking sites. The integrated electron density data along each receiver-to-GPS satellite link are processed through a Kalman filter to produce the global maps of TEC every 5 minutes. The maps are available redundantly from multiple GDGPS Operations Centers (GOCs) as images, as text files containing the gridded TEC values, or as a binary data stream containing the gridded TEC values (two-dimensional) (http://www.gdgps.net/products/tec-maps.html). The Kalman filter is performed to estimate both the differential orbit between the two satellites as well as a reference orbit, together with their associating dynamics parameters. The basic assumptions for performing a Kalman filter are that the two satellites are separated by a moderately long baseline (hundreds of km or less) and that they are of roughly similar shape. The differential dynamics, therefore, can be tightly constrained, strengthening the orbit determination. Without explicit differencing of GPS data, double-differenced phase biases are formed by a special transformation matrix. Integer-valued fixing of these biases is then performed, greatly improving the orbit estimation (Wu and Bar-Sever, 2005; Kechine et al 2004; Muellerschoen et al 2004; Ouyang et al 2008). The TEC data need to be corrected because of some biases or delays during the measurements of dual-frequency (L1 = 1575.42 MHz and L2 = 1227.60 MHz) delays of GPS signals, e.g., carrier phase biases, satellite state (orbit) corrections, ionospheric delay corrections and troposphere, which need to be removed using ground-based post-processing software (Raman and Garin., 2005; Wu and Bar-Sever, 2005).
2. Methods
2. 1 2DPCA
2DPCA is a procedure that can detect anomalies in two-dimensional data. Let the data be represented by a matrix B with dimensions m x n, where m, n>1 (for a map with m x n pixels of gray intensity). The linear projection of matrix B is considered as follows (Sanguansat 2012):
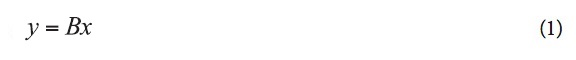
Here, x is a projection axis with dimensions of n x 1, and y is the projected feature of these data on x with dimensions of m x 1 and is called the principal component vector. E is the ensemble average of the elements of a vector. The covariance matrix for 2DPCA is defined as follows:

The trace of W is defined as:

The vector x maximizing Eq. 3 corresponds to the largest (principal) eigenvalue of W, and the largest eigenvalue is the most dominant component of the data. Therefore, the largest eigenvalue represents the principal characteristics of the data (Kong et al 2005; Sanguansat 2012, Jeong et al. 2009). 2DPCA can remove the small sample signal size (SSS) problem for two-dimensional TEC data (Fukunnaga, 1991). Traditional PCA converts the measurements into one-dimensional data before calculation of the covariance matrix (Yang et al. 2004). The covariance matrix of PCA is based on an input matrix with dimensions of m x n, which is reshaped from one-dimensional data (length of m multiplying n). Reshaping data will cause computational errors because PCA is a tool to address one-dimensional data. Therefore, when using PCA, the spatial structure information cannot be preserved well without some original information loss when inverting back to the original dimension when the reshaped matrix has a small sample size (SSS) (Kramer, 1991). Such information loss is called an SSS problem. However, the covariance matrix in 2DPCA is full rank for a matrix (two-dimensional data) without reshaping the data. Therefore, the challenges of dimensionality and the SSS problem can be avoided using 2DPCA (Kong et al 2005; Sanguansat 2012).
2.2 Data Processing using 2DPCA
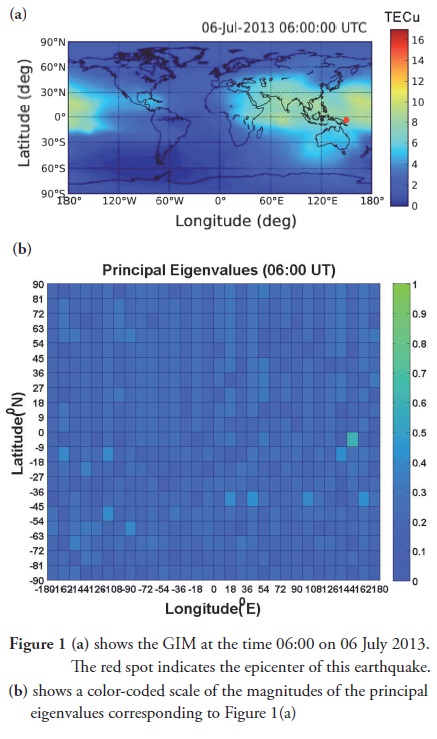
The TEC data for the mentioned time period were examined using 2DPCA. However, after the data processing, only one TEC precursor related to this earthquake was detected during the time period from 06:00 to 06:05 UT on 6 July 2012, which is approximately 1 day before the earthquake. Therefore, this study also processed the TEC data for this five-minute time period. The TEC data in other time periods were examined using the same data analysis, but these results are not shown because other earthquake-related anomalies were not detected. Figure 1 (a) shows the GIM at the time 06:00 UT. The red spot indicates the epicenter of this earthquake. This global region is divided into 600 smaller areas, 12° in longitude and 9° in latitude, to detect more detailed TEC situations. The spatial resolution of the TEC data for GDGPS system is 5 and 2.5 degrees in longitude and latitude, respectively (Hernández-Pajares et al. 2009; Chen and Gao 2005; Gao and Chen 2006) (http://www.gdgps.net/system-desc/references.html). Therefore, 4 TEC data (two-dimensional data) are collected in each area because the size of each small area is 12° in longitude and 9° in latitude. The 4 TEC data form the matrix B (which belongs to SSS data) with dimensions 2 x 2 for Eq. (1) to detect a TEC precursor related to the earthquake, which allows principal eigenvalues to be computed for each of the 600 smaller areas.
3. Results
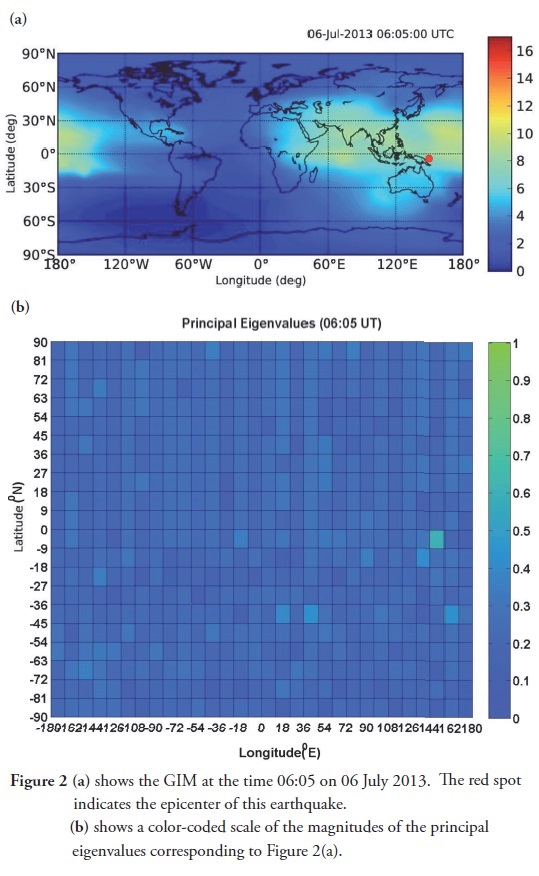
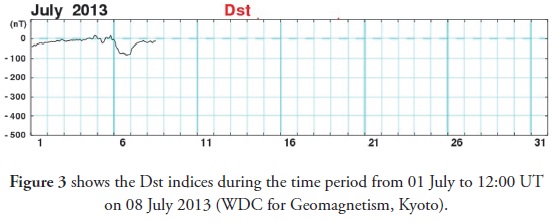
Figure 1(b) presents a color-coded scale of the magnitudes of principal eigenvalues corresponding to Figure 1 (a). The color intensity denotes the magnitude. From this figure, it can be observed that 600 principal eigenvalues are assigned. Each principal eigenvalue represents the TEC characteristic for each area. Figures 2 (a) and (b) show similar results at time 06:05 UT. The high intensity here shows the existence of a TEC precursor with a large principal eigenvalue calculated in the region of the epicenter for this large earthquake. This precursor had a duration of at least 5 minutes, from 06:00 to 06:05 UT. TEC anomalies from other small earthquakes and non-earthquake activities, e.g., equatorial ionization anomaly (EIA), in the same time period are not detectable. A large geomagnetic storm occurred during the examined time period, according to the Dst indices in Figure 3. TEC anomalies caused by the storm activity resulted in the small magnitude principal eigenvalues. Therefore, the geomagnetic storm activity and previous background anomalies can be eliminated as potential causes when detecting the TEC precursor of the earthquake.
4. Discussion
2DPCA was able to detect a TEC precursor around the epicenter of this earthquake. The precursor was detected from 06:00 to 06:05 UT with a duration of at least 5 minutes. Another earthquake-associated TEC anomaly after China's Wenchuan earthquake on 12 May 2008 (UT) (Mw=7.9) has been identified using PCA and image processing (Lin 2011). However, unlike the earthquake studied here, the Wenchuan earthquake was not a deep earthquake. Nevertheless, 2DPCA has detected and located a TEC precursor apparently related to such a deep earthquake. The physical reasons for this relation will now be considered. Accordingly, studies of TEC disturbance suggest three possible explanations for earthquake-associated anomalies. One is shock waves (Jin et al., 2010). Because the earthquake was very deep, it is not likely those acoustic shock waves from topside vibrations would be responsible for the TEC anomaly. The other possibility is the presence of an electric field creating large-scale, ionospheric density irregularities, e.g., P-type semiconductor effects due to stress variance in rocks near the focus of the earthquake (Pulinets and Legen'ka, 2003; Pulinets, 2004; Freund, 2003; Bošková et al. 1994; Rothkaehl et al. 2006). A more likely possibility is that TEC anomalies were being generated by radon release in the lower atmosphere rather than P-type semiconductor effects. P-type semiconductor effects would not be able to travel through the heterogeneous rocks that exist between the surface and 378.8 km down, and P and S type waves would have attenuated so greatly they would not have created adequate rock compression at the surface to generate the P-type semiconductor effect. Radon gas release, on the other hand, could occur through micro-cracks formed in the crust and the earth's surface. Radon gas can lead to lower-atmosphere electric fields, and these can travel unimpeded into the ionosphere along geomagnetic lines (Pulinets, 2004). This appears to be the most reasonable explanation for the TEC precursor. It implies that radon gas release might have caused the anomalous TEC fluctuation through, for example, a density variance.
5. Conclusion
2DPCA was used to detect a highly localized TEC precursor in the time period from 06:00 to 06:05 UT on 6 July 2013, which occurred approximately 1 day before the main shock of the July 7 2013 Papua New Guinea earthquake. The duration of the TEC precursor was at least 5 minutes. Radon gas release was a possible cause of the anomalous TEC fluctuations through, for example, a density variance.
Acknowledgements
The author is grateful to the NASA Global Differential GPS system (GDGPS) for its useful references and TEC data and to the memory of his own life in Germany as a student from 1996-2000.
References:
Bošková, J., J., Šmilauer, P. Tříska, and K. Kudela, 1994, Anomalous behaviour of plasma parameters as observed by the intercosmos 24 satellite prior to the iranian earthquake of 20 June 1990, Studia Geophysica et Geodaetica, Vol. 38, Issue 2, pp 213-220. [ Links ]
Chen, K and Y. Gao, 2005, Real-Time Precise Point Positioning Using Single Frequency Data. ION GNSS 2005, Long Beach, CA, USA, Sept.2005 [ Links ]
Freund, F. T., 2003, Rocks that crackle and sparkle and glow strange pre earthquake phenomena, J. Sci. Explor., 17(1), 37–71. [ Links ]
Gao, Y and K. Chen, 2006, Development of a Real-Time Single-Frequency Precise Point Positioning System and Test Results. ION GNSS 19th International Technical Meeting of Satellite Division, 26-29 September 2006, Fort Worth, TX [ Links ]
Hernández-Pajares, M., J. M. Juan, J. Sanz, R. Orus, A. Garcia-Rigo · J. Feltens, A. Komjathy, S. C. Schaer and A. Krankowski, 2009, The IGS VTEC maps: a reliable source of ionospheric information since 1998. J Geod, 83:263–275. DOI 10.1007/s00190-008-0266-1 [ Links ]
Jeong, D.H., C. Ziemkiewicz, W. Ribarsky and R. Chang, 2009, Understanding Principal Component Analysis Using a Visual Analytics Tool. Charlotte Visualization Center, UNC Charlotte [ Links ]
Jin, S., W. Zhu, and E. Afraimovich, 2010, Co-seismic ionospheric and deformation signals on the 2008 magnitude 8.0 Wenchuan earthquake from GPS observations, Int. J. Remote Sens., 31(13), 3535–3543, doi:10.1080/01431161003727739. [ Links ]
Kramer, M. A., 1991, Nonlinear Principal Component Analysis Using Autoassociative Neural Networks. AIChE Journal, Vol. 37, No. 2, pp. 233-243 [ Links ]
Kechine, M. O., C.C.J.M. Tiberius, H. van der Marel, 2004, Real-time Kinematic Positioning with NASA's Global Differential GPS System. GNSS Conference, St. Petersburg, Russia [ Links ]
Kong, H., L. Wang, E. K. Teoh, X. Li., J. G. Wang, R. Venkateswarlu, 2005, Generalized 2D principal component analysis for face image representation and recognition. Neural Networks, 18, 585–594 [ Links ]
Lin, J.W., 2010, Ionospheric total electron content (TEC) anomalies associated with earthquakes through Karhunen-Loéve Transform (KLT). Terrestrial, Atmospheric and Oceanic Sciences, 21, pp. 253-265. [ Links ]
Lin, J.W, 2011. Use of principal component analysis in the identification of the spatial pattern of an ionospheric total electron content anomalies after China's May 12, 2008, M=7.9 Wenchuan earthquake. Advances in Space Research. 47, 1983–1989. Doi:10.1016/j.asr.2011.01.013. [ Links ]
Liu, J. Y., Y.I. Chen, Y.J. Chuo, and C.S. Chen: 2006. A statistical investigation of pre-earthquake ionospheric anomaly. J. Geophys. Res. Space Phys., 111, A05304, 10.1029/ 2005JA011333. [ Links ]
Muellerschoen, R., B. Iijima, R. Meyer, Y. Bar-Sever, E. Accad, 2004, Real-Time Point Positioning Performance Evaluation of Single-Frequency Receivers Using NASA's Global Differential GPS System Jet Propulsion Laboratory, California Institute of Technology, ION GNSS Meeting, Long Beach, CA, September 2004. [ Links ]
Ouyang, G., J. Wang, J. Wang and D. Cole, 2008, Analysis on Temporal-Spatial Variations of Australian TEC. International Association of Geodesy Symposia, 2008, Volume 133, Part 4, 751-758, DOI: 10.1007/978-3-540-85426-5_86 [ Links ]
Pulinets, S. A., 2004, Ionospheric precursors of earthquakes; recent advances in theory and practical applications, Terr. Atmos. Oceanic Sci., 15(3), 413–435. [ Links ]
Pulinets, S. A., and A. D. Legen'ka, 2003, Spatial-temporal characteristics of the large scale disturbances of electron concentration observed in the F region of the ionosphere before strong earthquakes, Cosmic Res., Engl. Transl., 41, 221–230, doi:10.1023/A:1024046814173. [ Links ]
Sanguansat, P, 2012, Principal component analysis, Published by InTech, ISBN 978-953-51-0195-6, 1-23, pp.300 [ Links ]
Raman, S. and L. Garin., 2005, Performance Evaluation of Global Differential GPS (GDGPS) for Single Frequency C/A Code Receivers. SiRF Technology, Inc. [ Links ]
Rothkaehl, H., R. Bucik and K. Kudela, 2006, Ionospheric plasma response to the seismic activity, Physics and Chemistry of the Earth, Vol. 31, Issue 4-9, pp. 473-481 [ Links ]
Wu, S and Y. Bar-Sever, 2005, Real-Time Sub-cm Differential Orbit Determination of Two Low-Earth Orbiters with GPS Bias Fixing Jet Propulsion Laboratory, California Institute of Technology. TX, USA, Sept.2005 [ Links ]
Yang, J., D. Zhang, A.F. Frangi., J.Y Yang, 2004, Two-dimensional PCA: a new approach to appearance-based face representation and recognition. IEEE Transactions on Pattern analysis and Machine Intelligence, Vol. 26, No. 1, pp.131-137. [ Links ]
